CHAPTER 1 - MARKET SUMMARY
Market Overview
The India Real Estate Brokerage, Advisory, Underwriting & Loan Syndication Market connects property owners, developers, occupiers and capital providers through transaction execution, valuation, financing and risk-placement services. India recorded institutional real estate investment of USD 8.5 billion in 2025, increasing the addressable fee pool for investment advisory, due diligence and capital structuring mandates.
Revenue is concentrated in Bengaluru, Mumbai, Delhi NCR, Hyderabad, Chennai and Pune, where large office, residential and institutional transactions require professional intermediaries. Gross office leasing reached approximately 83.3 million sq ft in 2025, while Bengaluru contributed about 29% of reported activity. Scale supports specialist teams, proprietary transaction data and recurring occupier relationships.
Market Value
USD 4,000 million
2025
Dominant Region
West India
2025
Dominant Segment
Brokerage Services
fastest growing: Loan Syndication Services, 2025-2032
Total Number of Players
112,712
Future Outlook
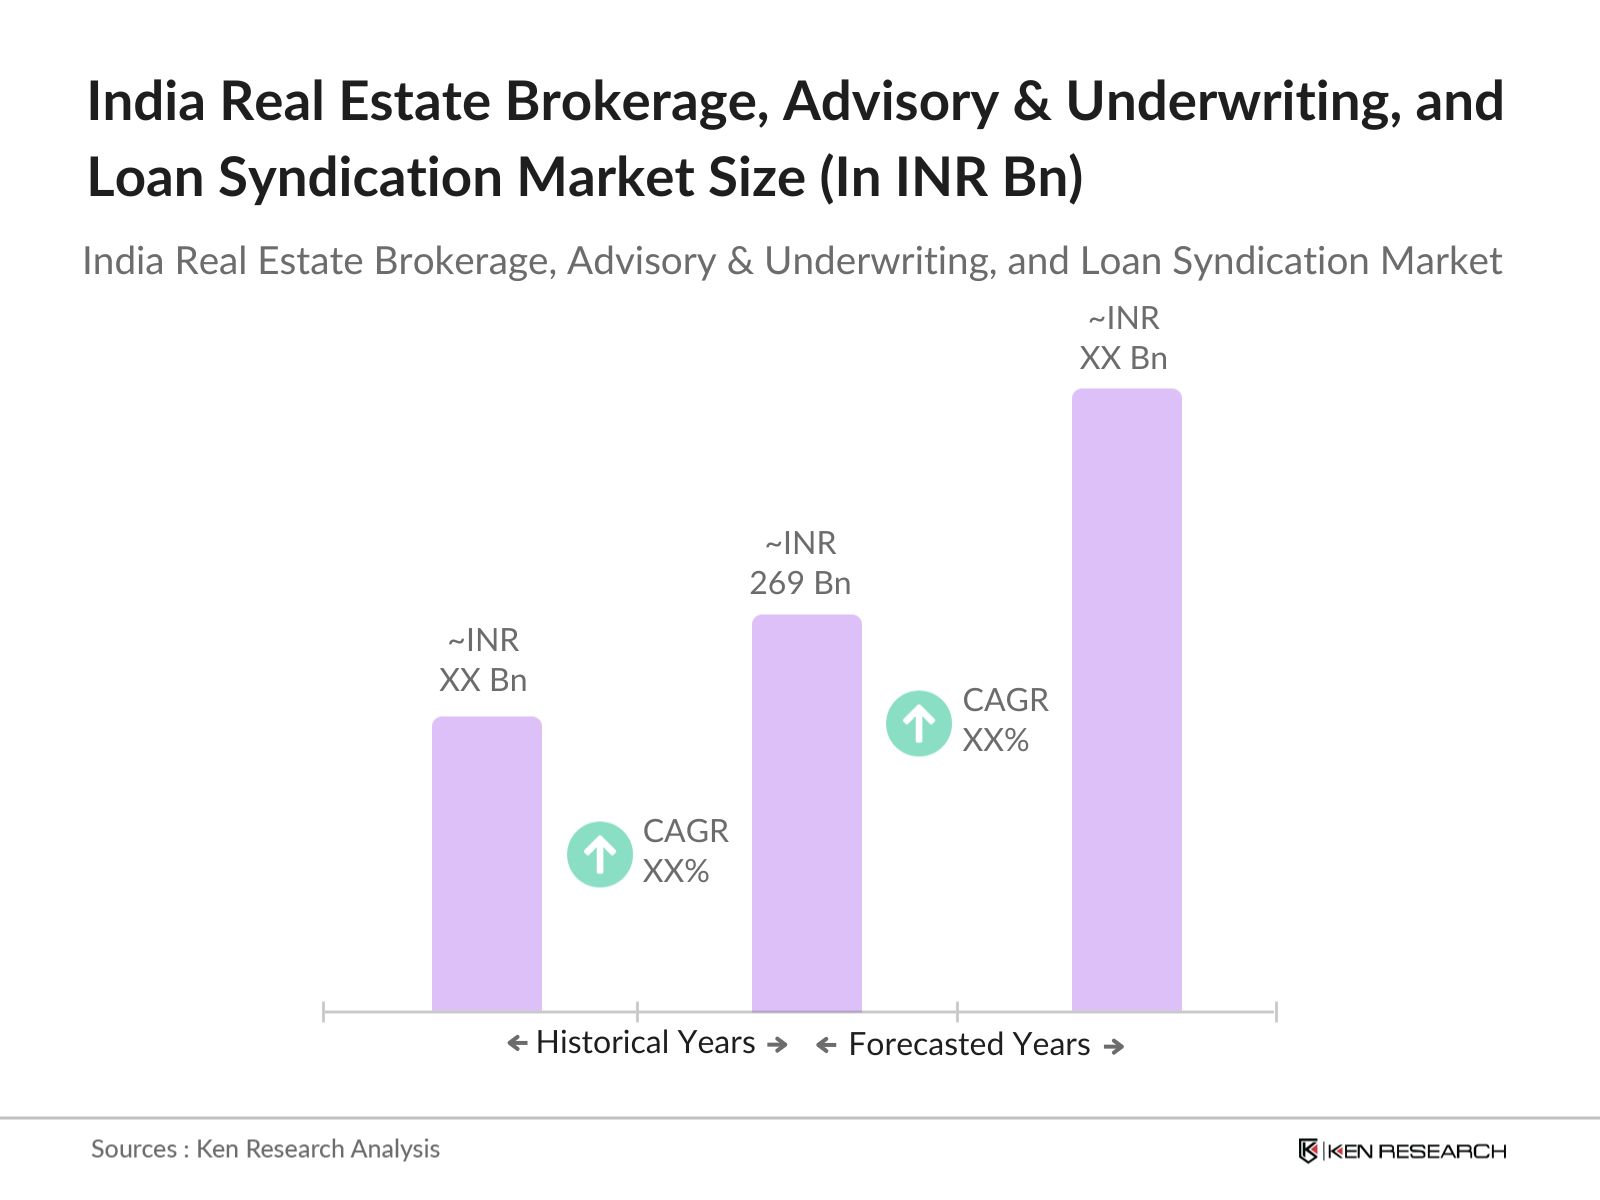
The market is projected to increase from USD 4,000 million in 2025 to USD 7,598 million by 2032, representing a 9.60% CAGR. Growth will be supported by transaction formalization, institutional investment, office leasing, warehousing expansion and rising use of structured credit. The historical 8.20% CAGR during 2020-2025 reflected a sharp pandemic disruption followed by recovery in residential sales and commercial leasing. Brokerage remains the largest revenue pool, but advisory and syndication should capture a rising share as transactions become larger, multi-party and more regulated.
Digital lead generation will improve broker productivity, although execution-intensive institutional mandates will remain relationship-led. Loan syndication is expected to outgrow the market as developers diversify beyond conventional construction finance toward private credit, AIFs and structured debt. Institutional investment reached USD 8.5 billion in 2025, providing a strong capital-markets pipeline. Operators with valuation capability, lender access, data systems and execution teams should gain share, while undifferentiated agents face pricing pressure. Regulatory compliance, credit-cycle volatility and uneven transaction transparency remain the principal downside risks through 2032.
9.60%
Forecast CAGR
$7,598 Mn
2030 Projection
Base Year
2025
Historical Period
2020-2025
Forecast Period
2025-2032
Historical CAGR
8.20%
CHAPTER 2 - SCOPE OF REPORT
Scope of the Market
CHAPTER 3 - Key Stakeholders
Key Target Audience
Key stakeholders who can leverage this market analysis for investment, strategy and operational planning.
Investors
CAGR, fee pools, consolidation, margins, credit-cycle risk
Corporates
occupancy cost, site selection, lease terms, portfolio optimization
Government
RERA compliance, transparency, capital access, urban development
Operators
mandates, conversion, commissions, productivity, client retention
Financial institutions
syndication pipeline, collateral, covenants, credit quality, exits
CHAPTER 4 - Market Size & Growth
Market Size, Growth Forecast and Trends
This section evaluates historical market size, year-over-year growth dynamics and forecast projections supported by transaction, investment and operating indicators.
Historical & Projected Market Size ($ Million)
Year-over-Year Growth Rate (%)
Market Value vs Volume Growth (%)
Historical Market Performance (2020-2025)
Market revenue expanded at an 8.20% CAGR from 2020 to 2025. The 2020 trough reflected delayed property decisions and restricted physical site activity. Recovery strengthened through 2022 as residential transactions normalized, while institutional and office mandates accelerated in 2024-2025. The 2025 inflection, at 9.29% year-over-year growth, reflected higher transaction values, capital-market activity and increased demand for integrated advisory rather than only property introductions.
Forecast Market Outlook (2025-2032)
Revenue is forecast to grow at 9.60% annually to 2032. Transaction volume is modeled to rise more slowly than value, indicating a favorable mix effect from institutional mandates, structured debt and valuation-led assignments. Loan syndication and capital advisory should expand faster than traditional brokerage as lenders apply stronger underwriting standards and developers diversify funding. Digital platforms will reduce customer-acquisition costs in standardized residential brokerage but will not fully replace complex transaction execution.
CHAPTER 5 - Market Data
Market Breakdown
The market combines high-volume property brokerage with higher-value advisory, underwriting and financing assignments. Its growth trajectory is increasingly linked to transaction complexity and capital intermediation.
Year | Market Size (USD Mn) | YoY Growth (%) | Institutional Investment (USD Bn) | Office Leasing (Mn sq ft) | Formal Agent Penetration (%) | Period |
|---|---|---|---|---|---|---|
| 2020 | $2,698 Mn | +- | 4.8 | 25.8 | Forecast | |
| 2021 | $2,900 Mn | +7.49% | 4.0 | 38.1 | Forecast | |
| 2022 | $3,150 Mn | +8.62% | 4.9 | 50.3 | Forecast | |
| 2023 | $3,390 Mn | +7.62% | 5.4 | 58.2 | Forecast | |
| 2024 | $3,660 Mn | +7.96% | 6.6 | 79.0 | Forecast | |
| 2025 | $4,000 Mn | +9.29% | 8.5 | 83.3 | Forecast | |
| 2026 | $4,384 Mn | +9.60% | 9.0 | 86.0 | Forecast | |
| 2027 | $4,805 Mn | +9.60% | 9.6 | 89.5 | Forecast | |
| 2028 | $5,266 Mn | +9.59% | 10.3 | 93.0 | Forecast | |
| 2029 | $5,771 Mn | +9.59% | 11.1 | 97.0 | Forecast | |
| 2030 | $6,325 Mn | +9.60% | 12.0 | 101.0 | Forecast | |
| 2031 | $6,932 Mn | +9.60% | 12.9 | 105.5 | Forecast | |
| 2032 | $7,598 Mn | +9.61% | 13.9 | 110.0 | Forecast |
Institutional Investment
USD 8.5 billion, 2025, India. Record inflows increase investment-sale, valuation, due-diligence and debt-advisory mandates; domestic capital and platform transactions expand the accessible fee pool.
Office Leasing
18.3 million sq ft, Q1 2026, top seven Indian cities. High leasing velocity strengthens occupier advisory and landlord-representation pipelines, particularly in technology and GCC-led corridors.
Formal Agent Base
112,712 registered agents, 2026, India. Formal registration improves traceability but intensifies competition, increasing the strategic value of institutional relationships, analytics and differentiated execution.
CHAPTER 6 - Segmentation
Market Segmentation Framework
Comprehensive analysis across key dimensions providing insights into market structure, customer preferences and service-delivery patterns.
No of Segments
7
Dominant Segment
Service Type
Fastest Growing Segment
Revenue Model
Key Segmentation Takeaways
Comprehensive analysis across all extracted segmentation dimensions provides insight into market structure, customer requirements and distribution patterns.
Service Type
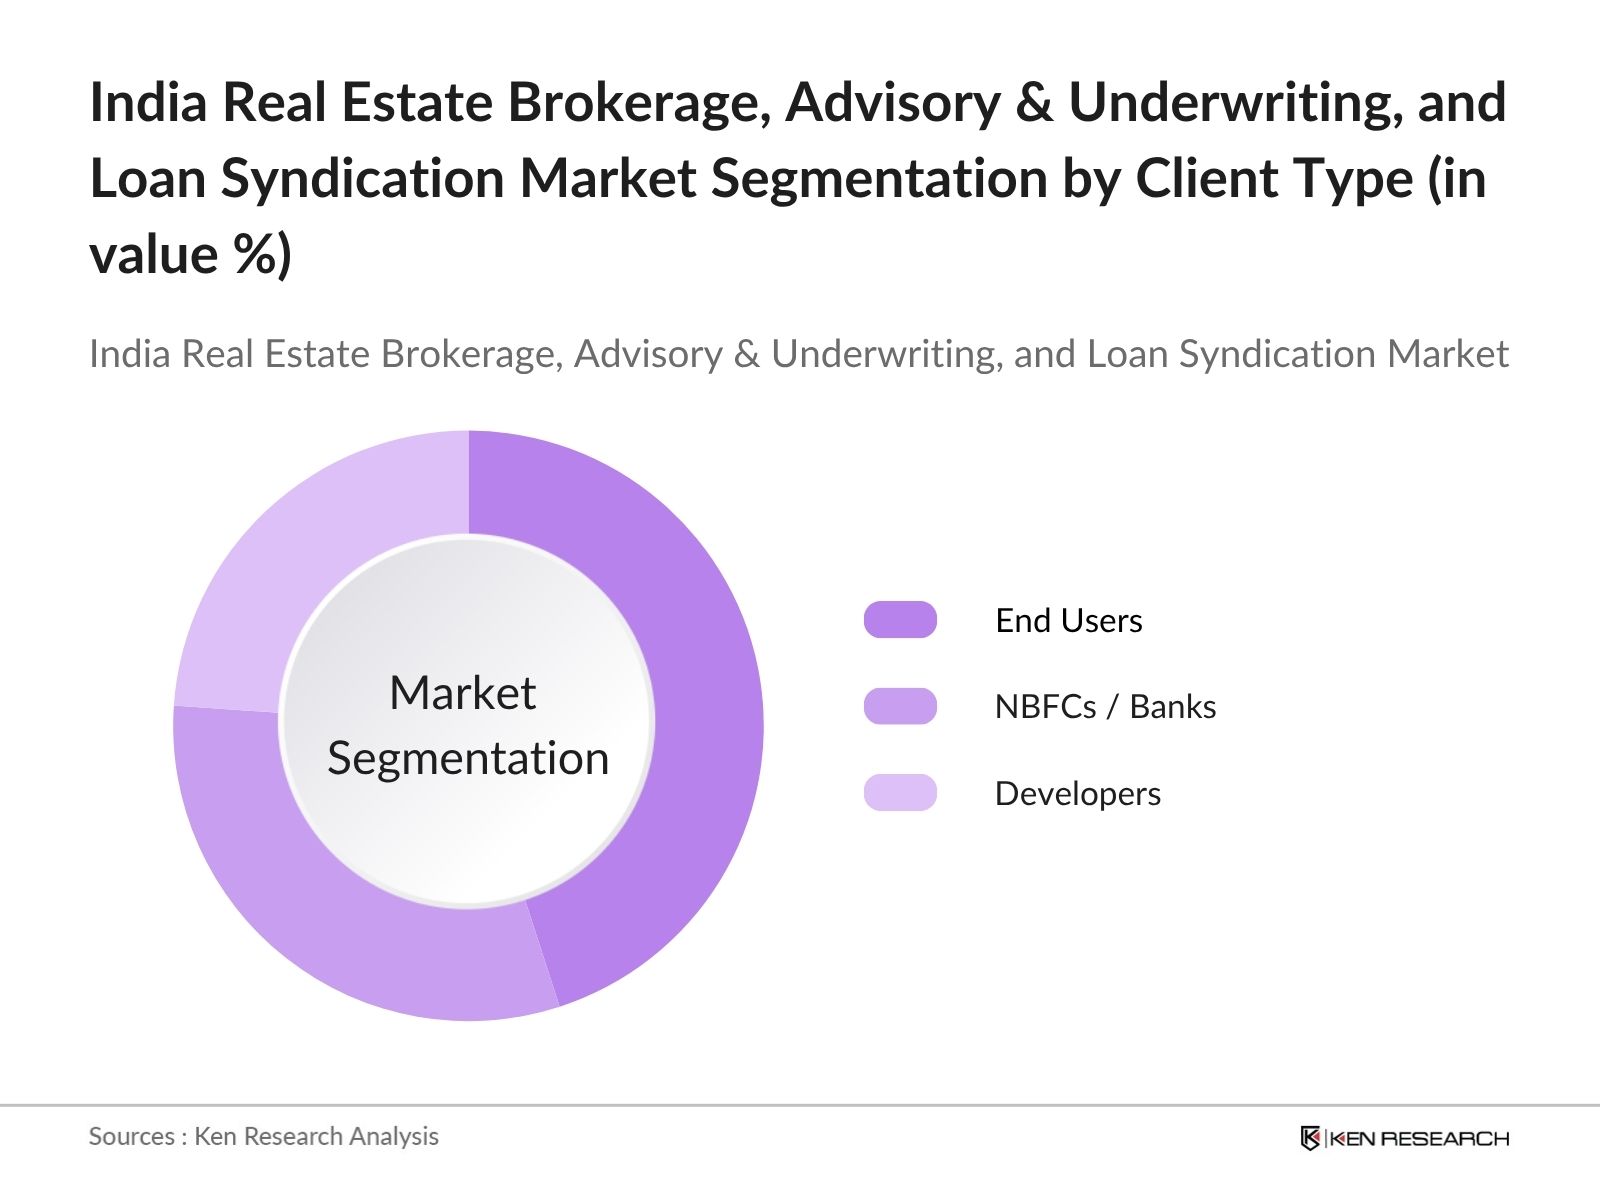
Property brokerage remains the dominant fee pool because it covers residential, office, industrial and investment transactions. Advisory and loan syndication generate higher fees per mandate, but brokerage benefits from a much larger transaction universe. Institutional firms increasingly bundle valuation, due diligence and capital-market services to protect client relationships.
Revenue Model
Hybrid fee structures are expected to grow fastest as advisers seek downside protection through retainers while preserving performance upside through success fees. Institutional clients accept this model for complex, multi-stage assignments requiring sustained analytical and execution resources. Fixed commissions remain exposed to digital comparison and price competition.
CHAPTER 7 - Regional Analysis
Regional Analysis
India is the largest South Asian market for professional real estate brokerage and capital advisory, supported by deeper institutional investment, larger office markets and more developed REIT infrastructure. Pakistan, Bangladesh, Sri Lanka and Nepal remain relevant neighboring benchmarks but have smaller institutional transaction pools.
Peer-Country Ranking
1st
India Market Size (2025)
USD 4,000 Mn
India CAGR (2025-2032)
9.60%
Peer-Country Ranking
1st
India Market Size (2025)
USD 4,000 Mn
India CAGR (2025-2032)
9.60%
Regional Analysis (Current Year)
Market Position
India ranks first among selected South Asian peers, with its scale reinforced by USD 8.5 billion of institutional real estate investment in 2025.
Growth Advantage
India's 9.60% forecast CAGR exceeds modeled growth of 8.1% in Bangladesh and 7.2% in Pakistan, reflecting deeper capital markets and transaction formalization.
Competitive Strengths
Six registered REITs, more than 112,000 registered agents and multi-city institutional leasing provide India with a broader advisory ecosystem than neighboring markets.
CHAPTER 8 - INDUSTRY ANALYSIS
Growth Drivers, Challenges & Opportunities
Comprehensive analysis of key factors shaping the India Real Estate Brokerage, Advisory, Underwriting & Loan Syndication Market, including growth catalysts, operational challenges and emerging opportunities across property transactions and capital services.
Growth Drivers
Institutional Capital Broadens Advisory Mandates
- Annual inflows increased 29% (2025, India), supporting higher deal velocity and success-fee realization for capital-market teams.
- Fourth-quarter investment reached USD 4.2 billion (Q4 2025, India), demonstrating a concentrated execution pipeline for advisers.
- Domestic capital supplied about 75% of investment (Q1 2026, India), reducing dependence on cross-border decision cycles.
Office Leasing Sustains Brokerage Volumes
- Quarterly leasing grew 15% year over year (Q1 2026, India), raising conversion opportunities for multi-city brokerage platforms.
- Bengaluru and Hyderabad contributed approximately 52% of demand (Q2 2026, India), favoring advisers with deep local execution teams.
- GCCs leased about 118 million sq ft during 2021-H1 2026 (India), enabling recurring occupier-advisory relationships.
Regulatory Formalization Rewards Scaled Platforms
- RERA registration applies to projects exceeding 500 square metres or eight units (current framework, India), expanding the regulated project universe.
- Agent registration is mandatory for registered projects, raising compliance requirements and favoring professionally governed operators.
- India had 159,830 registered projects (2026, India), creating a large documented transaction base for formal brokerage.
Market Challenges
Fragmentation Compresses Brokerage Fees
- The large agent base increases customer acquisition expense and weakens pricing power for firms without exclusive mandates or proprietary inventory.
- Digital comparison makes residential commissions more visible, shifting value toward documentation, negotiation and financing assistance rather than introductions alone.
- Regional licensing and operating practices remain uneven, requiring scaled firms to maintain state-specific compliance and partner networks.
Credit Cycles Create Syndication Volatility
- Independent collateral valuation is required for real estate exposure, increasing diligence time and reducing execution certainty for weak projects.
- RBI's 2025 AIF directions introduced exposure and provisioning controls for regulated entities, affecting lender participation in fund structures.
- Higher-risk projects require layered debt and equity, increasing mandate duration and the probability that advisers incur costs before closing.
Data Quality Limits Underwriting Efficiency
- State-level land records, registration systems and RERA portals require separate diligence workflows, raising transaction costs.
- Private-company financial disclosure is uneven, increasing reliance on project-level escrow data, collateral valuation and promoter guarantees.
- Comparable transaction data is strongest in major cities, constraining reliable valuation and underwriting in emerging urban corridors.
Market Opportunities
Integrated Debt and Equity Advisory
- Advisers can monetize retainers, placement fees and completion-linked fees across one capital mandate, improving revenue per client.
- Developers, private-credit funds, AIFs and lenders benefit from advisers capable of matching risk appetite with project cash flows.
- Standardized data rooms and lender-comparison tools must become core infrastructure for scalable syndication.
REIT and Asset Monetization Pipeline
- Advisers can earn from portfolio aggregation, pre-REIT restructuring, valuation, placement and post-listing asset transactions.
- Owners of stabilized office, retail and logistics assets benefit from access to institutional exit channels and professional price discovery.
- More sponsor-ready portfolios and consistent governance standards are required to convert private assets into investable platforms.
Technology-Assisted Mid-Market Advisory
- Hybrid platforms can monetize subscriptions, qualified leads, transaction support and financing referrals while retaining human execution.
- Regional brokers gain access to institutional-grade CRM, documentation and lender networks without building full advisory infrastructure.
- Interoperable property records, digital signatures and standardized compliance workflows are necessary for scaled adoption.
CHAPTER 9 - Competitive Landscape
Competitive Landscape Overview
Competition is fragmented in residential brokerage but concentrated among global and large domestic firms in institutional leasing, investment advisory, valuation and capital markets.
Market Share Distribution
Top 5 Players
Market Dynamics
8 new entrants in the past 5 years, indicating strong market attractiveness and growth potential.
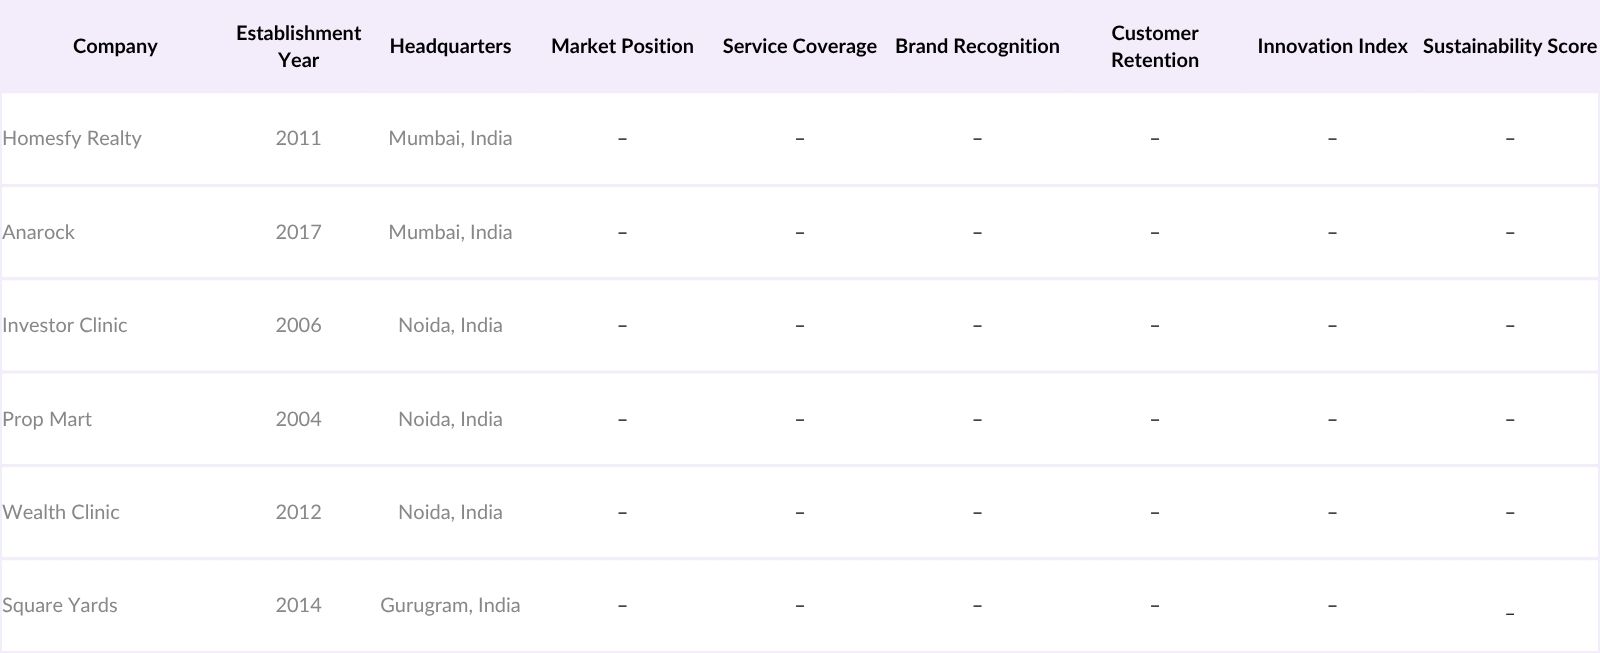
Company Name | Market Share | Headquarters | Founding Year | Core Market Focus |
|---|---|---|---|---|
CBRE India | - | Gurugram, India | - | Brokerage, occupier advisory, valuation and capital markets |
JLL India | - | Mumbai, India | - | Investment advisory, leasing and debt advisory |
Cushman & Wakefield India | - | Gurugram, India | - | Leasing, capital markets and valuation |
Colliers India | - | Mumbai, India | - | Investment services, occupier advisory and consulting |
Knight Frank India | - | Mumbai, India | - | Brokerage, research, valuation and capital advisory |
Anarock Property Consultants | - | Mumbai, India | 2017 | Residential brokerage, land and capital markets |
360 ONE Asset | - | Mumbai, India | - | Real estate capital and structured finance advisory |
Investec India | - | Mumbai, India | - | Real estate debt and capital solutions |
Property Share | - | Bengaluru, India | 2015 | Commercial property investment and transaction services |
Square Yards | - | Gurugram, India | 2014 | Digital brokerage, mortgages and transaction services |
Cross Comparison Parameters
The report provides detailed cross-comparison of key players across 10 performance parameters to identify competitive strengths and weaknesses.
Analysis Covered
Market Share Analysis:
Compares sector revenue and transaction positions across major service providers.
Cross Comparison Matrix:
Benchmarks execution scale, mandate conversion, growth and profitability performance.
SWOT Analysis:
Assesses client access, capabilities, geographic reach and execution risks.
Pricing Strategy Analysis:
Compares commissions, retainers, success fees and hybrid pricing structures.
Company Profiles:
Reviews service portfolios, positioning, operating coverage and strategic priorities.
CHAPTER 10 - REPORT TOC
Market Report Structure
Comprehensive coverage across three strategic phases: Market Assessment, Go-To-Market Strategy and Survey, delivering end-to-end insights from market analysis and execution roadmap to customer demand validation.
Market Assessment Phase
Supply-side and competitive intelligence covering market sizing, segmentation, competitive dynamics, regulatory landscape and future forecasts.
Go-To-Market Strategy Phase
15 chapters
Entry strategy evaluation, execution roadmap, partner recommendations and profitability outlook.
Survey Phase
8 chapters
Demand-side primary research conducted through structured interviews and online surveys with end users across priority metros and Tier 2/3 cities to capture service requirements, unmet needs and purchase drivers.
Complete Report Coverage
201+ detailed sections covering every aspect of the market
143
Assessment Sections
58
Strategy Sections
CHAPTER 11 - Our Approach
Research Methodology
Desk Research
- RERA project and agent registrations
- Institutional property investment transaction review
- Office leasing and absorption analysis
- REIT and AIF regulatory assessment
Primary Research
- Capital markets directors interviewed
- Corporate real estate heads interviewed
- Developer finance directors interviewed
- Credit-underwriting executives interviewed
Validation and Triangulation
- 356 respondents across four cohorts
- Fee benchmarks cross-checked by service
- Transaction volumes reconciled by asset
- Forecast arithmetic independently verified
CHAPTER 12 - FAQ
FAQs
Still have questions?
Our research team is here to help you find the right solution
CHAPTER 13 - Related Research
Explore Related Reports
Expand your market intelligence with complementary research across regions and adjacent markets.
Regional/Country ReportsRelated market analysis across key regions
Related market analysis across key regions
- Indonesia Real Estate Brokerage, Advisory, Underwriting & Loan Syndication Market
- Vietnam Real Estate Brokerage, Advisory, Underwriting & Loan Syndication Market
- Thailand Real Estate Brokerage, Advisory, Underwriting & Loan Syndication Market
- Malaysia Real Estate Brokerage, Advisory, Underwriting & Loan Syndication Market
- Philippines Real Estate Brokerage, Advisory, Underwriting & Loan Syndication Market
Adjacent ReportsRelated markets and complementary research
Related markets and complementary research
- Brazil Real Estate Investment Trusts Market
- Indonesia Commercial Property Management Market
- Indonesia Property Technology Solutions Market
- Thailand Mortgage Brokerage Services Market
- UAE Financial Advisory Services Market
500+
Market Research Reports
50+
Countries Covered
15+
Industry Verticals