















India Rooftop Solar Market Outlook to 2030
Region:Asia
Author(s):Sanjna
Product Code:KROD780
July 2024
100
About the Report
India Rooftop Solar Market Overview
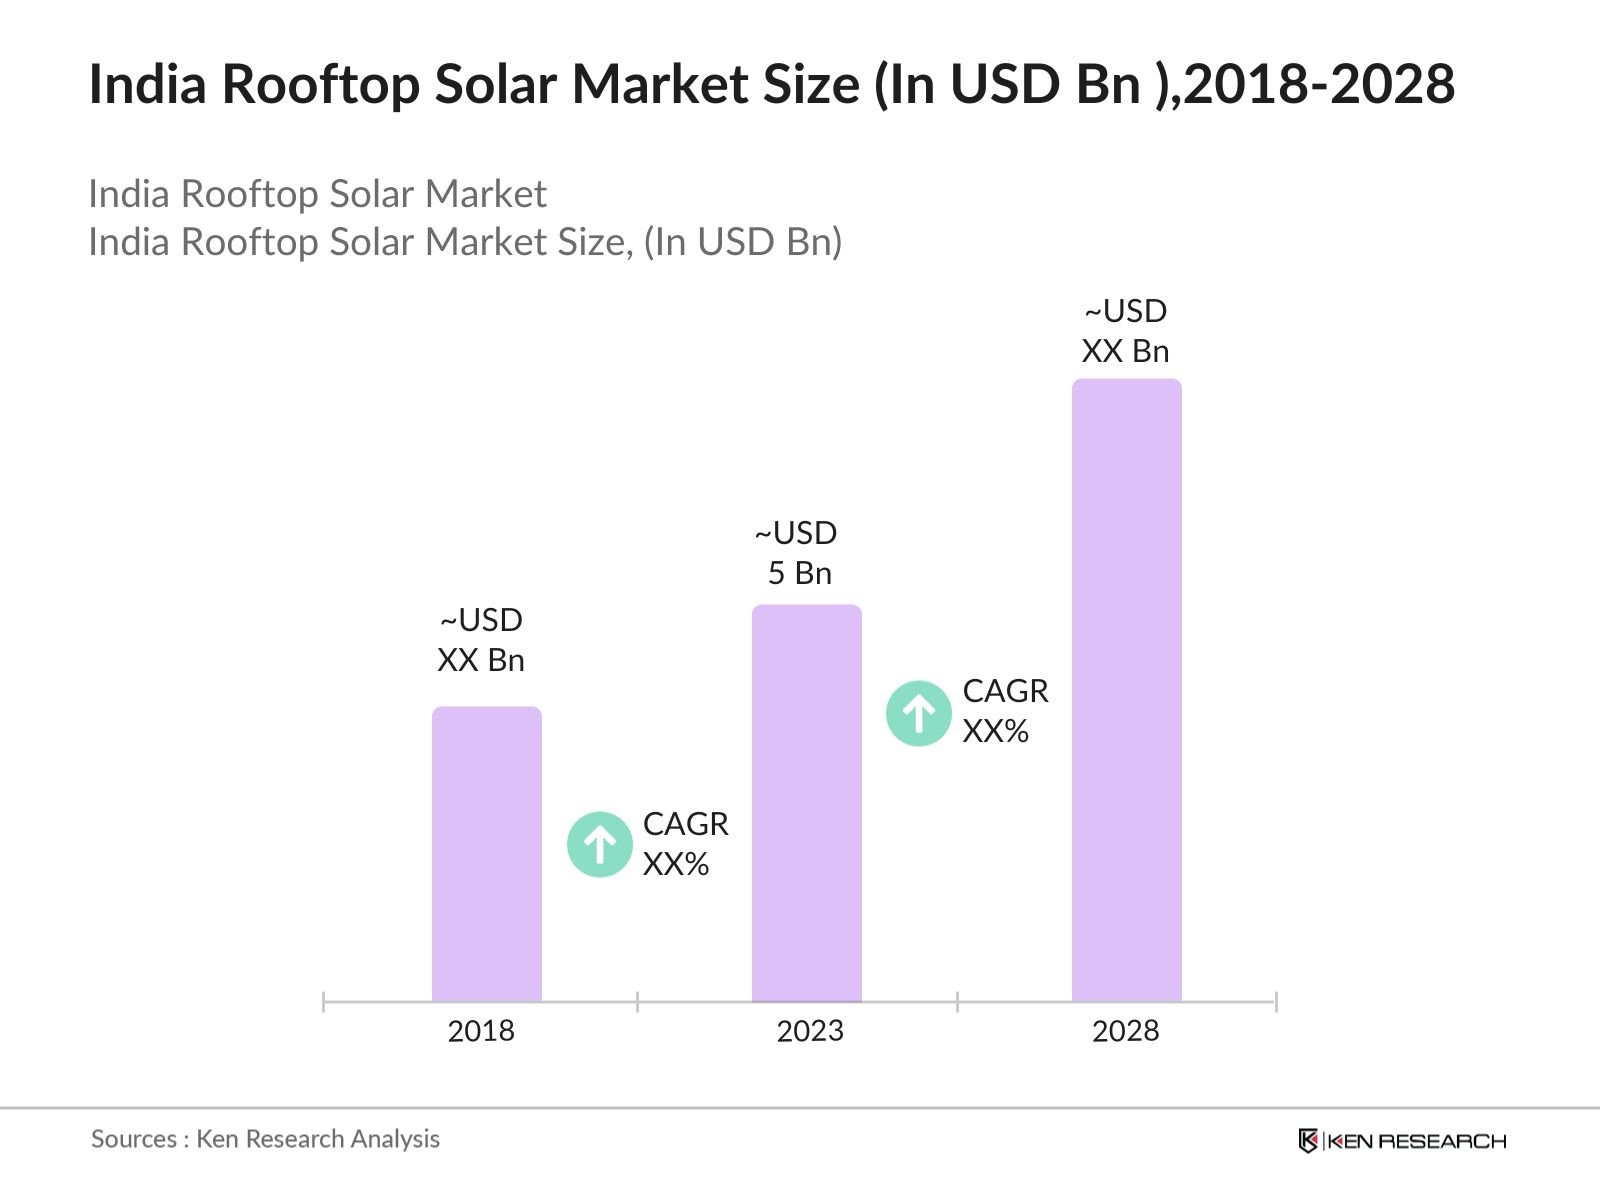
- India rooftop solar market was valued at USD 5 Bn in 2023. This impressive growth is primarily driven by decreasing solar panel costs, increasing electricity tariffs, and favorable government policies. The adoption of rooftop solar systems is further accelerated by the rising environmental consciousness among consumers and businesses.
- Prominent players in the India rooftop solar market include Tata Power Solar Systems Ltd., Vikram Solar Limited, Adani Solar, Waaree Energies Ltd., and ReNew Power. These companies have established a strong foothold in the market through extensive project portfolios and significant investments in technology and capacity expansion.
- In March 2023, Tata Power Solar Systems Ltd. announced the commissioning of a 70 MW rooftop solar project for a leading industrial client in Gujarat. This project, touted as one of the largest industrial rooftop installations in India, showcases the growing trend of large-scale rooftop solar adoption in the commercial and industrial sectors.
India Rooftop Solar Current Market Analysis
- Solar energy provides a reliable and independent power source, reducing dependence on the grid and fossil fuels, which is particularly crucial in remote and rural areas.
- The rooftop solar market in India has led to increased energy security, job creation, and significant environmental benefits by reducing carbon emissions. It has also driven technological innovations in energy storage and smart grid systems.
- Growing awareness of environmental sustainability and corporate social responsibility (CSR) initiatives have driven the adoption of rooftop solar systems in India. Companies are increasingly focusing on reducing their carbon footprint and promoting sustainable practices.
- Maharashtra is a leading region in the rooftop solar market, contributing approximately 20% of the total installed capacity in India as of 2023. The state's favorable policies, high solar potential, and strong industrial base make it a key player in the market.
India Rooftop Solar Market Segmentation
By Type: By type, the India rooftop solar market is segmented into monon-crystalline, polycrystalline and thinfilm. In 2023, monocrystalline segment has been dominating the market. Higher efficiency and performance in limited space make it the preferred choice for residential and commercial installations.

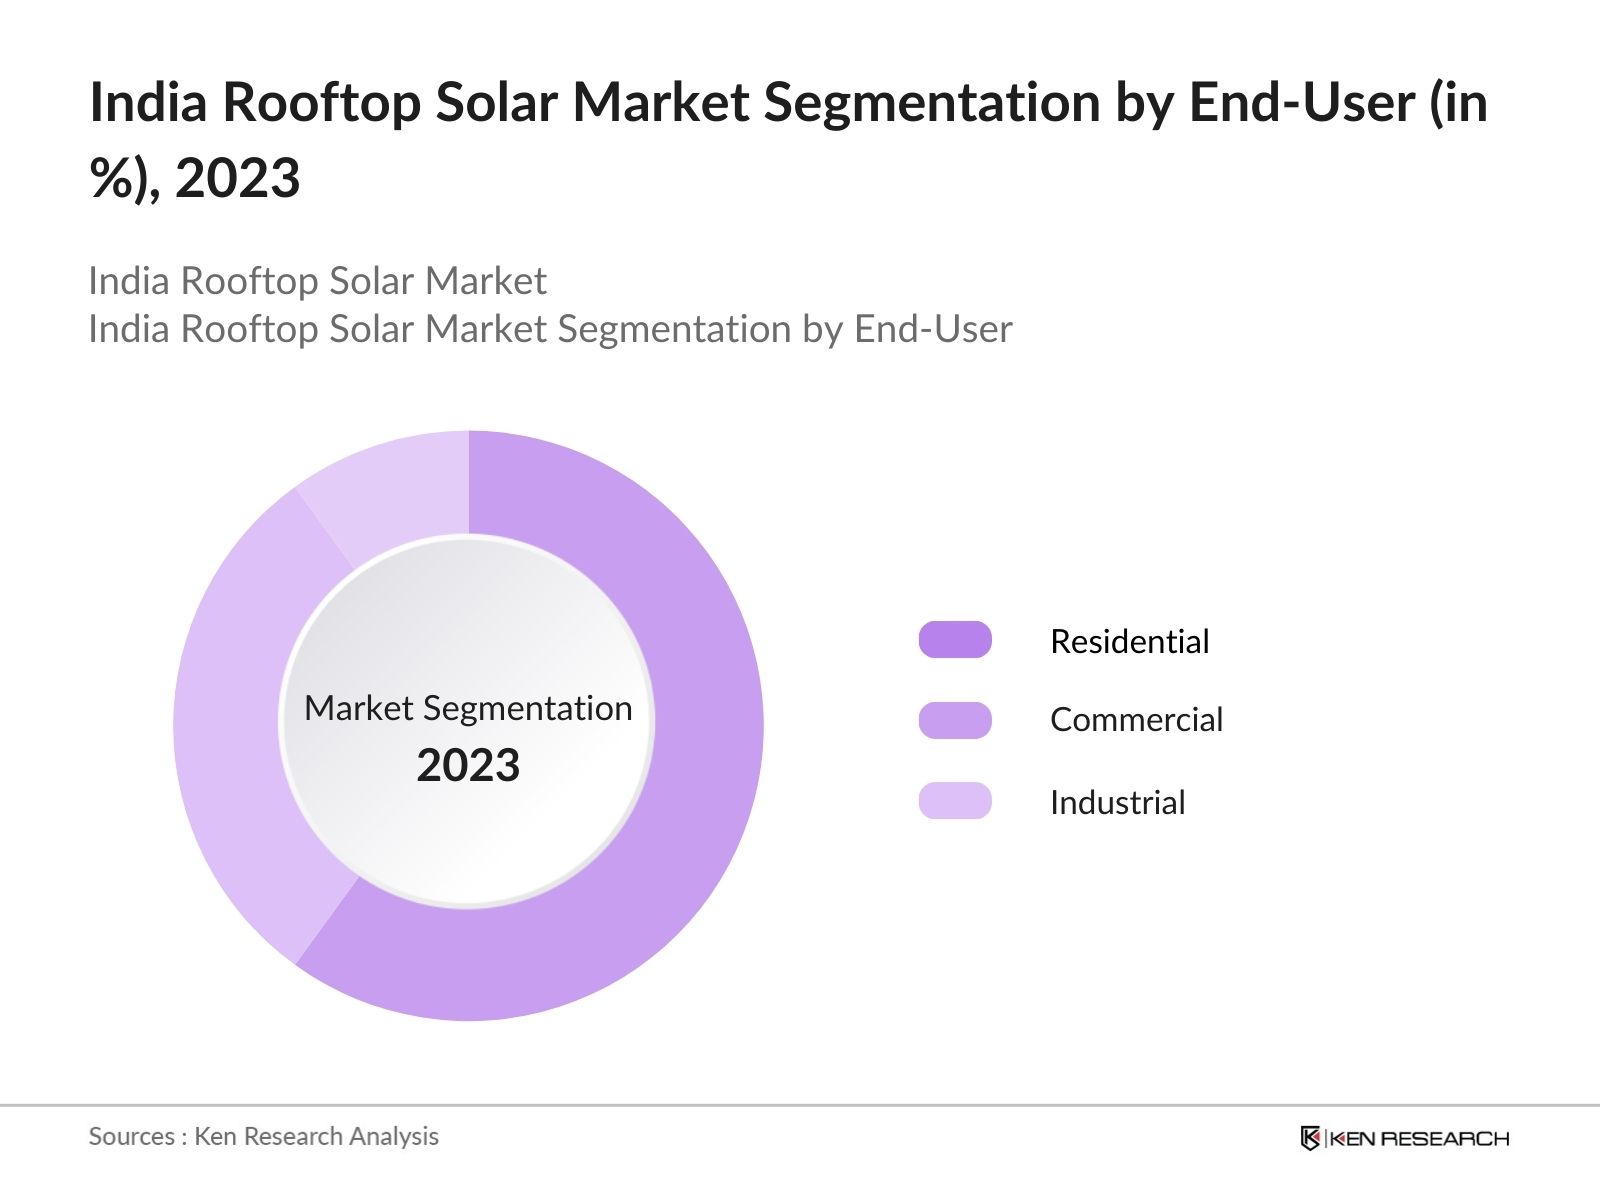
By End-User: By end-user, the market is segmented into residential, commercial & industrial. In 2023, Residential segment was dominating this market. Higher efficiency and performance in limited space make it the preferred choice for residential and commercial installations. Homeowners are becoming more aware of the environmental benefits of renewable energy and are choosing solar as a way to reduce their carbon footprint.
By Capacity: The market is segmented into <10 kW, 10-100 kW and >100 kW. In 2023, the <10 kW segment dominated the market, driven by its widespread use in residential and small commercial establishments. This capacity is highly suitable for meeting household energy needs, leading to significant demand. The growing focus on sustainable and cost-effective energy solutions in homes has further propelled this segment's popularity.
India Rooftop Solar Market Competitive Landscape
|
Company |
Establishment Year |
Headquarters |
|
Tata Power Solar |
1989 |
Mumbai |
|
Vikram Solar Limited |
2006 |
Kolkata |
|
Adani Solar |
2015 |
Ahmedabad |
|
Waaree Energies Ltd. |
1989 |
Mumbai |
|
ReNew Power |
2011 |
Gurugram |
- Major players in this market include Tata Power Solar, Vikram Solar Power, Adani Solar, Waaree Energies, ReNew Power among others.
- These major players are driving market growth by expanding their installation capacities, investing in R&D, and forming strategic alliances. Their efforts are leading to increased adoption of rooftop solar systems across various sectors.
- In January 2023, Vikram Solar announced a strategic partnership with a leading European energy firm to develop 500 MW of rooftop solar projects across India by 2025. This collaboration aims to leverage Vikram Solar's manufacturing capabilities and the European firm's technological expertise.
India Rooftop Solar Industry Analysis
India Rooftop Solar Growth Drivers
- Decreasing Solar Panel Costs: The cost of solar panels has decreased significantly, making rooftop solar installations more affordable. At the beginning of the 21st century, it cost over $15/W to install rooftop solar systems, with solar modules costing over $10/W. However, the global utility-scale solar system price was $0.87/W in 2020, a 70% decline from 2010. As a result, the levelized cost of electricity (LCOE) for solar power has become competitive with traditional energy sources, encouraging widespread adoption of rooftop solar systems in India.
- Government Subsidies and Incentives: Government subsidies and financial incentives have played a crucial role in driving the growth of the rooftop solar market in India. The Rooftop Solar Program Phase II, launched by the MNRE in 2019, provides central financial assistance for residential rooftop solar installations. Additionally, state governments offer various incentives, such as net metering policies and capital subsidies, which further reduce the financial burden on consumers and promote the adoption of rooftop solar systems.
- Rising Electricity Tariffs: Increasing electricity tariffs in India have prompted consumers to seek alternative and cost-effective energy sources. Maharashtra has the highest domestic power tariffs in India of Rs. 8.80 per unit. This trend has made rooftop solar an attractive option for both residential and commercial consumers, as it provides long-term savings on electricity bills and protects against future tariff hikes.
India Rooftop Solar Market Challenges
- High Initial Investment Costs: Despite the reduction in solar PV costs, the initial investment required for rooftop solar installations remains high for many consumers. The average cost of installing a residential rooftop solar system in India ranges from INR 60,000 to INR 80,000 per kW, which can be a significant expenditure for individual households.
- Regulatory and Policy Barriers: The rooftop solar market in India faces regulatory challenges due to the lack of a standardized framework across states. Each state has its own policies, net metering regulations, and approval processes, leading to inconsistencies and delays in project implementation.
- Grid Connectivity Issues: Inadequate grid infrastructure and connectivity issues, particularly in remote and rural areas, present significant challenges for the rooftop solar market. Many rural regions still experience frequent power outages and lack reliable grid connectivity. These issues make it difficult to integrate rooftop solar systems with the existing grid, limiting the market's reach and effectiveness in these areas.
India Rooftop Solar Government Initiatives
- Rooftop Solar Program Phase II: The Rooftop Solar Programme Phase-II, launched by the Ministry of New and Renewable Energy (MNRE), aims to achieve a cumulative installed capacity of 40,000 MW from Grid Connected Rooftop Solar (RTS) projects by 2026. The program provides Central Financial Assistance (CFA) to residential electricity consumers and incentives to DISCOMs to drive rapid deployment of rooftop solar
- KUSUM Scheme (2019): The Kisan Urja Suraksha evam Utthaan Mahabhiyan (KUSUM) scheme is a significant initiative by the Government of India to promote the use of solar energy in rural areas. Launched by the Ministry of New and Renewable Energy (MNRE), the scheme focuses on the installation of solar pumps and grid-connected solar power plants, with a particular emphasis on supporting the agricultural sector.
- Smart Cities Mission (2015): The Smart Cities Mission encourages the use of rooftop solar in urban development projects. Under this initiative, 100 smart cities are being developed with a focus on sustainable energy solutions, including rooftop solar installations. This initiative is driving the adoption of solar energy in urban areas, contributing to the market's growth.
India Rooftop Solar Future Market Outlook
India rooftop solar market is expected to grow at a robust pace. This growth will be driven by continued cost reductions, technological advancements, and strong government support. The increasing emphasis on sustainable energy solutions and the rising cost of conventional electricity will further propel market growth.
Future Market Trends:
-
- Integration of Energy Storage Solutions: The integration of energy storage solutions with rooftop solar installations is becoming increasingly prevalent. Advanced battery technologies, such as lithium-ion batteries, are being used to store excess solar energy generated during the day for use at night or during power outages. This trend will enhance the reliability and efficiency of rooftop solar systems.
- Adoption of Smart Grid Technologies: Smart grid technologies are being adopted to enhance the management and distribution of solar energy. These technologies include advanced metering infrastructure (AMI), grid automation, and real-time data analytics. This trend will drive the modernization of the electricity grid and facilitating the seamless integration of distributed solar power.
- Corporate Sustainability Initiatives: Increasingly, corporations in India are adopting rooftop solar installations as part of their sustainability initiatives and carbon reduction goals. Companies such as Infosys and Tata Consultancy Services have installed rooftop solar systems on their campuses to reduce their carbon footprint.
Scope of the Report
|
By Type |
Monon-crystalline Polycrystalline Thinfilm  |
|
By End-User |
Residential Commercial Industrial |
|
By Capacity |
<10 kW 10-100 kW >100 kW Â |
Products
Key Target Audience – Organizations and Entities who can benefit by Subscribing This Report:
Solar Panel Manufacturers and Suppliers
Solar Installation Companies
Commercial and Industrial (C&I) Businesses
Banks & Financial Institutions
Industrial Plant Managers
Environmental Organizations
Micro, Small and Medium Enterprises (MSMEs)
Government & Regulatory Bodies (Ministry of New & Renewable Energy, Solar Energy Corporation of India etc.)
Time Period Captured in the Report:
Historical Period: 2018-2023
Base Year: 2023
Forecast Period: 2023-2028
Companies
Players Mentioned in the Report:Â
Tata Power Solar
Adani Solar
Vikram Solar
Waaree Energies
Azure Power
Amplus Solar
RenewSys
Jakson Group
Goldi Solar
Sterling and Wilson Solar
Luminous Power Technologies
Loom Solar
Moser Baer Solar
Navitas Solar
Ujaas Energy
HHV Solar Technologies
GreenBrilliance
Sova Solar
Emmvee Solar
Microtek International
Table of Contents
1. India Rooftop Solar Market Overview
1.1 India Rooftop Solar Market Taxonomy
2. India Rooftop Solar Market Size (in USD Bn), 2018-2023
3. India Rooftop Solar Market Analysis
3.1 India Rooftop Solar Market Growth Drivers
3.2 India Rooftop Solar Market Challenges and Issues
3.3 India Rooftop Solar Market Trends and Development
3.4 India Rooftop Solar Market Government Regulation
3.5 India Rooftop Solar Market SWOT Analysis
3.6 India Rooftop Solar Market Stake Ecosystem
3.7 India Rooftop Solar Market Competition Ecosystem
4. India Rooftop Solar Market Segmentation, 2023
4.1 India Rooftop Solar Market Segmentation by Type, By Value (In %), 2023
4.2 India Rooftop Solar Market Segmentation by End-User, By Value (In %), 2023
4.3 India Rooftop Solar Market Segmentation by Capacity, By Value (In %), 2023
5. India Rooftop Solar Market Competition Benchmarking
5.1 India Rooftop Solar Market Cross-Comparison (no. of employees, company overview, business strategy, USP, recent development, operational parameters, financial parameters and advanced analytics)
6. India Rooftop Solar Future Market Size (in USD Bn), 2023-2028
7. India Rooftop Solar Future Market Segmentation, 2028
7.1 India Rooftop Solar Market Segmentation by Type, By Value, (In %), 2028
7.2 India Rooftop Solar Market Segmentation by End-User, By Value (In %), 2028
7.3 India Rooftop Solar Market Segmentation by Capacity, By Value (In %), 2028
8. India Rooftop Solar Market Analysts’ Recommendations
8.1 India Rooftop Solar Market TAM/SAM/SOM Analysis
8.2 India Rooftop Solar Market Customer Cohort Analysis
8.3 India Rooftop Solar Market Marketing Initiatives
8.4 India Rooftop Solar Market White Space Opportunity Analysis
Research Methodology
Step: 1 Identifying Key Variables:
Ecosystem creation for all the major entities and referring to multiple secondary and proprietary databases to perform desk research around market to collate industry level information.Â
Step: 2 Market Building:
Collating statistics on India rooftop solar market over the years, penetration of marketplaces and service providers ratio to compute revenue generated for India rooftop solar market. We will also review service quality statistics to understand revenue generated which can ensure accuracy behind the data points shared.Â
Step: 3 Validating and Finalizing:
Building market hypothesis and conducting CATIs with industry experts belonging to different companies to validate statistics and seek operational and financial information from company representatives.Â
Step: 4 Research Output:
Our team will approach multiple rooftop solar companies and understand nature of product segments and sales, consumer preference and other parameters, which will support us validate statistics derived through bottom to top approach from rooftop solar companies.Â
Frequently Asked Questions
01 How big is India Rooftop Solar market?
The India Rooftop Solar market size was USD 5 billion in 2023, driven by decreasing solar panel costs, increasing electricity tariffs, and favorable government policies.
02 Who are the major players in India Rooftop Solar market?
Major players include Tata Power Solar, Adani Solar, Vikram Solar, Waaree Energies, and Azure Power.
03 What segment is currently dominating India Rooftop Solar market?
The residential segment is the dominant segment due to rising electricity costs and government subsidies.
04 What factors drive India Rooftop Solar Market?
Major growth drivers include government incentives, declining costs, increasing demand for energy security, and environmental concerns.
Why Buy From Us?

What makes us stand out is that our consultants follows Robust, Refine and Result (RRR) methodology. i.e. Robust for clear definitions, approaches and sanity checking, Refine for differentiating respondents facts and opinions and Result for presenting data with story

We have set a benchmark in the industry by offering our clients with syndicated and customized market research reports featuring coverage of entire market as well as meticulous research and analyst insights.

While we don't replace traditional research, we flip the method upside down. Our dual approach of Top Bottom & Bottom Top ensures quality deliverable by not just verifying company fundamentals but also looking at the sector and macroeconomic factors.

With one step in the future, our research team constantly tries to show you the bigger picture. We help with some of the tough questions you may encounter along the way: How is the industry positioned? Best marketing channel? KPI's of competitors? By aligning every element, we help maximize success.

Our report gives you instant access to the answers and sources that other companies might choose to hide. We elaborate each steps of research methodology we have used and showcase you the sample size to earn your trust.

If you need any support, we are here! We pride ourselves on universe strength, data quality, and quick, friendly, and professional service.