
India Sports Analytics Market Outlook to 2030
Region:Asia
Author(s):Naman Rohilla
Product Code:KROD3085
Region:Asia
Author(s):Naman Rohilla
Product Code:KROD3085
November 2024
92
The India Sports Analytics Market is segmented by Application, Deployment Mode, Sport Type, Component, End-User, and geographical region.
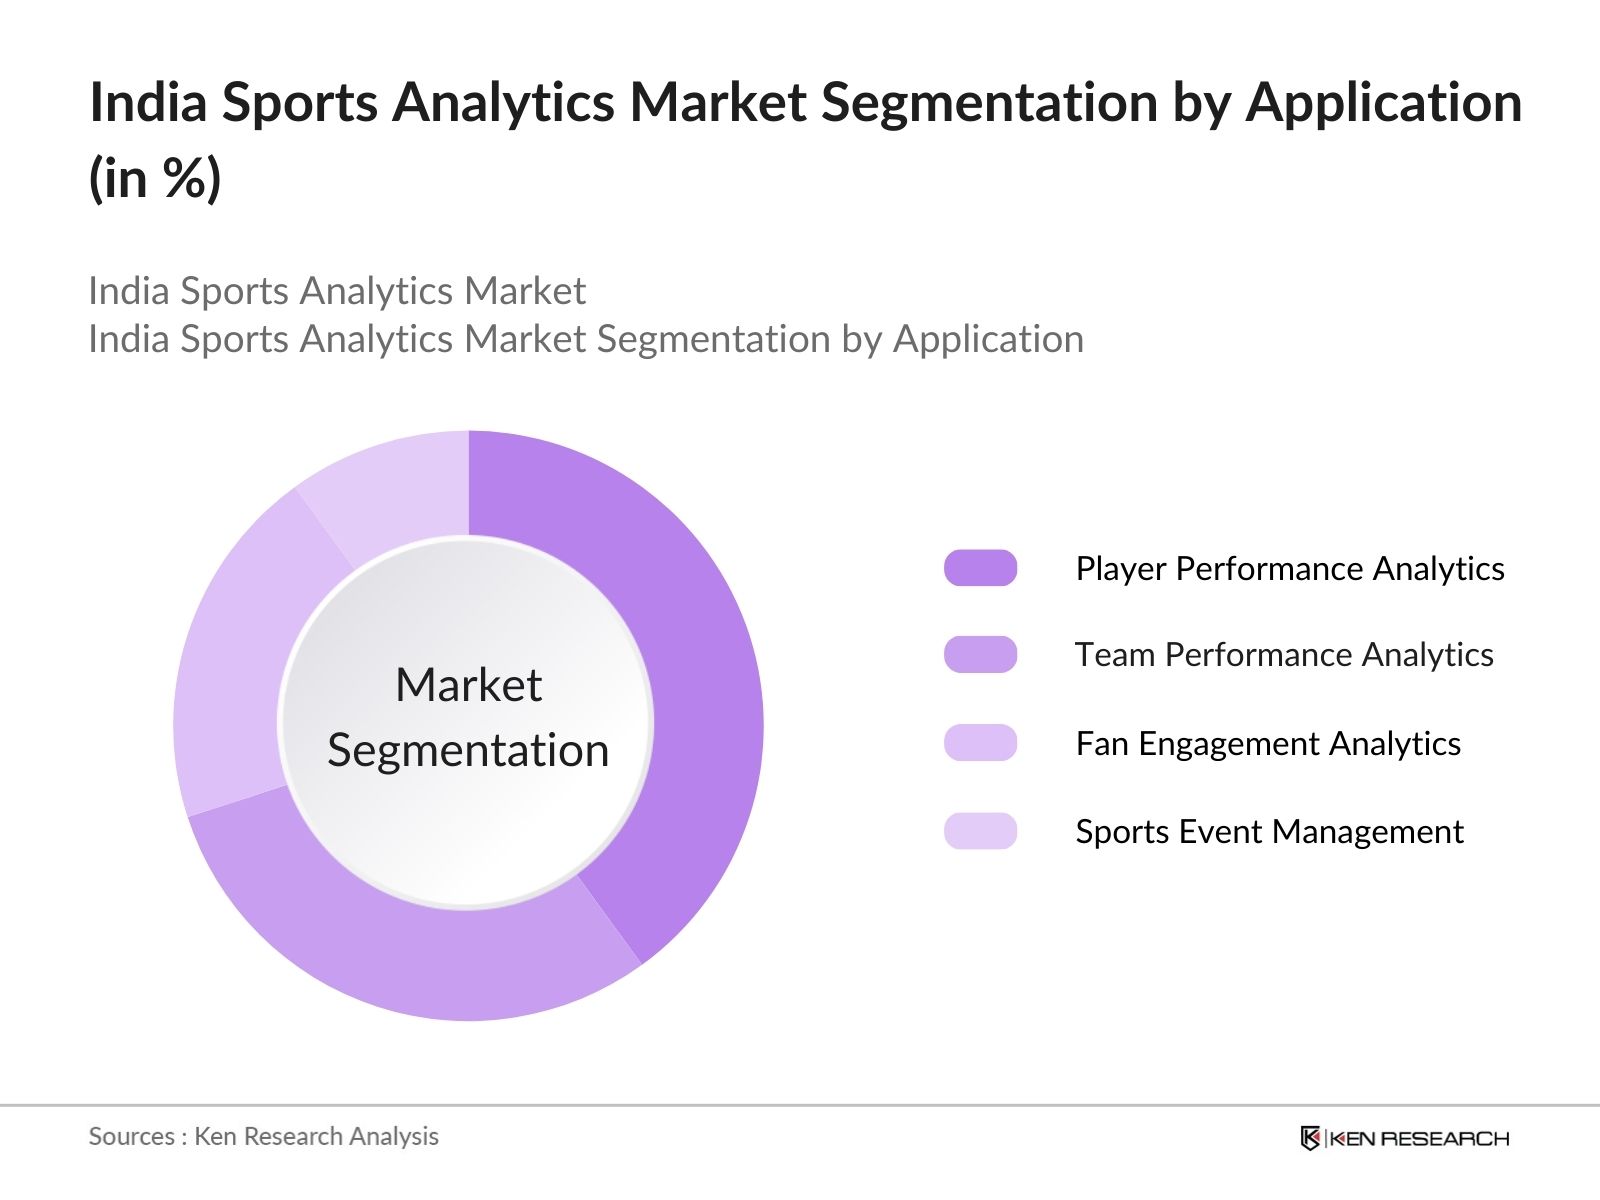
By Application: India Sports Analytics market is segmented by application into Player Performance Analytics, Team Performance Analytics, Fan Engagement Analytics, and Sports Event Management. Player performance analytics dominates this segmentation, largely due to the increasing demand for real-time analysis of athlete performance during games. Professional sports teams are investing heavily in wearable technology and machine learning tools that track vital statistics like speed, stamina, and accuracy. Such detailed analysis helps teams in making data-driven decisions that improve player efficiency and reduce injuries.
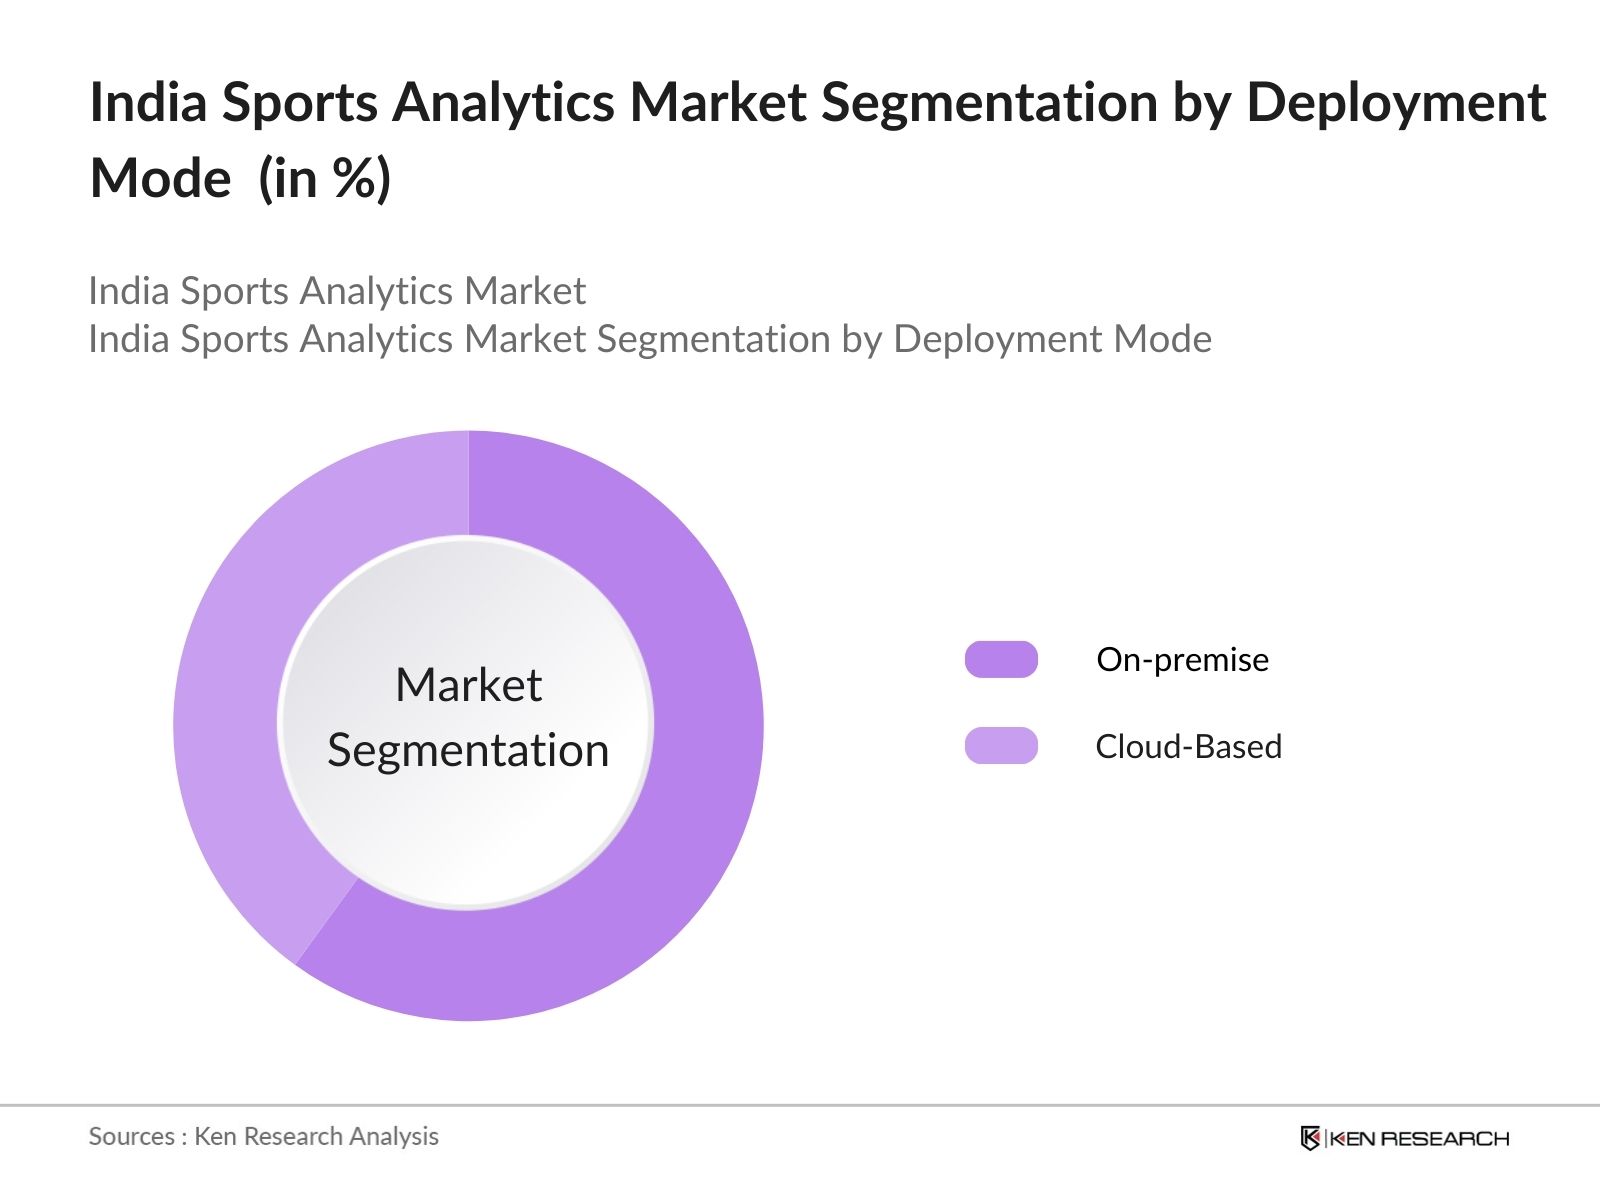
By Deployment Mode: The market is further segmented by deployment mode into On-premise and Cloud-Based solutions. On-premise solutions are leading in market share, primarily because sports organizations prefer to keep sensitive performance and strategy data within their control. While cloud solutions are gaining traction due to scalability and cost-efficiency, security concerns still favor on-premise systems, especially for elite sports teams and leagues that rely on proprietary data to maintain competitive advantages.
The India Sports Analytics market is characterized by the presence of both local players and global tech firms, creating a competitive landscape. Companies like Catapult Sports, SAP SE, and IBM dominate the market with their comprehensive analytics solutions tailored to sports teams. Other notable companies focus on niche applications, like fan engagement or athlete management systems, creating a diversified market. Collaborative efforts between technology companies and sports leagues are expected to further enhance the competitive dynamics.
|
Company Name |
Establishment Year |
Headquarters |
Products/Services Offered |
Focus Sports |
Key Partnerships |
Revenue (USD Bn) |
No. of Employees |
Technological Innovations |
|
Catapult Sports |
2006 |
Australia |
Performance Analysis Tools |
- |
- |
- |
- |
- |
|
SAP SE |
1972 |
Germany |
Sports Intelligence Solutions |
- |
- |
- |
- |
- |
|
IBM |
1911 |
USA |
Cloud & AI for Sports Analytics |
- |
- |
- |
- |
- |
|
Stats Perform |
1981 |
USA |
Player Tracking & Data Analytics |
- |
- |
- |
- |
- |
|
Sportradar |
2001 |
Switzerland |
Data Analytics & Integrity Services |
- |
- |
- |
- |
- |
Over the next five years, the India Sports Analytics market is expected to show growth driven by continuous investments in technology, the rise of fan engagement platforms, and the expansion of sports leagues. Advanced analytics tools will not only cater to elite athletes and teams but will also become more accessible to lower-tier leagues, academies, and grassroots levels, promoting widespread adoption across all levels of sports.
|
By Application |
Player Performance Analytics Team Performance Analytics Fan Engagement Analytics Sports Event Management |
|
By Deployment Mode |
On-premise Cloud-Based |
|
By Sport Type |
Cricket Football Hockey Badminton Tennis |
|
By Component |
Software Services |
|
By End-User |
Sports Teams & Clubs Leagues & Associations Sports Academies Media & Broadcasting |
|
By Region |
North South East West |
1.1. Definition and Scope
1.2. Market Taxonomy
1.3. Market Growth Rate
1.4. Market Segmentation Overview
2.1. Historical Market Size
2.2. Year-On-Year Growth Analysis
2.3. Key Market Developments and Milestones
3.1. Growth Drivers
3.1.1. Adoption of Real-time Data Analytics
3.1.2. Increased Investment in Sports Infrastructure
3.1.3. Digital Transformation in Sports Management
3.1.4. Rising Popularity of Sports Leagues
3.2. Market Challenges
3.2.1. Data Security and Privacy Concerns
3.2.2. High Cost of Advanced Analytical Tools
3.2.3. Lack of Skilled Data Professionals in Sports
3.3. Opportunities
3.3.1. Integration of AI and ML in Sports Analytics
3.3.2. Emerging Use of Wearable Technologies in Sports
3.3.3. Expansion of Esports and Fantasy Leagues
3.4. Trends
3.4.1. Use of Predictive Analytics for Player Performance
3.4.2. Increased Demand for Fan Engagement Analytics
3.4.3. Growing Use of Video Analytics for Scouting
3.5. Government Regulation
3.5.1. Policies on Data Collection in Sports
3.5.2. Regulations for Athlete Performance Tracking
3.5.3. Initiatives for Boosting Sports Infrastructure
3.6. SWOT Analysis
3.7. Stake Ecosystem
3.8. Porters Five Forces
3.9. Competition Ecosystem
4.1. By Application
4.1.1. Player Performance Analytics
4.1.2. Team Performance Analytics
4.1.3. Fan Engagement Analytics
4.1.4. Sports Event Management
4.2. By Deployment Mode
4.2.1. On-premise
4.2.2. Cloud-Based
4.3. By Sport Type
4.3.1. Cricket
4.3.2. Football
4.3.3. Hockey
4.3.4. Badminton
4.3.5. Tennis
4.4. By Component
4.4.1. Software
4.4.2. Services
4.5. By End-User
4.5.1. Sports Teams & Clubs
4.5.2. Leagues & Associations
4.5.3. Sports Academies
4.5.4. Media & Broadcasting
4.6. By Region
4.6.1. North India
4.6.2. South India
4.6.3. East India
4.6.4. West India
5.1 Detailed Profiles of Major Companies
5.1.1. Catapult Sports
5.1.2. Stats Perform
5.1.3. Hudl
5.1.4. Sportradar
5.1.5. SAP SE
5.1.6. IBM
5.1.7. Opta Sports
5.1.8. Tableau Software
5.1.9. Krossover Intelligence
5.1.10. Trumedia Networks
5.1.11. Beyond Sports
5.1.12. Sports Mechanics India Pvt. Ltd.
5.1.13. Global Sports Commerce
5.1.14. Edge10 Group
5.1.15. iSportsAnalysis
5.2 Cross Comparison Parameters (Revenue, Sports Served, Technology Stack, Regional Presence, Partnerships, Data Privacy Measures, R&D Investment, Customer Base)
5.3 Market Share Analysis
5.4 Strategic Initiatives
5.5 Mergers and Acquisitions
5.6 Investment Analysis
5.7 Venture Capital Funding
5.8 Government Grants
5.9 Private Equity Investments
6.1 Government Policies on Sports Development
6.2 Compliance Requirements for Data Usage in Sports
6.3 Certification Processes for Sports Analytics Firms
7.1 Future Market Size Projections
7.2 Key Factors Driving Future Market Growth
8.1 By Application
8.2 By Deployment Mode
8.3 By Sport Type
8.4 By Component
8.5 By End-User
9.1 TAM/SAM/SOM Analysis
9.2 Customer Cohort Analysis
9.3 Marketing Initiatives
9.4 White Space Opportunity Analysis
Disclaimer Contact UsThe first step involved identifying the critical factors shaping the India Sports Analytics Market. This was done through comprehensive desk research, which utilized secondary sources such as industry reports, databases, and white papers, as well as primary sources like expert interviews.
The analysis phase focused on historical data collection for the India Sports Analytics market. Through this, we assessed market penetration rates across various segments and identified the key growth drivers, challenges, and opportunities in the industry.
To ensure accuracy, industry experts were consulted. They provided insights into current trends, technological innovations, and expected developments within the industry. This step was instrumental in validating our market estimations and forecasts.
The final phase of the research involved synthesizing the data into actionable insights, ensuring that the findings reflected both quantitative data and qualitative insights. This process guaranteed the credibility and reliability of the market projections.
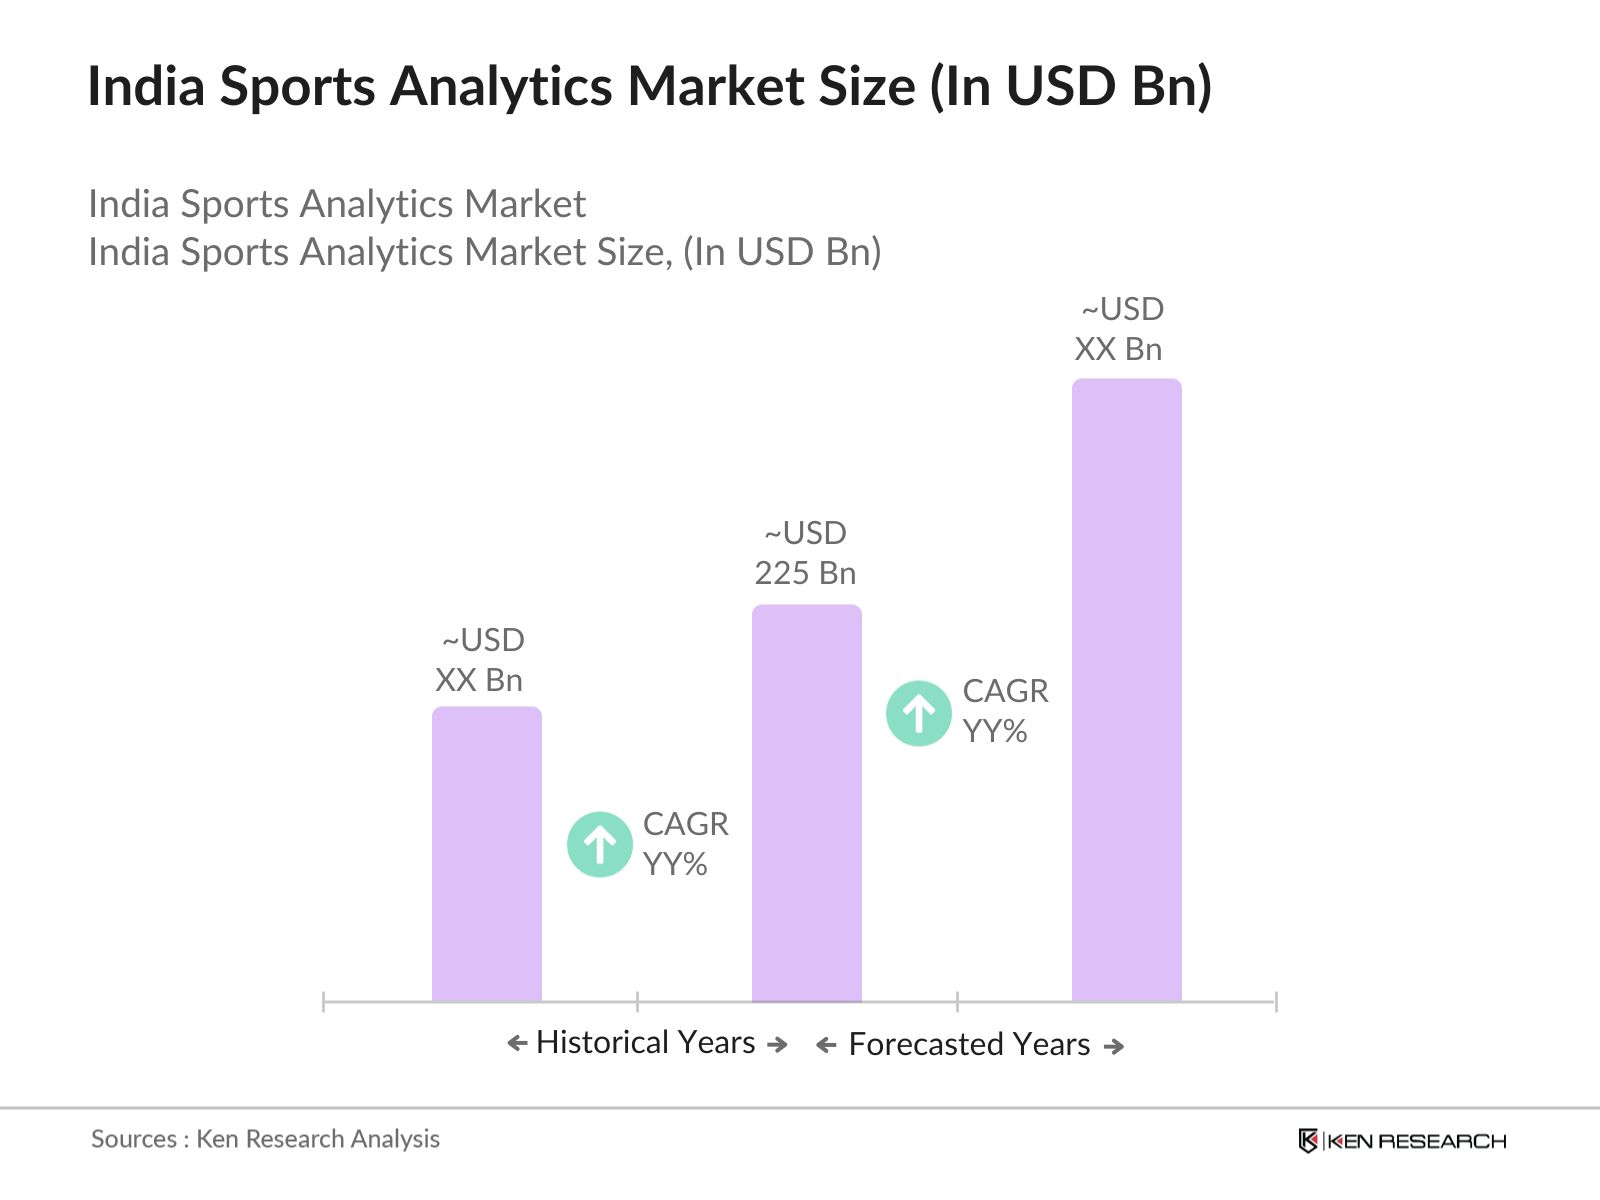
The India Sports Analytics market is valued at USD 225 million, driven by growing demand for real-time analytics tools and the digital transformation of sports organizations.
The India Sports Analytics market key challenges include high implementation costs, data security concerns, and a lack of skilled professionals adept in sports analytics.
The India Sports Analytics market major players include Catapult Sports, SAP SE, IBM, Stats Perform, and Sportradar, each offering a range of products focused on performance analysis and data integrity.
The India Sports Analytics market growth is propelled by the increasing adoption of AI and machine learning technologies, investment in sports infrastructure, and rising consumer interest in fan engagement platforms.
 Framework")
What makes us stand out is that our consultants follows Robust, Refine and Result (RRR) methodology. i.e. Robust for clear definitions, approaches and sanity checking, Refine for differentiating respondents facts and opinions and Result for presenting data with story

We have set a benchmark in the industry by offering our clients with syndicated and customized market research reports featuring coverage of entire market as well as meticulous research and analyst insights.

While we don't replace traditional research, we flip the method upside down. Our dual approach of Top Bottom & Bottom Top ensures quality deliverable by not just verifying company fundamentals but also looking at the sector and macroeconomic factors.

With one step in the future, our research team constantly tries to show you the bigger picture. We help with some of the tough questions you may encounter along the way: How is the industry positioned? Best marketing channel? KPI's of competitors? By aligning every element, we help maximize success.

Our report gives you instant access to the answers and sources that other companies might choose to hide. We elaborate each steps of research methodology we have used and showcase you the sample size to earn your trust.

If you need any support, we are here! We pride ourselves on universe strength, data quality, and quick, friendly, and professional service.