


India Virtual Cards Market Outlook to 2030
Region:Asia
Author(s):Yogita Sahu
Product Code:KROD11193
December 2024
82
About the Report
India Virtual Cards Market Overview
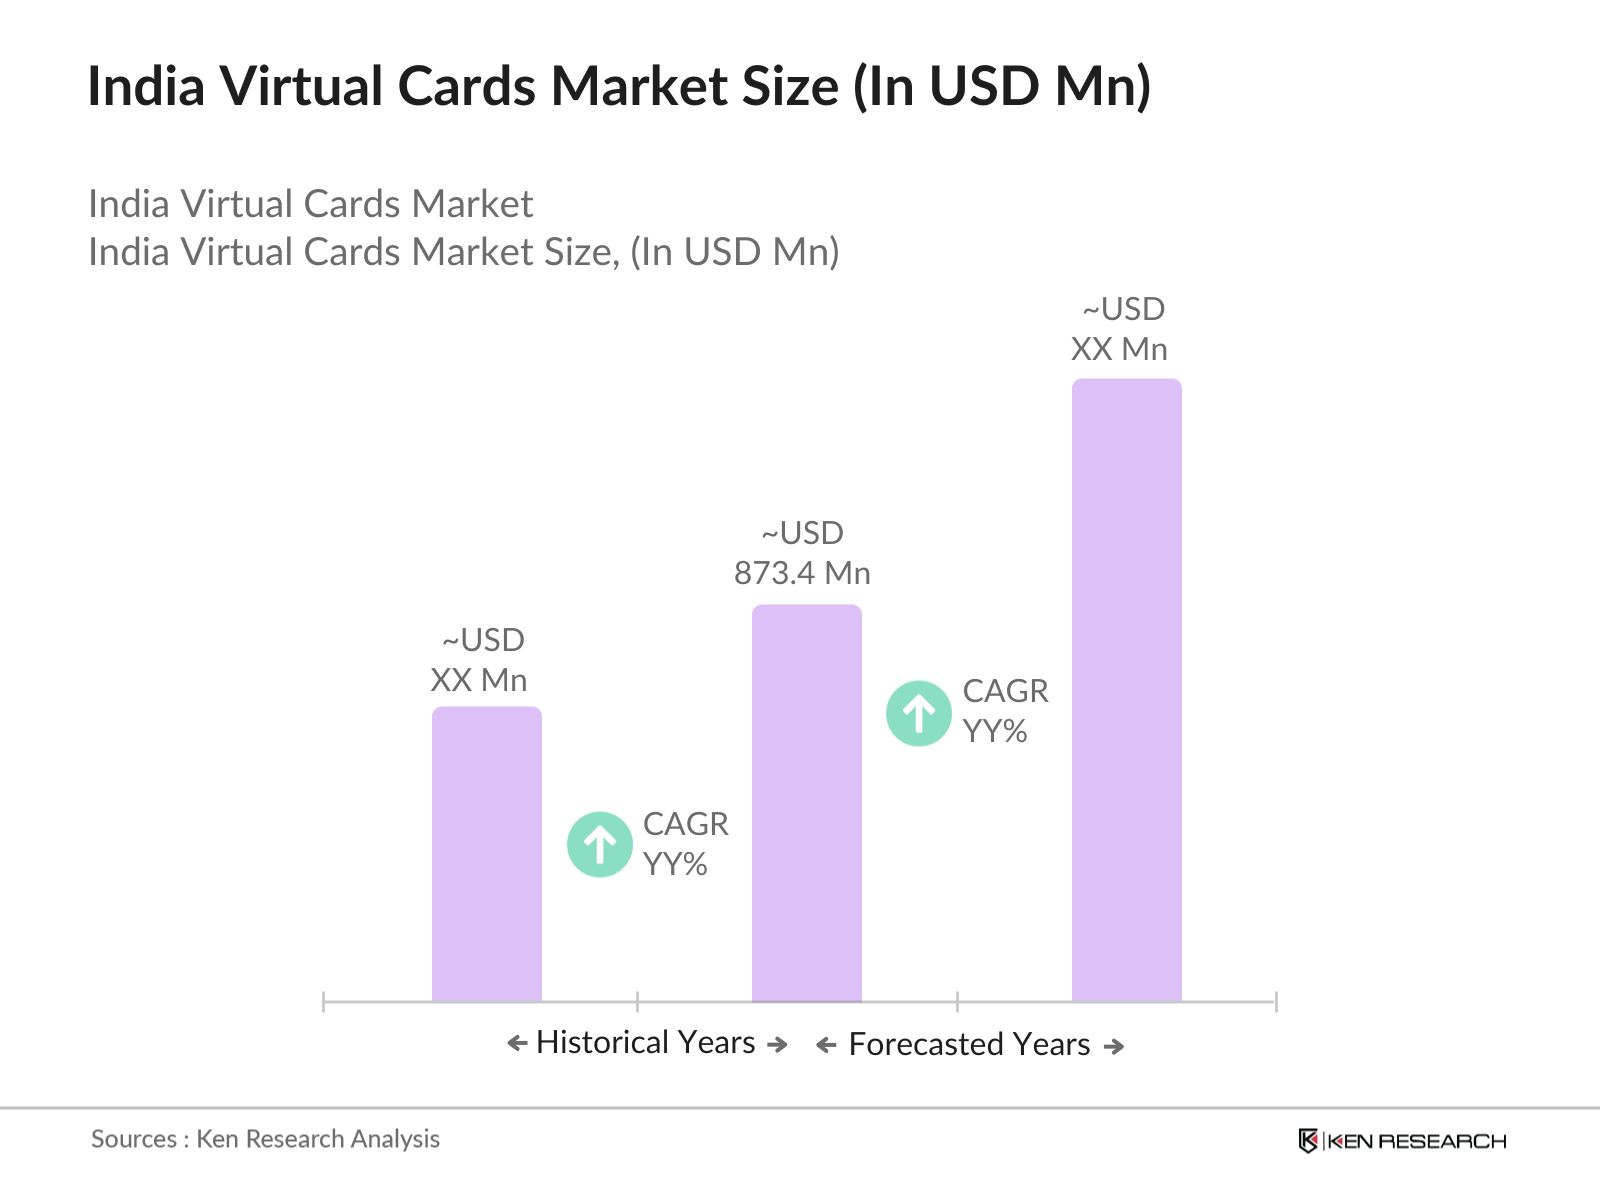
- The India Virtual Cards Market is valued at USD 873.4 million, driven by the rapid adoption of digital payment solutions and expanding internet penetration. A five-year analysis reveals significant growth due to rising e-commerce activities and a shift towards contactless payments, fueled by increasing awareness of the advantages of virtual cards. The trend towards cashless transactions, supported by government initiatives, further boosts the market.
- Major cities, such as Mumbai, Delhi, and Bengaluru, dominate the market due to their large digital consumer base and thriving fintech ecosystem. These cities have higher adoption rates for digital solutions, facilitated by a robust technology infrastructure, higher disposable incomes, and a well-established e-commerce environment. Additionally, these urban centers attract significant fintech investments, reinforcing their position in the virtual card market.
- The Digital India initiative received a budget increase to INR 5,000 crore in 2024, aimed at enhancing digital infrastructure. This expansion promotes digital payment adoption, indirectly benefiting the virtual cards market by creating a supportive ecosystem for cashless transactions.
India Virtual Cards Market Segmentation
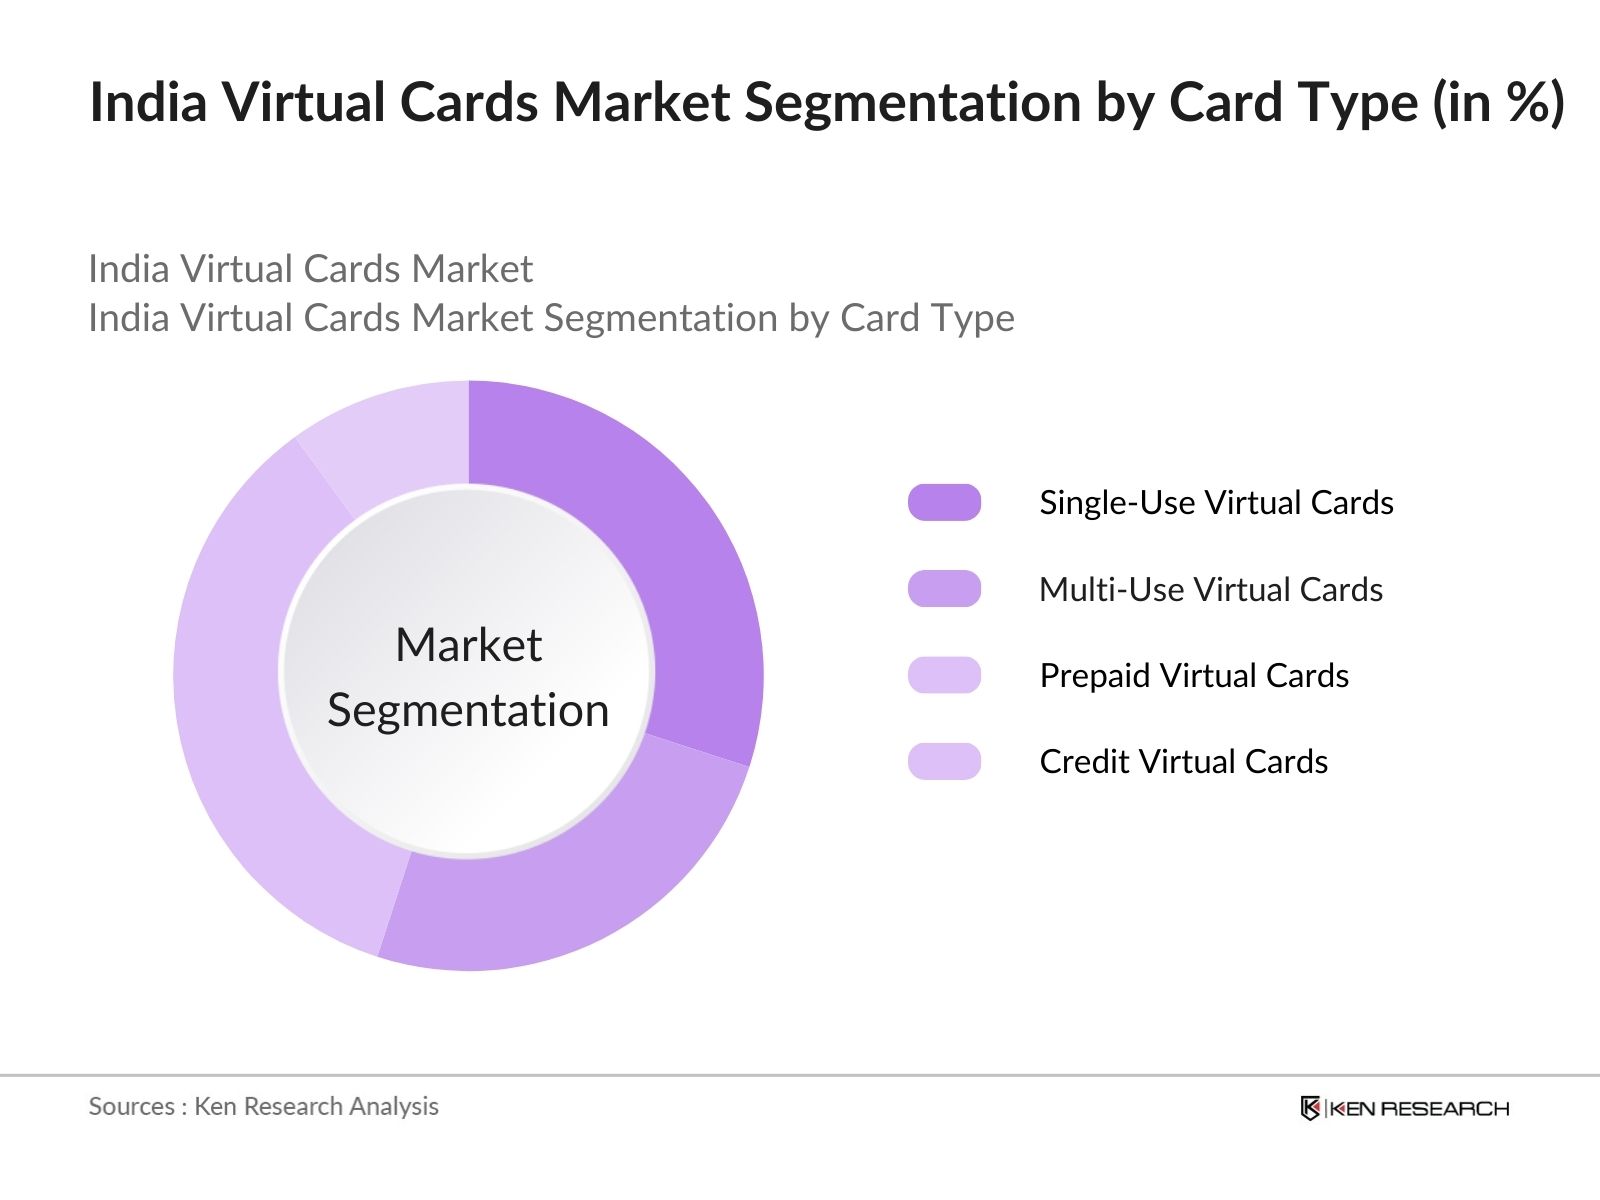
By Card Type: The market is segmented by card type into single-use virtual cards, multi-use virtual cards, prepaid virtual cards, and credit virtual cards. Prepaid virtual cards have gained a dominant market share due to their convenience and lower credit risk. They offer a straightforward payment solution that appeals to younger demographics and frequent online shoppers, driving their popularity.
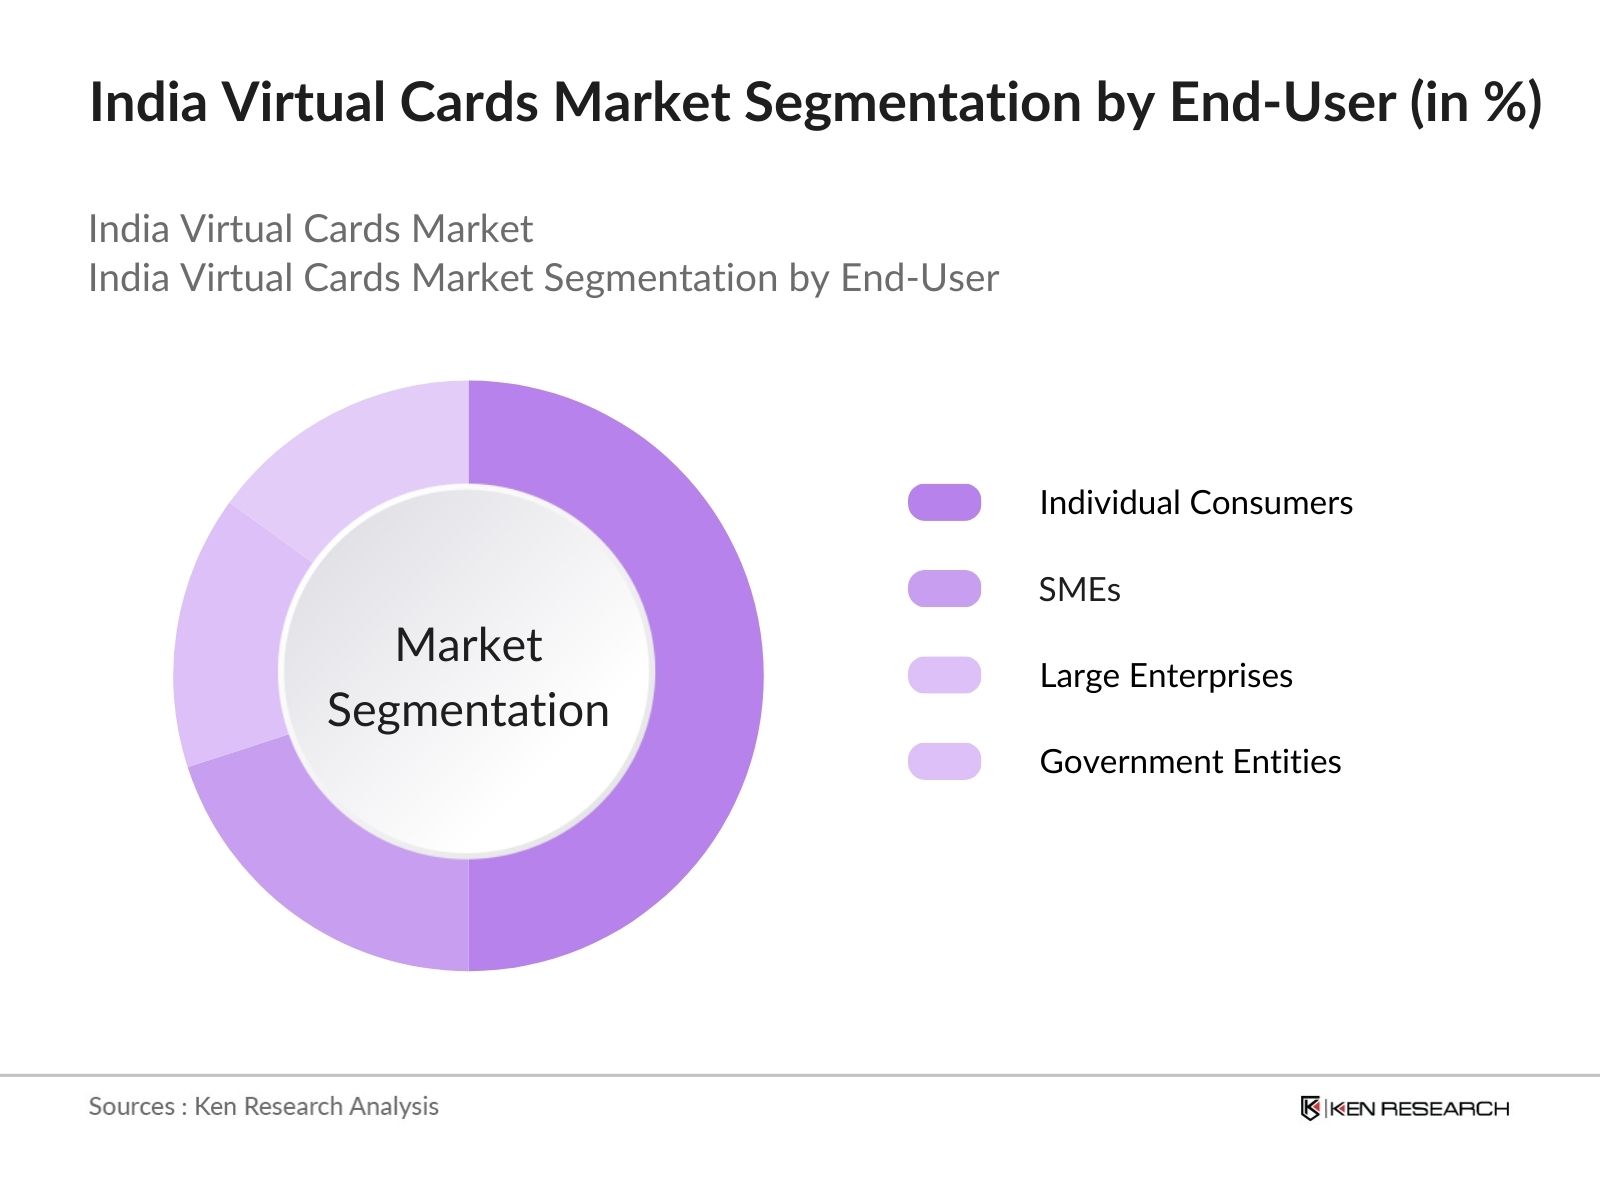
By End-User: The market is also segmented by end-user into individual consumers, small and medium enterprises (SMEs), large enterprises, and government entities. Individual consumers hold the highest market share, largely due to the growing demand for secure online payment options. Their convenience, security features, and ease of integration with mobile wallets make virtual cards particularly appealing to consumers who prioritize data privacy.
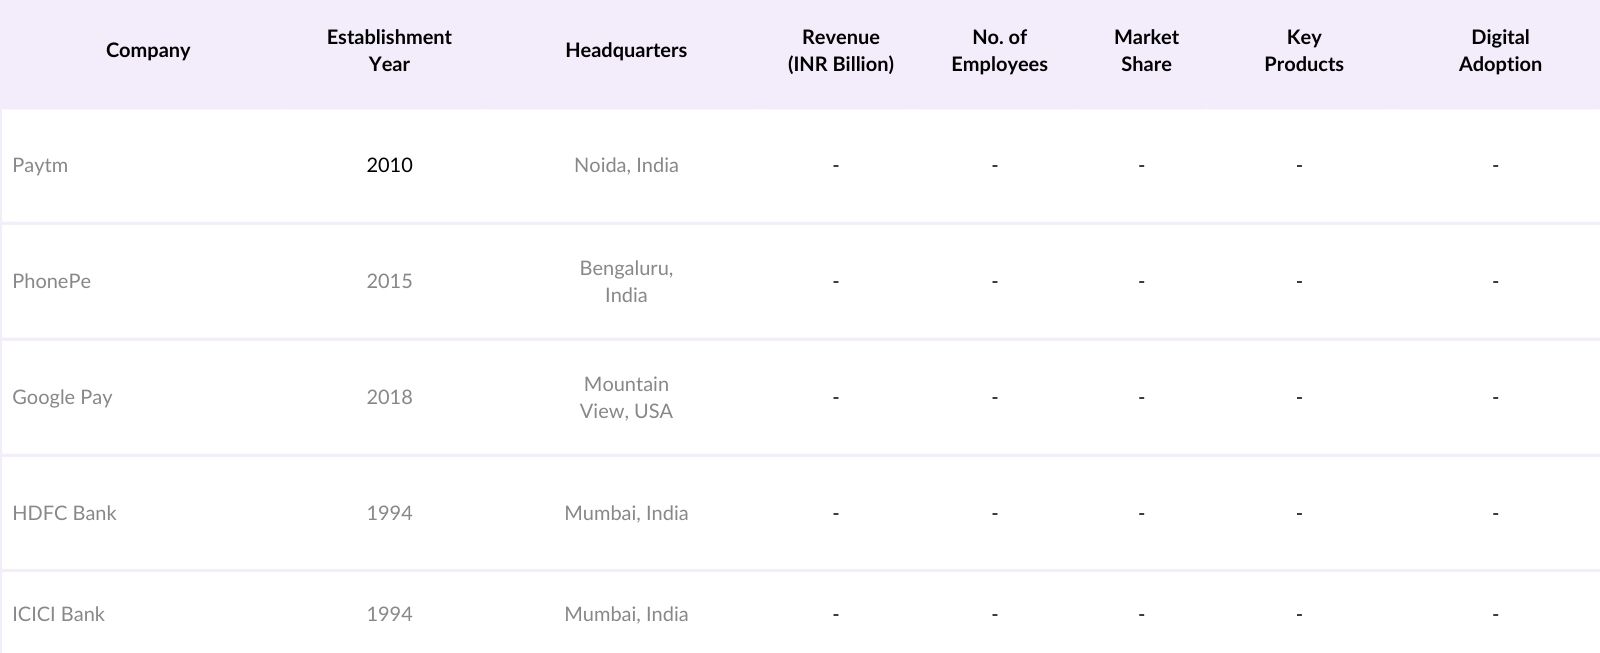
India Virtual Cards Market Competitive Landscape
The market is dominated by prominent financial institutions and fintech companies. These players are well-positioned due to their extensive distribution networks, technological advancements, and customer trust.
India Virtual Cards Market Analysis
Market Growth Drivers
- Increased Online Transactions: In 2024, India witnessed a rise in online transactions, with over 3.6 billion digital payments processed monthly. This surge, driven by the government's digital push, has increased the demand for virtual cards, which offer enhanced security and ease of use for online transactions.
- Rising E-commerce Sector: The Indian e-commerce market grew tremendously in 2024,. This growth, particularly among younger consumers preferring cashless payments, is fueling the demand for virtual cards, which are popular due to their convenience in online shopping.
- Growing Adoption in Corporate Payments: With over 600,000 registered businesses engaging in digital transactions, Indian corporates are increasingly adopting virtual cards to manage expenses and control employee spending. Virtual cards help reduce risks associated with traditional card fraud, aligning with corporate demand for better expense management tools.
Market Challenges
- Limited Infrastructure for Rural Usage: In rural India, where 65% of the population resides, digital infrastructure remains limited. Internet penetration in rural areas stands at around 35%, making it challenging to expand the usage of virtual cards among these populations, which slows overall market growth.
- Security and Fraud Concerns: The Reserve Bank of India (RBI) reports over 200,000 cases of digital fraud annually, causing apprehension among users regarding virtual card security. Despite security measures, user trust in virtual cards remains hindered due to frequent digital fraud incidents in the country.
India Virtual Cards Market Future Outlook
Over the next five years, the India Virtual Cards industry is expected to expand significantly, supported by continuous technological innovations, increasing internet penetration, and a shift towards digital transactions.
Future Market Opportunities
- Growth in Virtual Card-linked Loyalty Programs: Market insights indicate that by 2029, virtual cards will be integrated with loyalty programs more frequently. Around 250 million transactions are expected annually through these programs, as virtual cards drive engagement for consumer reward systems.
- Increased Corporate Adoption for Employee Payments: The Indian corporate sector is predicted to adopt virtual cards as a primary expense management tool. With over 1 million companies in India expected to utilize virtual cards by 2029, employee and business expense management will become more streamlined, contributing to market expansion.
Scope of the Report
|
Card Type |
Single-Use Virtual Cards |
|
End-User |
Individual Consumers |
|
Application |
Online Shopping |
|
Issuer Type |
Banks |
|
Region |
North East West South |
Products
Key Target Audience Organizations and Entities Who Can Benefit by Subscribing This Report:
Investor and venture capitalist firms
Government and regulatory bodies
Fintech companies
Digital payment providers
E-commerce platforms
Mobile wallet providers
Banking institutions
Cybersecurity firms
Companies
Players Mentioned in the Report:
Paytm
PhonePe
Google Pay
HDFC Bank
ICICI Bank
Axis Bank
State Bank of India (SBI)
Razorpay
PayU
Citrus Pay
Table of Contents
1. India Virtual Cards Market Overview
1.1. Definition and Scope
1.2. Market Taxonomy
1.3. Market Growth Rate
1.4. Market Segmentation Overview
2. India Virtual Cards Market Size (In USD Million)
2.1. Historical Market Size
2.2. Year-On-Year Growth Analysis
2.3. Key Market Developments and Milestones
3. India Virtual Cards Market Analysis
3.1. Growth Drivers
3.1.1. Digital Payment Adoption
3.1.2. E-commerce Expansion
3.1.3. Government Initiatives (e.g., Digital India)
3.1.4. Consumer Preference for Contactless Payments
3.2. Market Challenges
3.2.1. Cybersecurity Concerns
3.2.2. Limited Awareness in Rural Areas
3.2.3. Regulatory Compliance
3.3. Opportunities
3.3.1. Integration with Fintech Solutions
3.3.2. Expansion into Tier II and III Cities
3.3.3. Collaboration with E-commerce Platforms
3.4. Trends
3.4.1. Rise of Buy Now, Pay Later (BNPL) Services
3.4.2. Adoption of Blockchain for Security
3.4.3. Growth of Subscription-Based Models
3.5. Government Regulations
3.5.1. Reserve Bank of India (RBI) Guidelines
3.5.2. Data Localization Requirements
3.5.3. Know Your Customer (KYC) Norms
3.6. SWOT Analysis
3.7. Stakeholder Ecosystem
3.8. Porters Five Forces Analysis
3.9. Competitive Landscape
4. India Virtual Cards Market Segmentation
4.1. By Card Type (In Value %)
4.1.1. Single-Use Virtual Cards
4.1.2. Multi-Use Virtual Cards
4.1.3. Prepaid Virtual Cards
4.1.4. Credit Virtual Cards
4.2. By End-User (In Value %)
4.2.1. Individual Consumers
4.2.2. Small and Medium Enterprises (SMEs)
4.2.3. Large Enterprises
4.2.4. Government Entities
4.3. By Application (In Value %)
4.3.1. Online Shopping
4.3.2. Subscription Services
4.3.3. Travel and Hospitality
4.3.4. Bill Payments
4.3.5. Corporate Expenses
4.4. By Issuer Type (In Value %)
4.4.1. Banks
4.4.2. Fintech Companies
4.4.3. Non-Banking Financial Companies (NBFCs)
4.5. By Region (In Value %)
4.5.1. North India
4.5.2. South India
4.5.3. East India
4.5.4. West India
5. India Virtual Cards Market Competitive Analysis
5.1. Detailed Profiles of Major Companies
5.1.1. Paytm
5.1.2. PhonePe
5.1.3. Google Pay
5.1.4. Amazon Pay
5.1.5. ICICI Bank
5.1.6. HDFC Bank
5.1.7. Axis Bank
5.1.8. State Bank of India (SBI)
5.1.9. Kotak Mahindra Bank
5.1.10. Razorpay
5.1.11. PayU
5.1.12. Citrus Pay
5.1.13. MobiKwik
5.1.14. FreeCharge
5.1.15. Instamojo
5.2. Cross Comparison Parameters (Market Share, Revenue, User Base, Product Offerings, Technological Innovations, Strategic Partnerships, Regional Presence, Customer Satisfaction)
5.3. Market Share Analysis
5.4. Strategic Initiatives
5.5. Mergers and Acquisitions
5.6. Investment Analysis
5.6.1. Venture Capital Funding
5.6.2. Government Grants
5.6.3. Private Equity Investments
6. India Virtual Cards Market Regulatory Framework
6.1. Compliance Requirements
6.2. Certification Processes
6.3. Data Protection Laws
7. India Virtual Cards Future Market Size (In USD Million)
7.1. Future Market Size Projections
7.2. Key Factors Driving Future Market Growth
8. India Virtual Cards Future Market Segmentation
8.1. By Card Type (In Value %)
8.2. By End-User (In Value %)
8.3. By Application (In Value %)
8.4. By Issuer Type (In Value %)
8.5. By Region (In Value %)
9. India Virtual Cards Market Analysts Recommendations
9.1. Total Addressable Market (TAM), Serviceable Available Market (SAM), Serviceable Obtainable Market (SOM) Analysis
9.2. Customer Cohort Analysis
9.3. Marketing Initiatives
9.4. White Space Opportunity Analysis
Disclaimer Contact UsResearch Methodology
Step 1: Identification of Key Variables
This phase includes mapping all stakeholders in the India Virtual Cards Market, aided by extensive desk research. Data sources include secondary research databases, aiming to pinpoint variables influencing market growth.
Step 2: Market Analysis and Construction
In this phase, historical data is analyzed, covering market penetration and virtual card adoption trends. Data from verified sources ensures accurate revenue projections.
Step 3: Hypothesis Validation and Expert Consultation
Market hypotheses are tested via interviews with industry experts, delivering operational insights to enhance market estimations and validate findings.
Step 4: Research Synthesis and Final Output
The last phase incorporates direct insights from major market players, confirming the accuracy of collected data and refining the final report for comprehensive market coverage.
Frequently Asked Questions
01. How big is the India Virtual Cards Market?
The India Virtual Cards Market is valued at USD 873.4 million, driven by high digital payment adoption rates, particularly among urban consumers.
02. What are the primary growth drivers for the India Virtual Cards Market?
Key drivers in the India Virtual Cards Market include government initiatives, the growth of e-commerce, and increased consumer preference for contactless payments.
03. What are the challenges in the India Virtual Cards Market?
Challenges in the India Virtual Cards Market include cybersecurity threats, compliance with data protection regulations, and the need for greater rural penetration.
04. Who are the major players in the India Virtual Cards Market?
Top players in the India Virtual Cards Market include Paytm, PhonePe, Google Pay, HDFC Bank, and ICICI Bank, each leveraging strong digital networks and brand presence.
Why Buy From Us?
 Framework")
What makes us stand out is that our consultants follows Robust, Refine and Result (RRR) methodology. i.e. Robust for clear definitions, approaches and sanity checking, Refine for differentiating respondents facts and opinions and Result for presenting data with story

We have set a benchmark in the industry by offering our clients with syndicated and customized market research reports featuring coverage of entire market as well as meticulous research and analyst insights.

While we don't replace traditional research, we flip the method upside down. Our dual approach of Top Bottom & Bottom Top ensures quality deliverable by not just verifying company fundamentals but also looking at the sector and macroeconomic factors.

With one step in the future, our research team constantly tries to show you the bigger picture. We help with some of the tough questions you may encounter along the way: How is the industry positioned? Best marketing channel? KPI's of competitors? By aligning every element, we help maximize success.

Our report gives you instant access to the answers and sources that other companies might choose to hide. We elaborate each steps of research methodology we have used and showcase you the sample size to earn your trust.

If you need any support, we are here! We pride ourselves on universe strength, data quality, and quick, friendly, and professional service.