
Indonesia Agritech Market Outlook to 2026
Driven by Innovative Start-ups and Influx of Foreign Investors
Region:Asia
Author(s):Tania Bansal, Viraj Pangam
Product Code:KR1139
March 2022
159
About the Report
The report titled “Indonesia Agritech Market Outlook to 2026: Driven by Innovative Startups and Influx of Foreign Investors” provides a comprehensive analysis of the Digital Agricultural market in Indonesia. The report focuses on the agritech market size, analysis of sub verticals such as Farming as a Service (FaaS), Agri Fintech, Market Access, AgriTech, and Agri Biotech. It also focuses on segmentation of Agritech Startups by Sub Vertical, by year of establishment, by location, by Funding Stage, and by Funding Entity.
Other major areas under focus are Indonesian Agricultural Sector Overview, demand and supply side of Indonesia agriculture, Agritech ecosystem and Operating model, trends and developments in Indonesia agritech market, Challenges faced by Agritech Startups, Regulatory landscape, Government Initiatives, Technology trends in the Agritech market, Porter’s Five Forces Analysis of Indonesian Agritech Industry, Growth Drivers, and Competitive Landscape.
The report also covers areas like demand analysis, service portfolio, operating model, timeline of the major startups, challenges faced by the players, cross comparison between players for each of the sub vertical in the agritech industry. The report concludes with future market projections on the basis of overall outlook of the Indonesia Agritech market, analyst recommendations, and the Industry Speaks section.
Overview of Indonesia Agriculture Industry
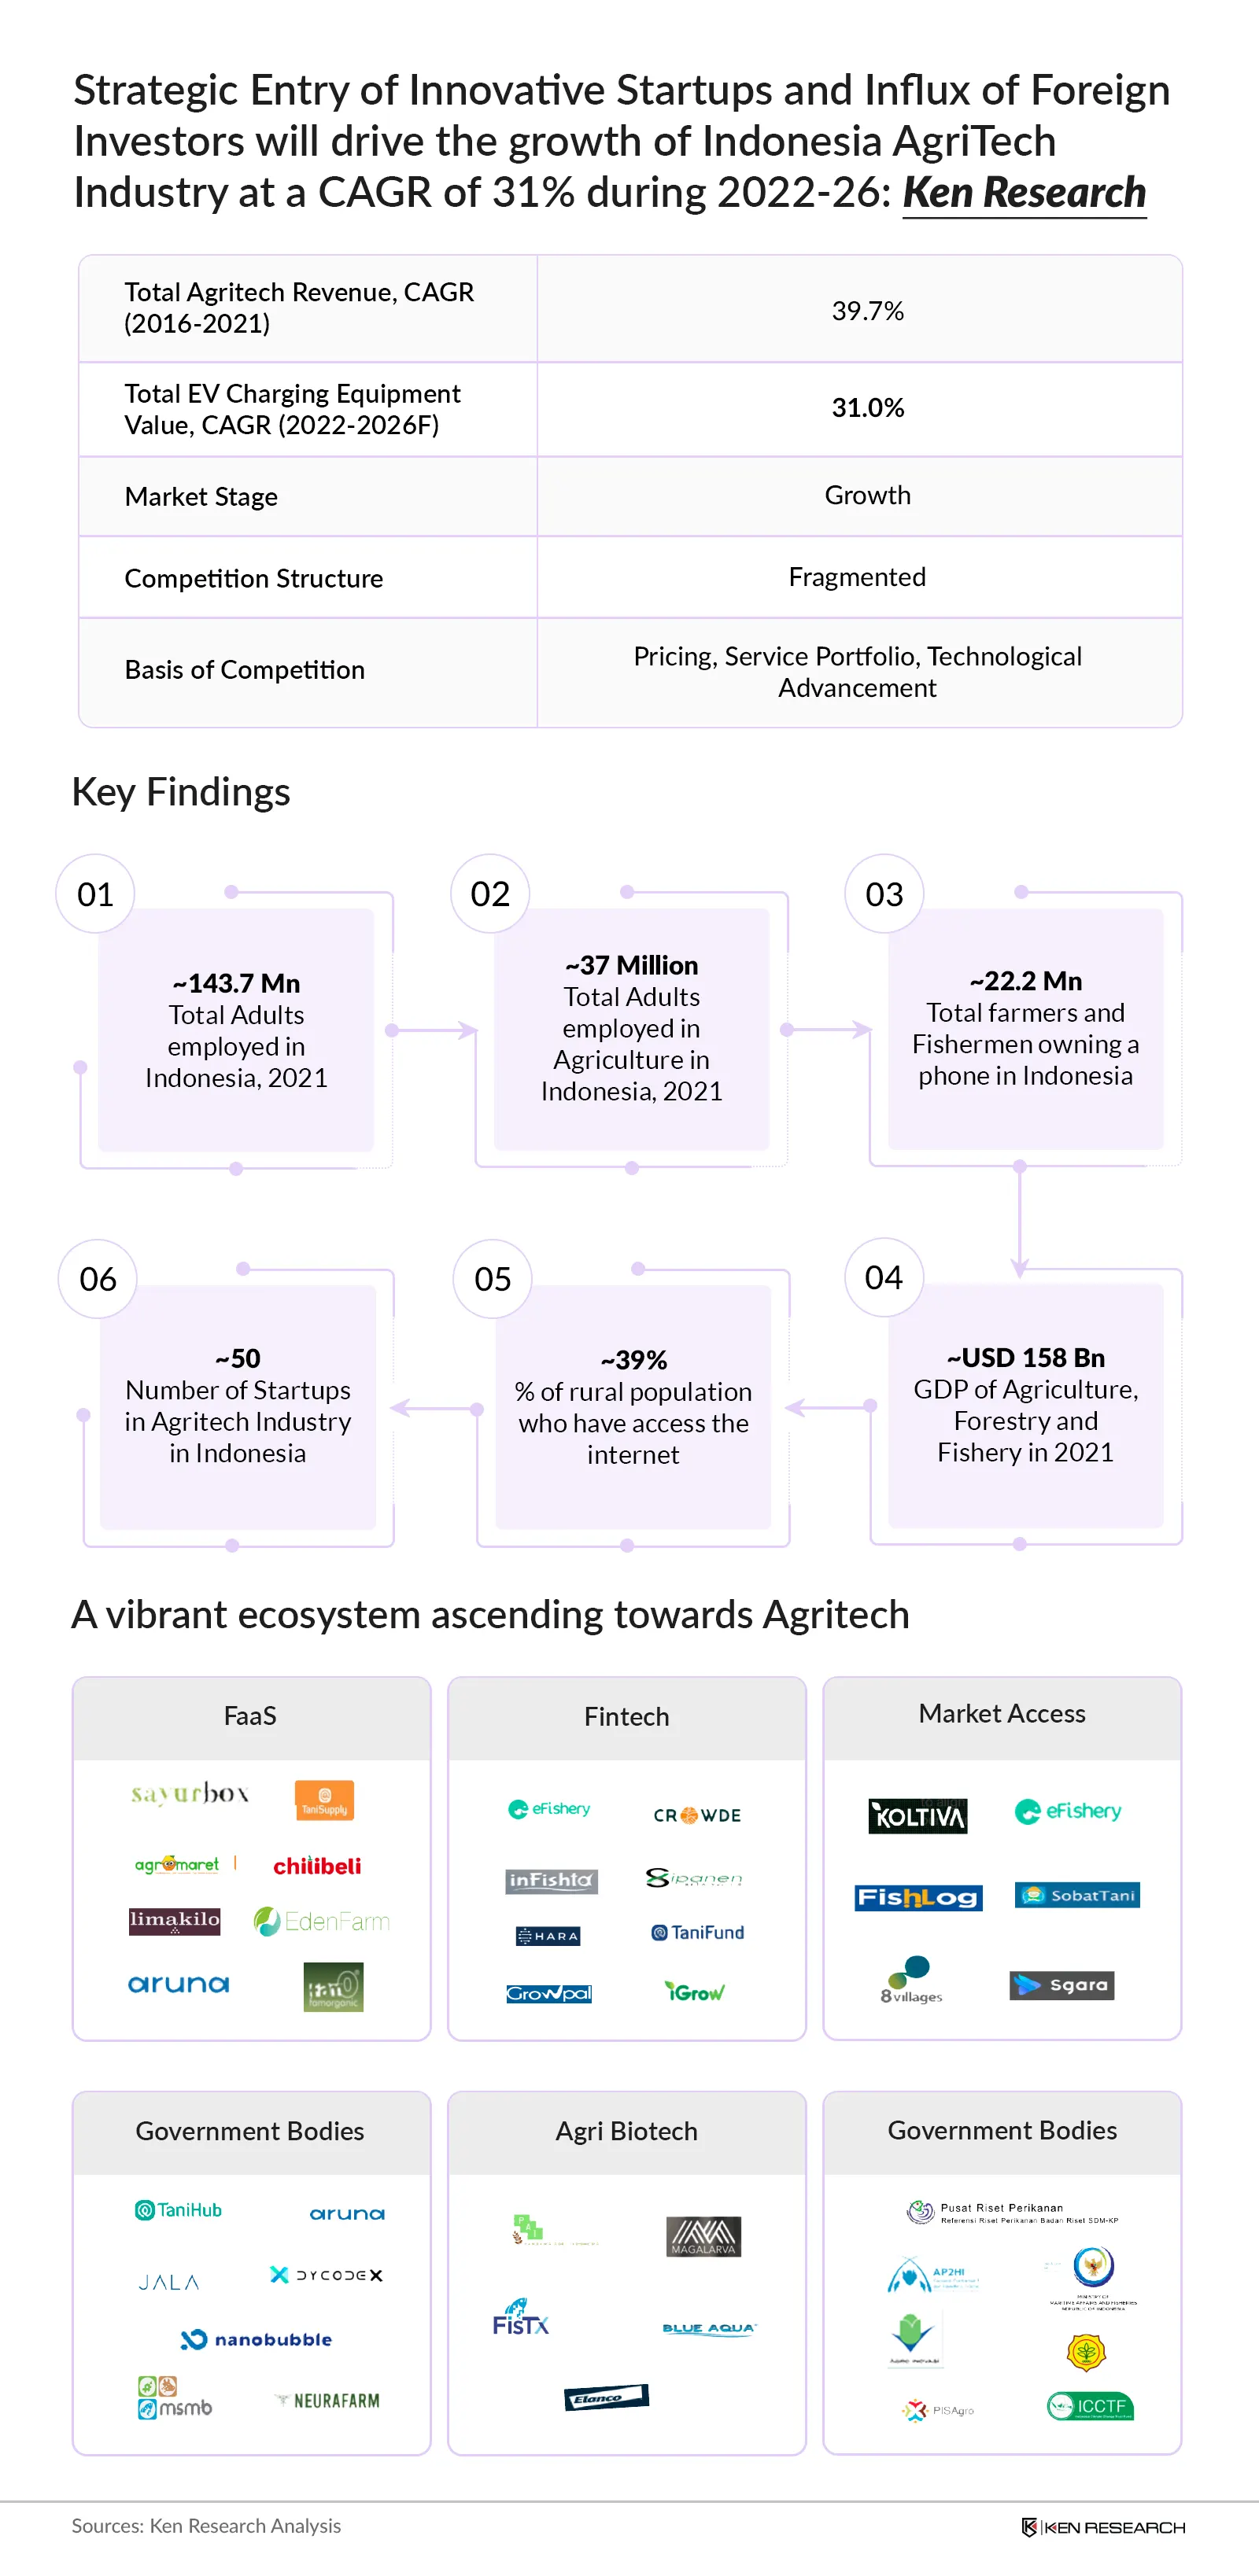
There are total 37 million adults employed in the Agriculture Sector in Indonesia with 25.4 million farmers and 11.6 million fishermen. The average daily gross wage of workers in agriculture sector stood at USD 3.7 in 2020. The workers in the agricultural industry still received one of the lowest wages in the country. Around 27% of the total employment is employed in Agriculture in Indonesia. The Gross Domestic Product of Agriculture, Forestry, and Fishery in Indonesia stood at USD 158 Billion in the year 2021 growing at a CAGR of 5.8% during 2016 to 2021.
Overview of Indonesia Agritech Market
Indonesia Agritech market grew at a CAGR of ~39.7 % on the basis of revenue generated during FY’16-FY’21. Farming as a Service (FaaS) sub vertical dominated the Agritech Market in Indonesia on the basis of revenue generated in FY’21 followed by the AgriTech, Agri Fintech, Market Access, and Agri Biotech sub verticals. The market was also observed to be highly fragmented and dominated by the emerging startups in each vertical.
Ambitious government initiatives, rising adoption of digital services, increased investment by foreign investors, and emergence of startups in the last five years has led to the growth of in Indonesia. Indonesia has benefitted from a strong AgriTech presence that has been driving technological innovation in the agricultural sector.
Indonesia Agritech Market Sub Verticals:
Farming as a Service (FaaS): The Farming as a Service (FaaS) vertical in Indonesia is the largest contributor to the Indonesia Agritech market. This market has seen a steady rise from FY’ 16 to FY’21. There has been a strong increase in demand for the services provided by FaaS startups in the last five years, which is mostly due to the increase in smartphone and internet penetration in Indonesia. The competition structure is monopolistic, with Sayurbox, Tanisupply, and Aruna leading the FaaS market.
Agri Fintech: Demand in the agri fintech sector is significantly driven by government support, which helps in achieving various goals related to financial inclusion and digital literacy, along with helping formalize one of the most informal economic sectors in the country. The competition structure is monopolistic, with Tanifund, eFishery, Koltiva and iGrow capturing the market share.
Market Access: The demand for upstream supply chain aggregators has not increased as much as other sub verticals such as FaaS, primarily due to greater levels of poverty among farmers and fishermen as compared to end consumers, most of whom reside in urban clusters in Indonesia.
The competition structure is oligopolistic, with eFishery, Koltiva and 8villages making up almost all the market share by revenue.
Agri Biotech: Demand for Agri Biotech products is expected to grow exponentially as there is pressure on farming and fishing ecosystems throughout the world to produce more output to combat the problem of food security. The competition structure is oligopolistic, with Pandawa Agri and Magalarva making up almost the entire market share.
Indonesia Agritech Market Future Outlook and Projections
The Agritech Market in Indonesia is anticipated to grow with the growing adoption of digital tools in farming and government initiatives making the process of lending easier. Over the forecast period FY’22-FY’26, the Indonesia Agritech Market is further anticipated to showcase an upward trend in terms of value, better than the earlier years, with the market consistently expanding. AgTechs will reshape the relationships across value chains and will build entirely new ecosystems.
Key Topics Covered in the Report: -
- Indonesia Agricultural Sector Overview
- Indonesia Agriculture Industry Demographics
- Demand Side: Indonesia Agriculture Scenario
- Overview of Indonesia Agritech Market
- Overview of Digital Tools
- Ecosystem of Major Entities in the Indonesia Agritech Market
- Agritech Operating Model
- Market Sizing of the AgriTech Industry
- Market Sizing of the Sub Segments of AgriTech Industry
- Segmentation of Startups by Business Category
- Segmentation of Startups by year of establishment
- Trends and Developments in Agritech market
- Challenges faced by Agritech Startups
- Regulatory Landscape in Agritech market
- Major Government Initiatives in Agritech market in Indonesia
- Technology Trends in the Agritech Industry
- Porter’s Five Forces Analysis of Indonesian Agritech Industry
- Growth Drivers in the Agricultural Market in Indonesia
- Competition Scenario between sub verticals
- Overview of sub vertical: FaaS
- Overview of sub vertical: Fintech
- Overview of sub vertical: Market Access
- Overview of sub vertical: Agritech
- Overview of sub vertical: Agri Biotech
- Demand Analysis of each of the sub verticals
- Service Portfolio of each of the sub verticals
- Cross Comparison between Major Players
- Case Studies (Chilibeli, Sayurbox, TaniFund, Crowde, eFishery, Koltiva, Dycodex, Aruna, Magalarva )
- Future Outlook & Projections
- Supply Side: Indonesia Agriculture Scenario
- Segmentation of Startups by Location
- Segmentation of Startups by Funding Stage
- Segmentation of Startups by Funding Entity
- Comparison between Technology used in Agritech Space
- Analyst Recommendations
- What Lies Ahead for the Agritech Industry?
- Technology Roadmap
- Industry Speaks
Products
Key Target Audience
Farming as a Service players
Agri Fintech players
Agritech players
Market Access Players
Agri Biotech players
Farmers/Fishermen
Investors
Regulatory Bodies
Feed, Equipment, Fertilizer Suppliers
Time Period Captured in the Report
Historical Period: FY’16-FY’21
Forecast Period: FY’22-FY’26
Companies
Key Segments Covered in Indonesia Agritech Market:-
Agritech Market Size
Market Size on the basis of revenue generated, FY’16-FY’21
Market size of the 5 sub verticals on the basis of revenue generated, FY’16-FY’21
Market Segmentation
Segmentation of Startups by Business Category (FaaS, Fintech, Market Access, Agritech Driven, Agri Biotech)
Segmentation of Startups by year of establishment (FY’13-FY’20)
Segmentation of Startups by Location Jakarta, Bogor, Bandung, Malang, Yogyakarta, Depok, Setiabudi, Tangerang, Bekasi, Sleman, Lampung, Arcamanik)
Segmentation of Startups by Funding Stage (Pre Seed, Seed, Series A, Series B, Convertible Note, Grant, Debt Financing)
Segmentation of Startups by Funding Entity (Foreign, Domestic, Both)
Overview of each Sub vertical (FaaS, Fintech, Market Access, Agritech, Agri Biotech) on the basis of
Demand Analysis
Operating Model
Timeline of Major Players
Service Portfolio
Challenges
Competitive Scenario
Cross Comparison between Major Players
Case Study
Future Outlook & Projections
Analyst Recommendations
Agritech Players in Indonesia
FaaS Players:
Sayurbox
TaniSupply
Aruna
Fintech Players:
TaniFund
eFishery
Koltiva
Market Access Players
8 Villages
Fishlog
Sgara
Agritech Driven Players:
Neurafarm
Dycodex
JALA
Agri Biotech Players:
Pandawa Agri
Magalarva
FistX
Table of Contents
1. Executive Summary
2. Introduction to Indonesia Agriculture Scenario
2.1. Indonesia Agriculture Industry Demographics
2.2. Demand Side: Indonesia Agriculture Scenario
2.3. Supply Side: Indonesia Agriculture Scenario, 2021
3. Market Overview of Indonesia Agritech
3.1. Overview of Indonesia Agritech Market
3.2. Overview of Digital Tools
3.3. Overview of 5 Segments under Agritech Market
3.4. Ecosystem of Major Entities in the Indonesia Agritech Market
3.5. Agritech Operating Model
4. Market Sizing on the basis of revenue generated in USD Mn, FY’16-FY’21
4.1. Market Sizing of the AgriTech Industry
4.2. Market Sizing of the Sub Segments of AgriTech Industry
5. Market Segmentation on the basis of number of startups, FY’21
5.1. Segmentation of Startups by Business Category (FaaS, Fintech, Market Access, Agritech, Agri Biotech)
5.2. Segmentation of Startups by year of establishment (FY’13-FY’20)
5.3. Segmentation of Startups by Location (Jakarta, Bogor, Bandung, Malang, Yogyakarta, Depok, Setiabudi, Tangerang, Bekasi, Sleman, Lampung, Arcamanik)
5.4. Segmentation of Startups by Funding Stage (Pre Seed, Seed, Series A, Series B, Convertible Note, Grant, Debt Financing)
5.5. Segmentation of Startups by Funding Entity (Foreign, Domestic, Both)
6. Analysis of the Indonesia Agritech Industry
6.1. Trends and Developments
6.2. Pain Points
6.3. Challenges faced by Agritech Startups
6.4. Regulatory Landscape
6.5. Government Initiatives
6.6. Technology Trends in the Agritech Industry
6.7. Porter’s Five Forces Analysis of Indonesian Agritech Industry
6.8. Growth Drivers in the Agricultural Market in Indonesia
7. Competitive Analysis
7.1. Competition Scenario
7.2. Comparison between Technology used in Agritech Space
8. Sub vertical analysis: FaaS
8.1. Executive Summary
8.2. Demand Analysis
8.3. Operating Model of FaaS Sub Vertical
8.4. Timeline of Major Players in FaaS
8.5. Service Portfolio of FaaS Players
8.6. Challenges Faced by FaaS Players
8.7. Competitive Scenario
8.8. Cross Comparison between Major Players (Sayurbox, TaniSupply, Aruna, Limakilo, Agromaret, Eden Farm, Chilibeli), FY’21 in terms of Service Portfolio, Revenue Model, Strengths, Weaknesses, Partnerships
8.9. Cross Comparison between Major Players (Sayurbox, TaniSupply, Aruna, Limakilo, Agromaret, Eden Farm, Chilibeli), FY’21 in terms of Operational and Financial Parameters (Funding, Funding Stage, Year of establishment, Location, Employee Size, Number of farmers served, No. of operational segments, Revenue)
8.10. Case Study- Chilibeli
8.11. Case Study - Sayurbox
8.12. Future Outlook & Projections on the basis of revenue generated in USD Mn, FY’22- FY’26
8.13. Analyst Recommendations
9. Sub vertical analysis: Fintech
9.1. Executive Summary
9.2. Demand Analysis
9.3. Operating Model of Fintech Sub Vertical
9.4. Timeline of Major Players in Fintech
9.5. Service Portfolio of FaaS Players
9.6. Challenges Faced by Fintech Players
9.7. Competitive Scenario
9.8. Cross Comparison between Major Players (TaniFund, Koltiva, eFishery, iGrow, Crowde, HARA, Sipanen), FY’21 in terms of Service Portfolio, Revenue Model, Strengths, Weaknesses, Partnerships
9.9. Cross Comparison between Major Players (TaniFund, Koltiva, eFishery, iGrow, Crowde, HARA, Sipanen), FY’21 in terms of Operational and Financial Parameters (Funding, Funding Stage, Year of establishment, Location, Employee Size, Number of farmers served, No. of operational segments, Revenue)
9.10 Case Study – TaniFund
9.11 Case Study – Crowde
9.10. Future Outlook & Projections on the basis of revenue generated in USD Mn, FY’22- FY’26
9.12 Analyst Recommendations
10. Sub vertical analysis: Market Access
10.1. Executive Summary
10.2. Demand Analysis
10.3. Operating Model of Market Access Sub Vertical
10.4. Timeline of Major Players in Market Access
10.5. Service Portfolio of Market Access Players
10.6. Challenges Faced by Market Access Players
10.7. Competitive Scenario
10.8. Cross Comparison between Major Players (eFishery, Koltiva, 8 villages, Fishlog, Sgara), FY’21 in terms of Service Portfolio, Revenue Model, Strengths, weaknesses, Partnerships
10.9. Cross Comparison between Major Players (eFishery, Koltiva, 8 villages, Fishlog, Sgara), FY’21 in terms of Operational and Financial Parameters (Funding, Funding Stage, Year of establishment, Location, Employee Size, Number of farmers served, No. of operational segments, Revenue)
10.10. Case Study- eFishery
10.11. Case Study – Koltiva
10.12. Future Outlook & Projections on the basis of revenue generated in USD Mn, FY’22- FY’26
10.13. Analyst Recommendations
11. Sub vertical analysis: Agritech driven companies within sub-segments like hydroponics, aquaponics, vertical farming, dairy, poultry, meat, seafood
11.1. Executive Summary
11.2. Demand Analysis
1.1. Operating Model of Agritech Driven Sub Vertical
1.2. Timeline of Major Players in Agritech Driven
1.3. Service Portfolio of Agritech Driven Players
1.4. Challenges Faced by Agritech Driven Players
11.7. Competitive Scenario
11.8. Cross Comparison between Major Players (TaniHub, Aruna, Neurafarm, Dycodex, JALA), FY’21 in terms of Service Portfolio, Revenue Model, Strengths, weaknesses, Partnerships
11.9. Cross Comparison between Major Players (TaniHub, Aruna, Neurafarm, Dycodex, JALA), FY’21 in terms of Operational and Financial Parameters (Funding, Funding Stage, Year of establishment, Location, Employee Size, Number of farmers served, No. of operational segments, Revenue)
11.10. Case Study - Aruna
11.11. Case Study - Dycodex
11.12. Future Outlook & Projections on the basis of revenue generated in USD Mn, FY’22- FY’26
11.13. Analyst Recommendations
12. Sub vertical analysis: Agri Biotech
12.1. Executive Summary
12.2. Demand Analysis
12.3. Operating Model of Agri Biotech Sub Vertical
12.4. Timeline of Major Players in Agri Biotech
12.5. Service Portfolio of Agri Biotech Players
12.6. Challenges Faced by Agri Biotech Players
12.7. Competitive Scenario
12.8. Cross Comparison between Major Players (Pandawa Agri, Magalarva, FistX), FY’21 in terms of Service Portfolio, Revenue Model, Strengths, weaknesses, Partnerships
12.9. Cross Comparison between Major Players (Pandawa Agri, Magalarva, FistX), FY’21 in terms of Operational and Financial Parameters (Funding, Funding Stage, Year of establishment, Location, Employee Size, Number of farmers served, No. of operational segments, Revenue)
12.10. Case Study - Magalarva
12.11. Future Outlook & Projections on the basis of revenue generated in USD Mn, FY’22- FY’26
12.12. Analyst Recommendations
13. Outlook and Projections of the Industry, FY’22-FY’26
13.1. Future Outlook & Projections
13.2. What Lies Ahead for the Agritech Industry?
13.3. Technology Roadmap
14. Industry Speaks
15. Research Methodology
15.1. Market Definitions and Assumptions
15.2. Abbreviations
15.3. Market Sizing Approach
15.4. Consolidated Research Approach
15.5. Understanding Market Potential Through In-Depth Industry Interviews
15.6. Primary Research Approach
15.7. Limitations and Future Conclusion
Disclaimer
Contact us
Why Buy From Us?
 Framework")
What makes us stand out is that our consultants follows Robust, Refine and Result (RRR) methodology. i.e. Robust for clear definitions, approaches and sanity checking, Refine for differentiating respondents facts and opinions and Result for presenting data with story

We have set a benchmark in the industry by offering our clients with syndicated and customized market research reports featuring coverage of entire market as well as meticulous research and analyst insights.

While we don't replace traditional research, we flip the method upside down. Our dual approach of Top Bottom & Bottom Top ensures quality deliverable by not just verifying company fundamentals but also looking at the sector and macroeconomic factors.

With one step in the future, our research team constantly tries to show you the bigger picture. We help with some of the tough questions you may encounter along the way: How is the industry positioned? Best marketing channel? KPI's of competitors? By aligning every element, we help maximize success.

Our report gives you instant access to the answers and sources that other companies might choose to hide. We elaborate each steps of research methodology we have used and showcase you the sample size to earn your trust.

If you need any support, we are here! We pride ourselves on universe strength, data quality, and quick, friendly, and professional service.