
Indonesia Basic Chemicals Market Outlook 2030
Region:Global
Author(s):Shivani Mehra
Product Code:KROD3162
December 2024
89
About the Report
Indonesia Basic Chemicals Market Overview
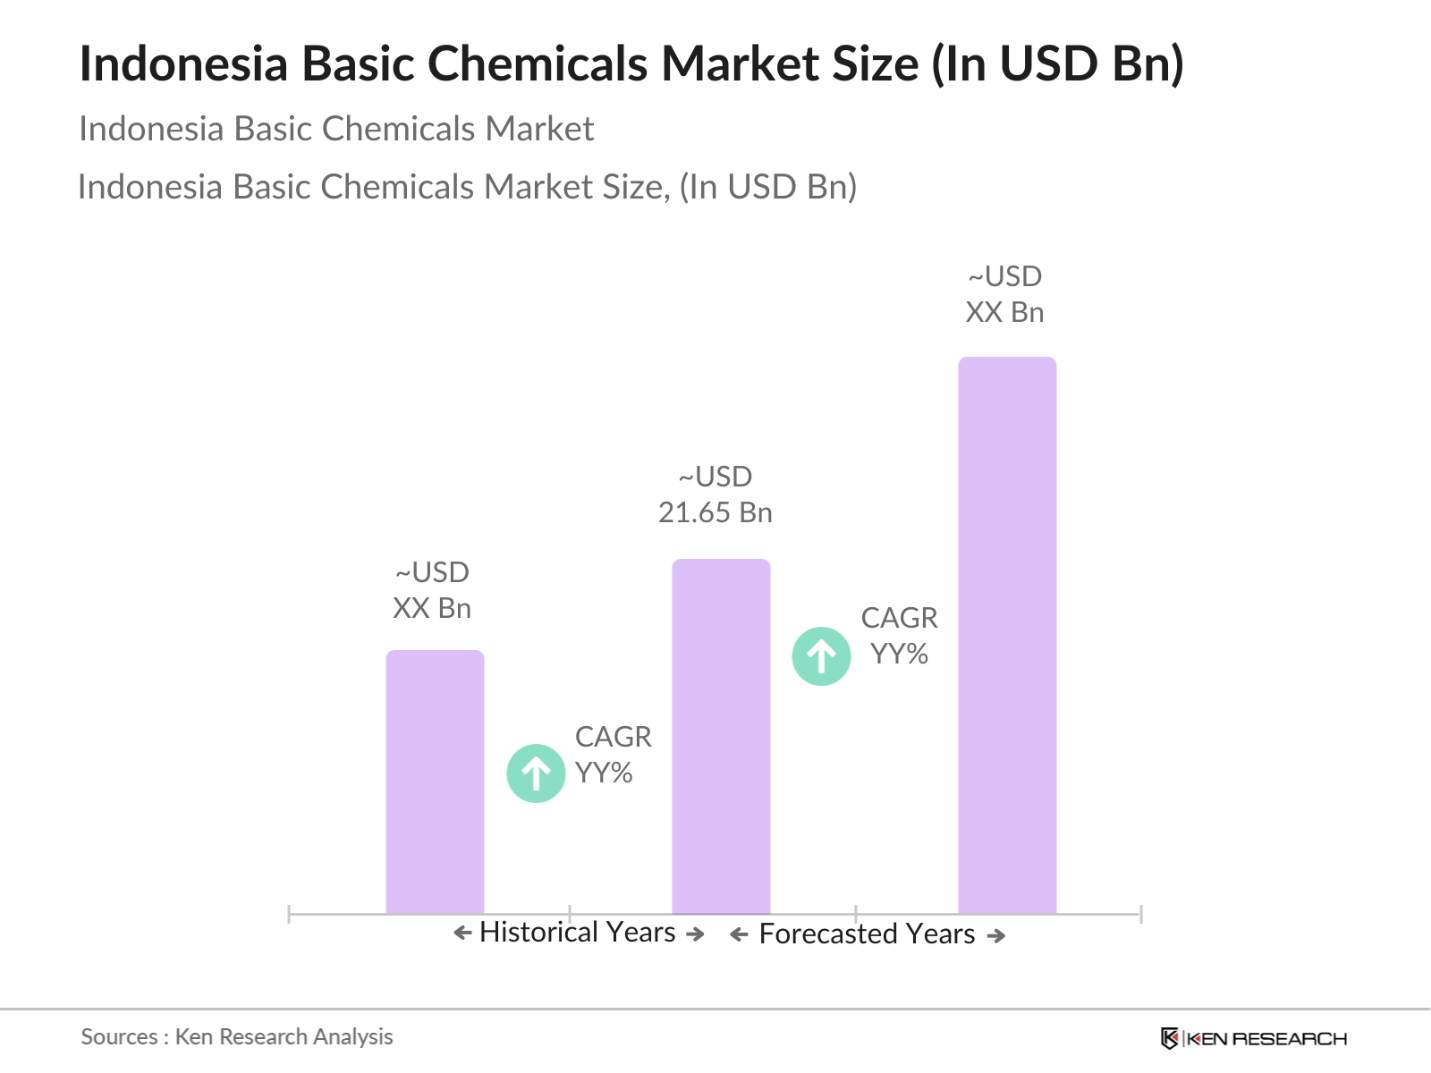
- The Indonesia basic chemicals market is valued at USD 21.65 billion, driven primarily by the country's robust industrial growth and increasing demand for chemical products across various sectors. The market's expansion is fueled by a growing middle class, urbanization, and government initiatives aimed at enhancing the manufacturing sector. Significant investments in infrastructure and development projects further contribute to the demand for basic chemicals, positioning Indonesia as a vital player in the Southeast Asian chemical industry.
- Major cities such as Jakarta, Surabaya, and Bandung dominate the Indonesia basic chemicals market due to their developed industrial bases and strategic locations. Jakarta, as the capital and economic hub, attracts numerous chemical companies and facilitates the import and export of raw materials. Surabaya serves as a significant port city, enhancing logistical capabilities for chemical distribution. These urban centers also benefit from a strong workforce and a growing consumer market, making them critical for the industry's continued growth.
- Indonesia's National Chemical Policy Framework serves as a vital regulatory guide for the chemical industry, focusing on sustainable development and safety standards. The framework emphasizes compliance with environmental laws and encourages the adoption of green chemistry practices. By 2023, approximately IDR 3 trillion (around USD 210 million) has been earmarked to support compliance initiatives and enhance safety regulations. This regulatory environment aims to balance industrial growth with environmental protection, ensuring that chemical manufacturers can operate sustainably while contributing to the economy.
Indonesia Basic Chemicals Market Segmentation
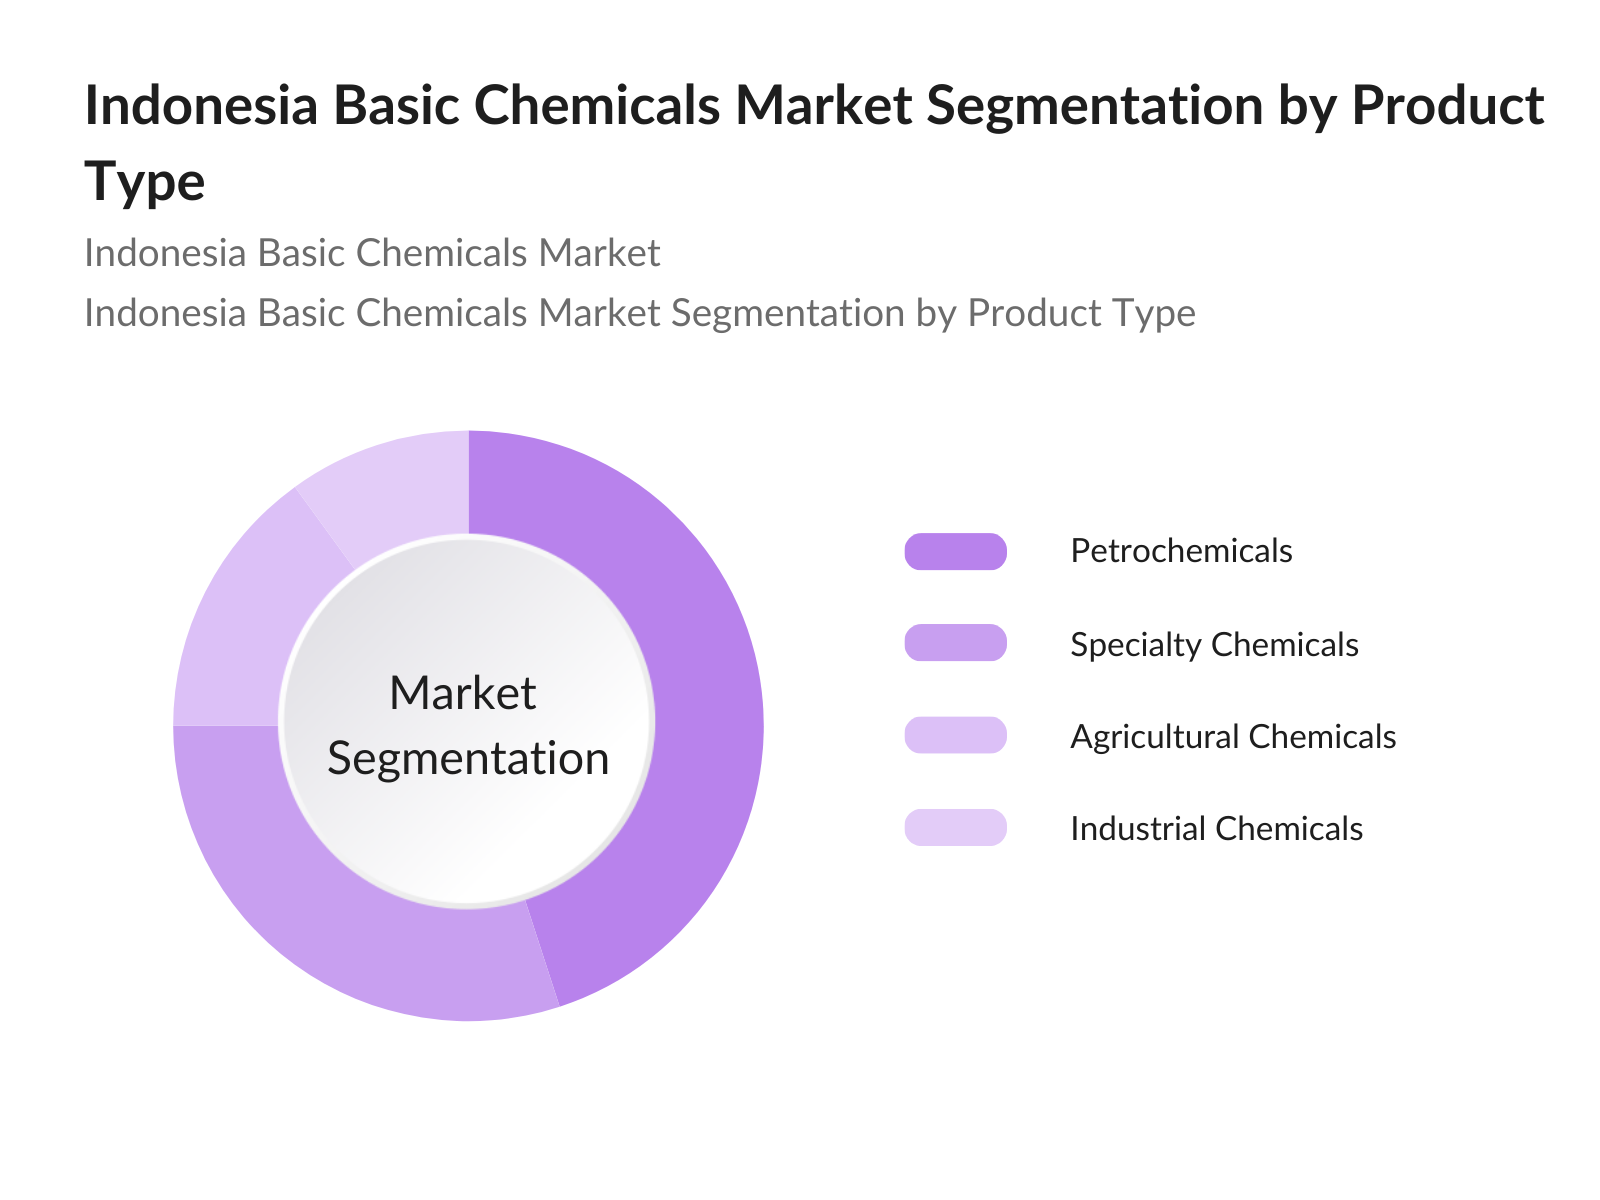
By Product Type: The Indonesia basic chemicals market is segmented by product type into petrochemicals, specialty chemicals, agricultural chemicals, and industrial chemicals. Currently, petrochemicals dominate the market share due to their widespread applications in plastics, textiles, and pharmaceuticals. The extensive usage of petrochemical derivatives in various industries drives this segment's growth, with companies increasingly investing in advanced technologies to enhance production efficiency. Furthermore, Indonesia's strategic location and established supply chains further solidify the dominance of petrochemicals in the market.
By Application: The market is also segmented by application, including plastics and polymers, pharmaceuticals, agrochemicals, and paints and coatings. The plastics and polymers segment currently holds the largest market share, primarily due to the increasing demand for packaging materials, consumer goods, and automotive components. The rise of e-commerce and retail sectors has significantly boosted the need for durable and versatile plastic products, leading to a surge in production. Additionally, ongoing innovations in polymer technology are driving the growth of this segment, as manufacturers seek to meet diverse consumer demands.

Indonesia Basic Chemicals Market Competitive Landscape
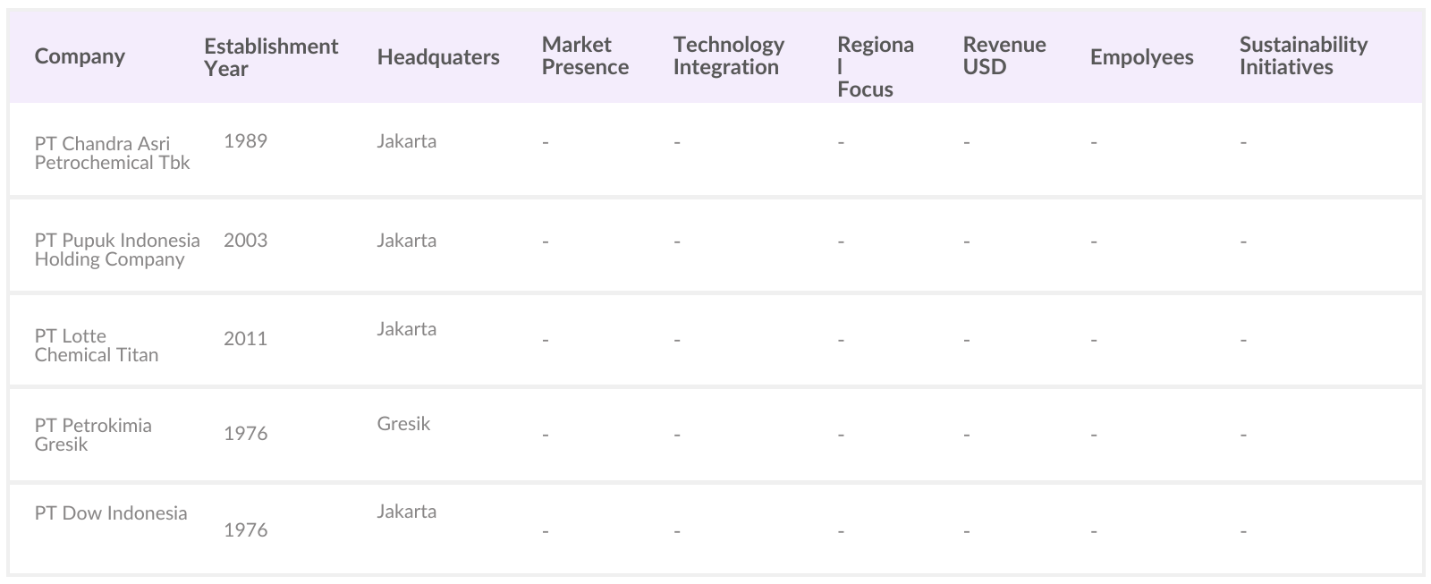
The Indonesian basic chemicals market is characterized by a competitive landscape featuring several major players. Companies like PT Chandra Asri Petrochemical Tbk, PT Pupuk Indonesia Holding Company, and PT Lotte Chemical Titan dominate the market, highlighting the significant influence of both local and international manufacturers. This concentration of established firms allows for better economies of scale and operational efficiencies, ensuring that they maintain a competitive edge in the rapidly evolving market.
Indonesia Basic Chemicals Market Analysis
Market Growth Drivers
- Industrial Growth and Demand Indonesia's industrial sector has shown robust growth, driven by a strong manufacturing base and the government's focus on infrastructure development. In 2022, the manufacturing sector contributed IDR 2,880 trillion (around USD 195 billion) to the country's GDP, reflecting a continued demand for basic chemicals as essential inputs. The Indonesian government has allocated approximately IDR 412 trillion (around USD 28.8 billion) for infrastructure projects in 2023, further stimulating industrial demand. Additionally, the automotive industry is projected to produce over 1.2 million vehicles in 2023, while the construction sector is expected to grow significantly, which will further increase the consumption of basic chemicals as critical inputs in these industries.
- Government Initiatives and Policies: The Indonesian government has implemented various initiatives to enhance the chemical industrys competitiveness. The National Medium-Term Development Plan (RPJMN) emphasizes improving chemical production efficiency and expanding the value chain. The governments commitment to increasing investment in the chemical sector is evident, with an estimated USD 10 billion earmarked for chemical infrastructure development. Furthermore, Indonesia's strategic location in Southeast Asia provides an advantage in accessing regional markets, facilitating trade and investment opportunities that bolster domestic chemical production.
- Increasing Export Opportunities: Indonesia's chemical exports have been on an upward trajectory, with the country exporting USD 14.5 billion worth of chemicals in 2022. The government's focus on trade agreements, such as the Regional Comprehensive Economic Partnership (RCEP), aims to expand market access for Indonesian chemicals. Additionally, the countrys natural resource abundance, including palm oil and coal, supports the production of various chemical derivatives, positioning Indonesia as a competitive player in the global market. This growth in export potential is crucial for driving the domestic basic chemicals market forward.
Market Challenges:
- Environmental Regulations: Indonesia faces significant environmental regulations that challenge the basic chemicals market. The government has intensified efforts to enforce stricter environmental laws, including the Environmental Protection Law and the Job Creation Law, aimed at minimizing environmental impact. Compliance costs for chemical manufacturers are expected to increase, with businesses needing to invest an estimated IDR 5 trillion (around USD 350 million) to upgrade their facilities to meet these standards. These regulations can hinder production capabilities and profitability in the short term, affecting the overall market landscape.
- Volatility in Raw Material Prices: The basic chemicals market in Indonesia is susceptible to raw material price fluctuations, significantly impacting production costs. In 2022, the price of naphtha, a key feedstock for chemical production, averaged USD 640 per metric ton, influenced by global supply chain disruptions and geopolitical tensions. Additionally, the price of palm oil, a major raw material for biodiesel production, surged to USD 1,050 per metric ton in early 2023 due to increased demand and export restrictions. Such volatility creates uncertainties for manufacturers and can lead to higher prices for end consumers, straining market dynamics.
Indonesia Basic Chemicals Market Future Outlook
The future outlook for the Indonesia basic chemicals market is promising, driven by increasing domestic consumption, rising industrial activities, and supportive government policies promoting the chemical sector. Over the next five years, the market is expected to witness significant growth as industries adapt to evolving consumer preferences and invest in sustainable production practices. The governments focus on infrastructure development and the push towards renewable and eco-friendly chemicals will likely further bolster market expansion.
Market Opportunities:
- Advancements in Production Technologies: The basic chemicals sector in Indonesia is poised for growth due to advancements in production technologies. Companies are increasingly adopting automation and digital technologies, which can enhance production efficiency and reduce operational costs. The Indonesian government has invested IDR 8 trillion (approximately USD 560 million) in upgrading manufacturing technologies. This investment is anticipated to lead to significant productivity gains, positioning the industry for sustainable growth and increasing competitiveness in the global market.
- Sustainable Practices and Green Chemistry: There is a growing trend toward sustainable practices and green chemistry within Indonesias basic chemicals market. With global demand for sustainable products increasing, Indonesian manufacturers are exploring bio-based alternatives to traditional petrochemical products. In 2022, investments in sustainable chemical projects reached IDR 7 trillion (around USD 490 million), with expectations of rising as environmental concerns gain prominence.
Scope of the Report
|
By Product Type |
Petrochemicals Specialty Chemicals Agricultural Chemicals Industrial Chemicals |
|
By Application |
Plastics and Polymers Pharmaceuticals Agrochemicals Paints and Coatings |
|
By End-User Industry |
Automotive Construction Consumer Goods Electronics |
|
By Distribution Channel |
Direct Sales Distributors E-commerce Retail Export/Import |
|
By Region |
North-East Midwest West Coast Southern States |
Products
Key Target Audience
Investments and Venture Capitalist Firms
Government and Regulatory Bodies (Ministry of Industry, Ministry of Environment and Forestry)
Large Scale Manufacturers
Importers and Distributors of Chemicals
Research and Development Departments
Environmental Organizations
Trade Associations (Indonesian Chemical Industry Association)
Retail Chains
Companies
Players Mention in the Report
PT Chandra Asri Petrochemical Tbk
PT Pupuk Indonesia Holding Company
PT Lotte Chemical Titan
PT Petrokimia Gresik
PT Dow Indonesia
PT Asahimas Flat Glass Tbk
PT Indo Acidatama Tbk
PT Mitsubishi Chemical Indonesia
PT BASF Indonesia
PT Haldor Topsoe
PT Kemira
PT ExxonMobil Lubricants Indonesia
PT Sanofi Aventis Indonesia
PT Brunei Shell Petroleum
PT Thermo Fisher Scientific
Table of Contents
01. Indonesia Basic Chemicals Market Overview
1.1. Definition and Scope
1.2. Market Taxonomy
1.3. Market Growth Rate
1.4. Market Segmentation Overview
02. Indonesia Basic Chemicals Market Size (In USD Bn)
2.1. Historical Market Size
2.2. Year-On-Year Growth Analysis
2.3. Key Market Developments and Milestones
03. Indonesia Basic Chemicals Market Analysis
3.1. Growth Drivers
3.1.1. Industrial Growth and Demand
3.1.2. Government Initiatives and Policies
3.1.3. Increasing Export Opportunities
3.1.4. Rise in Consumer Demand for Chemical Products
3.2. Market Challenges
3.2.1. Environmental Regulations
3.2.2. Volatility in Raw Material Prices
3.2.3. Supply Chain Disruptions
3.3. Opportunities
3.3.1. Advancements in Production Technologies
3.3.2. Sustainable Practices and Green Chemistry
3.3.3. Growing Demand in Emerging Industries
3.4. Trends
3.4.1. Shift Towards Bio-based Chemicals
3.4.2. Digital Transformation in Manufacturing
3.4.3. Increased Investment in R&D
3.5. Government Regulation
3.5.1. National Chemical Policy Framework
3.5.2. Compliance Standards for Chemical Safety
3.5.3. Environmental Impact Assessments
3.6. SWOT Analysis
3.7. Stake Ecosystem
3.8. Porters Five Forces
3.9. Competition Ecosystem
04. Indonesia Basic Chemicals Market Segmentation
4.1. By Product Type (In Value %)
4.1.1. Petrochemicals
4.1.2. Specialty Chemicals
4.1.3. Agricultural Chemicals
4.1.4. Industrial Chemicals
4.2. By Application (In Value %)
4.2.1. Plastics and Polymers
4.2.2. Pharmaceuticals
4.2.3. Agrochemicals
4.2.4. Paints and Coatings
4.3. By End-User Industry (In Value %)
4.3.1. Automotive
4.3.2. Construction
4.3.3. Consumer Goods
4.3.4. Electronics
4.4. By Region (In Value %)
4.4.1. Java
4.4.2. Sumatra
4.4.3. Kalimantan
4.4.4. Sulawesi
4.4.5. Bali and Nusa Tenggara
05. Indonesia Basic Chemicals Market Competitive Analysis
5.1. Detailed Profiles of Major Companies
5.1.1. PT. Chandra Asri Petrochemical Tbk
5.1.2. PT. Lotte Chemical Titan
5.1.3. PT. Pupuk Indonesia Holding Company
5.1.4. PT. Petrokimia Gresik
5.1.5. PT. Asahimas Flat Glass Tbk
5.1.6. PT. Dow Indonesia
5.1.7. PT. Indo Acidatama Tbk
5.1.8. PT. Brunei Shell Petroleum
5.1.9. PT. BASF Indonesia
5.1.10. PT. Mitsubishi Chemical Indonesia
5.1.11. PT. ExxonMobil Lubricants Indonesia
5.1.12. PT. Haldor Topsoe
5.1.13. PT. Kemira
5.1.14. PT. Sanofi Aventis Indonesia
5.1.15. PT. Sidomuncul
5.2. Cross Comparison Parameters (Revenue, Market Share, Geographical Presence, Product Portfolio, R&D Investment, Manufacturing Capacity, Customer Base, Sustainability Initiatives)
5.3. Market Share Analysis
5.4. Strategic Initiatives
5.5. Mergers and Acquisitions
5.6. Investment Analysis
5.7. Venture Capital Funding
5.8. Government Grants
5.9. Private Equity Investments
06. Indonesia Basic Chemicals Market Regulatory Framework
6.1. Environmental Standards
6.2. Compliance Requirements
6.3. Certification Processes
07. Indonesia Basic Chemicals Market Future Size (In USD Bn)
7.1. Future Market Size Projections
7.2. Key Factors Driving Future Market Growth
08. Indonesia Basic Chemicals Market Future Segmentation
8.1. By Product Type (In Value %)
8.2. By Application (In Value %)
8.3. By End-User Industry (In Value %)
8.4. By Region (In Value %)
09. Indonesia Basic Chemicals Market Analysts Recommendations
9.1. TAM/SAM/SOM Analysis
9.2. Customer Cohort Analysis
9.3. Marketing Initiatives
9.4. White Space Opportunity Analysis
Disclaimer
Contact Us
Research Methodology
Step 1: Identification of Key Variables
The initial phase involves constructing an ecosystem map encompassing all major stakeholders within the Indonesia basic chemicals market. This step relies on extensive desk research, utilizing a combination of secondary and proprietary databases to gather comprehensive industry-level information. The primary objective is to identify and define the critical variables that influence market dynamics.
Step 2: Market Analysis and Construction
In this phase, we compile and analyze historical data pertaining to the Indonesia basic chemicals market. This includes assessing market penetration, the ratio of marketplaces to service providers, and the resultant revenue generation. Furthermore, an evaluation of service quality statistics will be conducted to ensure the reliability and accuracy of the revenue estimates.
Step 3: Hypothesis Validation and Expert Consultation
Market hypotheses are developed and subsequently validated through computer-assisted telephone interviews (CATIs) with industry experts representing a diverse array of companies. These consultations provide valuable operational and financial insights directly from industry practitioners, which are instrumental in refining and corroborating the market data.
Step 4: Research Synthesis and Final Output
The final phase involves direct engagement with multiple manufacturers and stakeholders in the basic chemicals sector to acquire detailed insights into product segments, sales performance, consumer preferences, and other pertinent factors. This interaction serves to verify and complement the statistics derived from the bottom-up approach, ensuring a comprehensive, accurate, and validated analysis of the Indonesia basic chemicals market.
Frequently Asked Questions
01. How big is the Indonesia Basic Chemicals Market?
The Indonesia basic chemicals market is valued at USD 21.65 billion, driven by robust industrial growth and increasing demand for chemical products across various sectors.
02. What are the challenges in the Indonesia Basic Chemicals Market?
Challenges include stringent environmental regulations, fluctuating raw material prices, and potential supply chain disruptions that can impact production and distribution efficiency.
03. Who are the major players in the Indonesia Basic Chemicals Market?
Key players include PT Chandra Asri Petrochemical Tbk, PT Pupuk Indonesia Holding Company, and PT Lotte Chemical Titan, which dominate due to their extensive production capabilities and established market presence.
04. What are the growth drivers of the Indonesia Basic Chemicals Market?
The market is propelled by factors such as increasing domestic consumption, government support for industrial activities, and advancements in chemical manufacturing technologies.
Why Buy From Us?
 Framework")
What makes us stand out is that our consultants follows Robust, Refine and Result (RRR) methodology. i.e. Robust for clear definitions, approaches and sanity checking, Refine for differentiating respondents facts and opinions and Result for presenting data with story

We have set a benchmark in the industry by offering our clients with syndicated and customized market research reports featuring coverage of entire market as well as meticulous research and analyst insights.

While we don't replace traditional research, we flip the method upside down. Our dual approach of Top Bottom & Bottom Top ensures quality deliverable by not just verifying company fundamentals but also looking at the sector and macroeconomic factors.

With one step in the future, our research team constantly tries to show you the bigger picture. We help with some of the tough questions you may encounter along the way: How is the industry positioned? Best marketing channel? KPI's of competitors? By aligning every element, we help maximize success.

Our report gives you instant access to the answers and sources that other companies might choose to hide. We elaborate each steps of research methodology we have used and showcase you the sample size to earn your trust.

If you need any support, we are here! We pride ourselves on universe strength, data quality, and quick, friendly, and professional service.