
Indonesia Contact Lenses Market Outlook to 2030
Region:Asia
Author(s):Naman Rohilla
Product Code:KROD3579
November 2024
95
About the Report
Indonesia Contact Lenses Market Overview
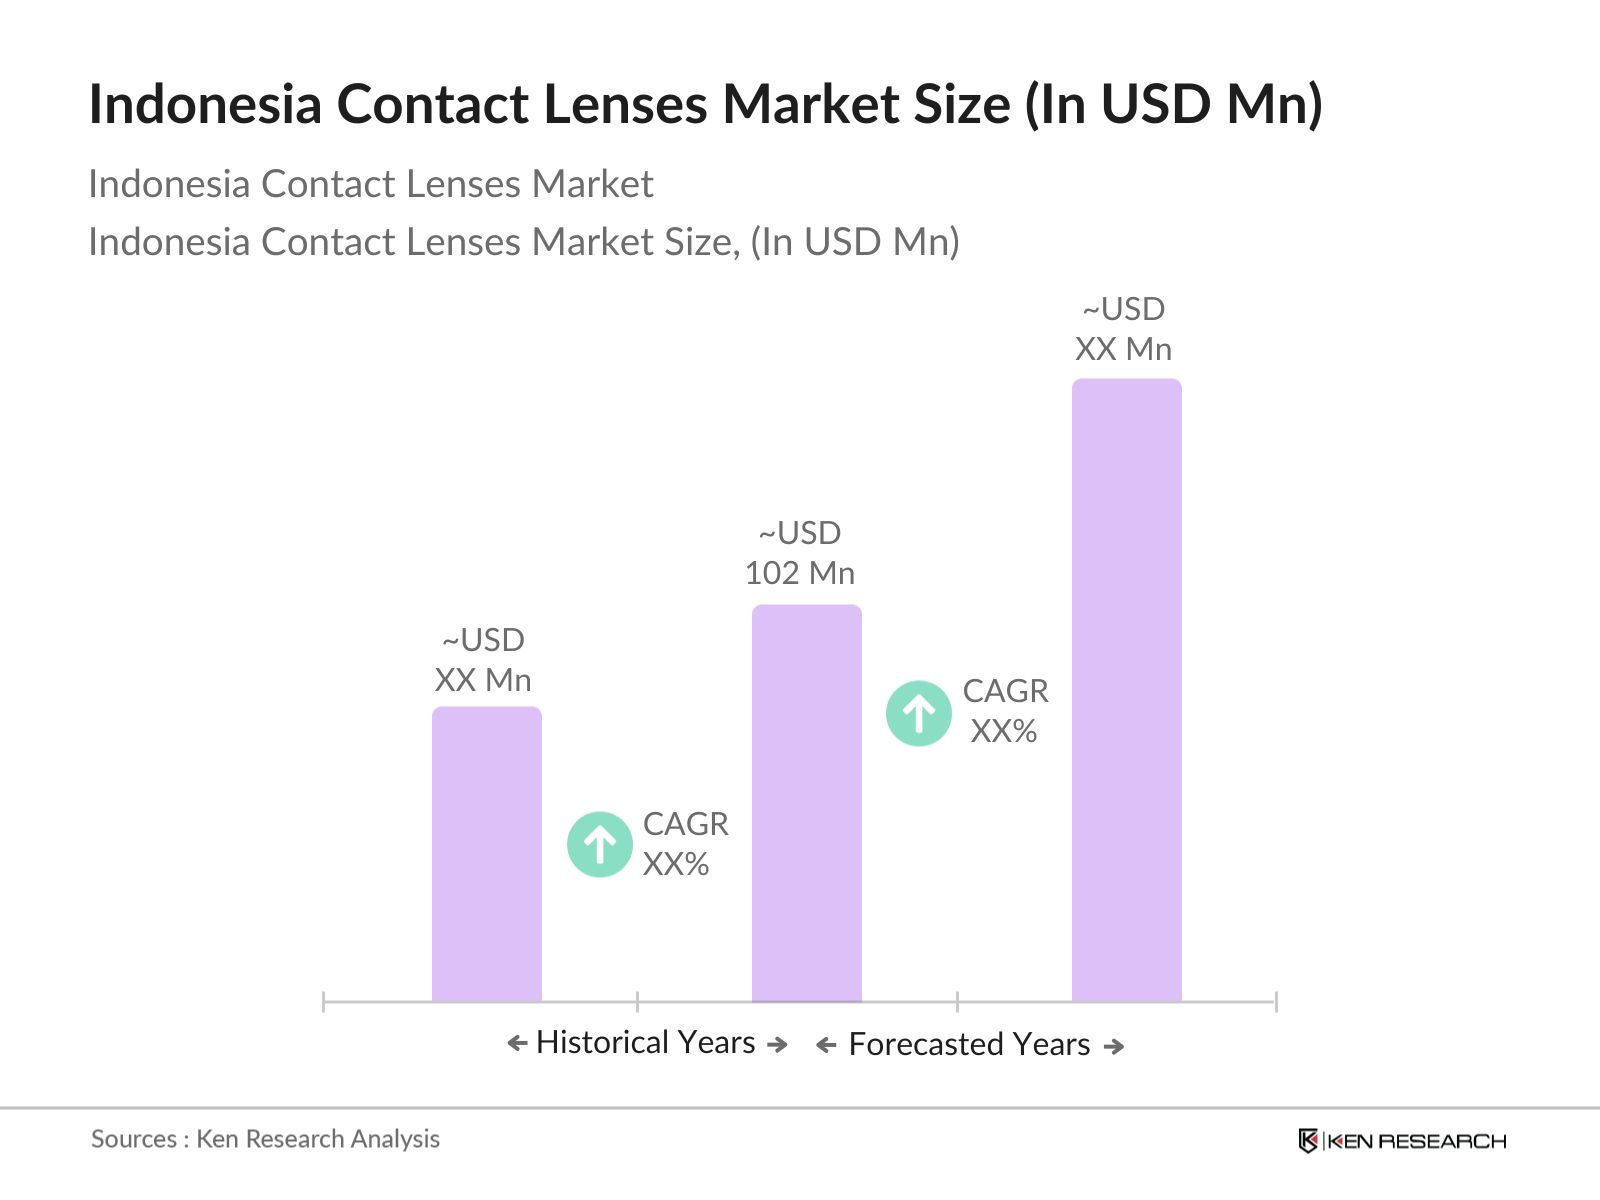
- The Indonesia Contact Lenses market is valued at USD 102 million, based on a five-year historical analysis. This market is driven by the rising prevalence of vision impairments, urbanization, and increasing disposable income, especially in urban areas. The demand for advanced contact lenses, including those made of breathable materials and daily disposable variants, has influenced market growth. The rise in awareness of eye care and the convenience offered by disposable lenses has made them the preferred choice among consumers, particularly the younger population in metropolitan areas.
- Cities such as Jakarta, Surabaya, and Medan dominate the contact lens market in Indonesia. These urban centres have higher disposable incomes, more developed healthcare infrastructure, and a growing trend towards cosmetic enhancement, driving demand for cosmetic contact lenses. Additionally, the rapid growth of e-commerce in these regions has further facilitated easy access to a wide range of contact lens products, boosting market penetration.
- The Indonesian Ministry of Health has set specific guidelines for the sale and use of vision correction devices, including contact lenses. These guidelines emphasize the importance of product safety, user education, and proper usage instructions to minimize health risks. Contact lenses must meet certain quality standards before they are approved for sale. Furthermore, health professionals are required to provide detailed instructions to users on how to properly care for and wear lenses. These guidelines are strictly enforced, ensuring that products sold in the market adhere to safety regulations.
Indonesia Contact Lenses Market Segmentation
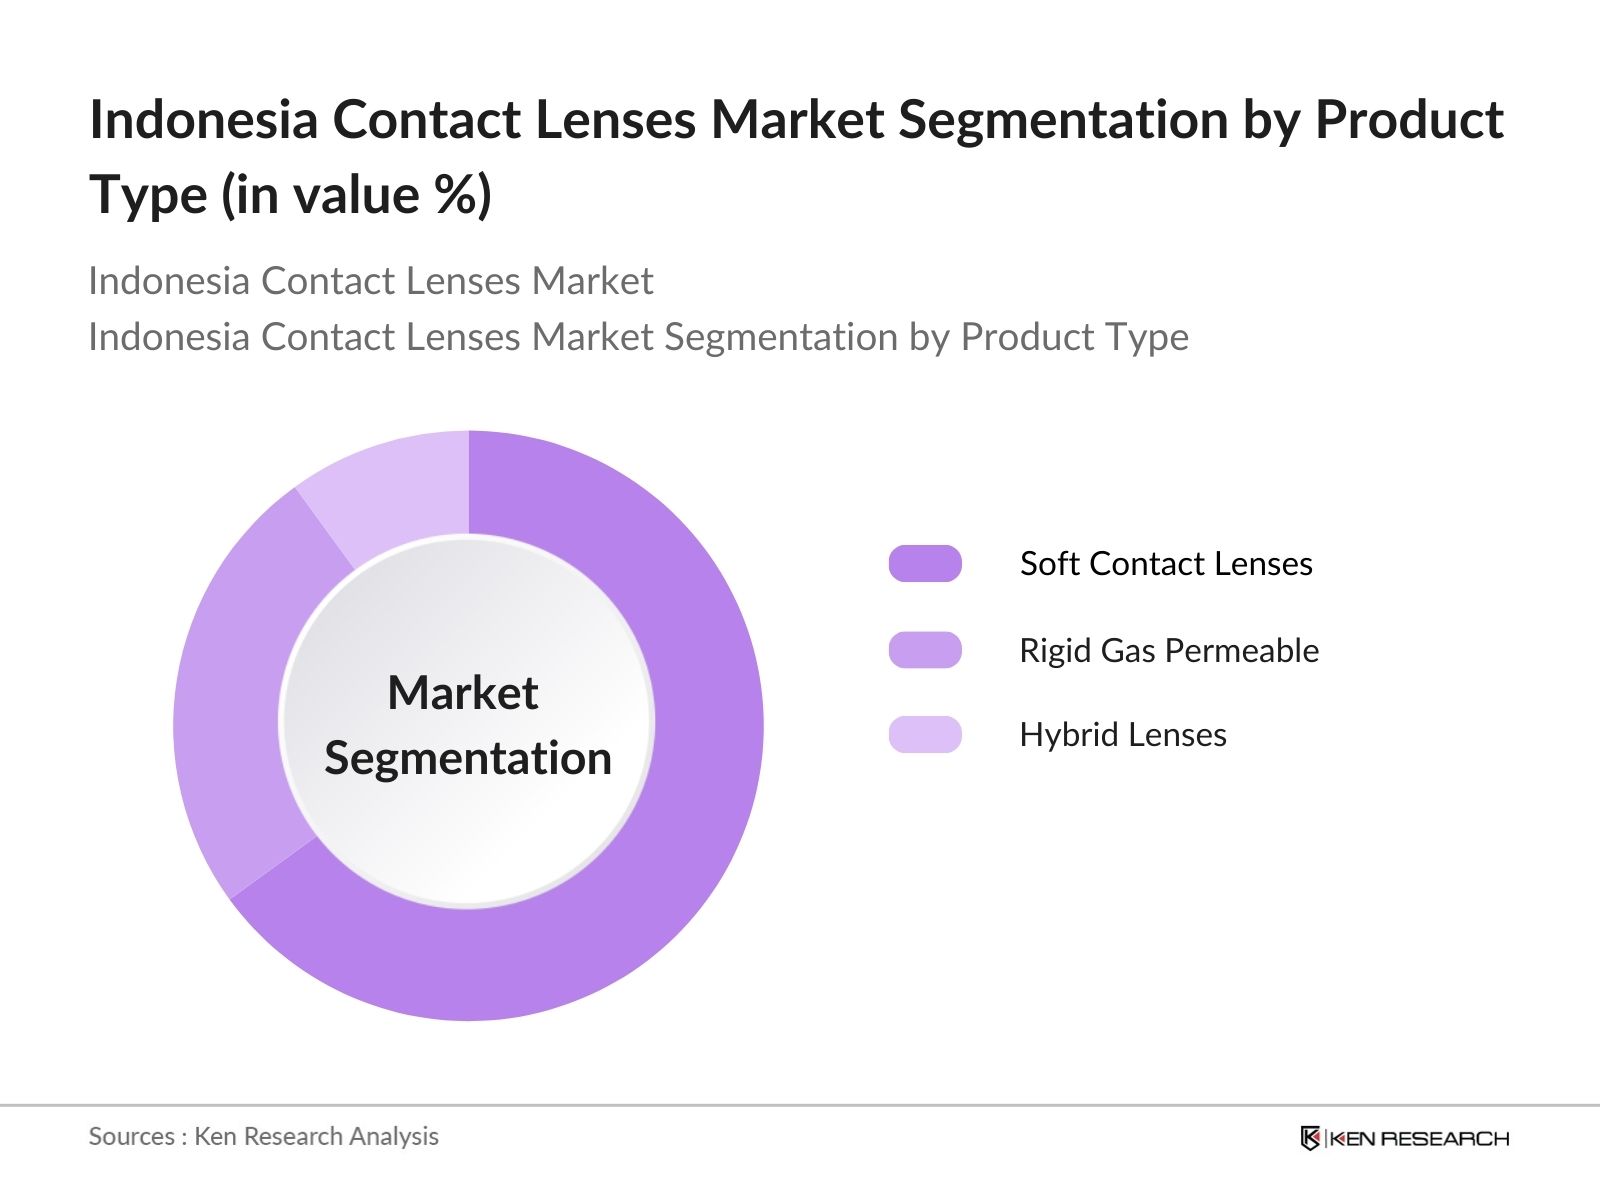
- By Product Type: The Indonesia Contact Lenses market is segmented by product type into soft contact lenses, rigid gas permeable (RGP) lenses, and hybrid lenses. Soft contact lenses dominate the market, with a market share of 65% in 2023. This dominance is primarily due to their comfort, affordability, and flexibility in usage for both corrective and cosmetic purposes. Soft lenses are particularly favored for daily and extended wear, making them an ideal choice for a large portion of the population.
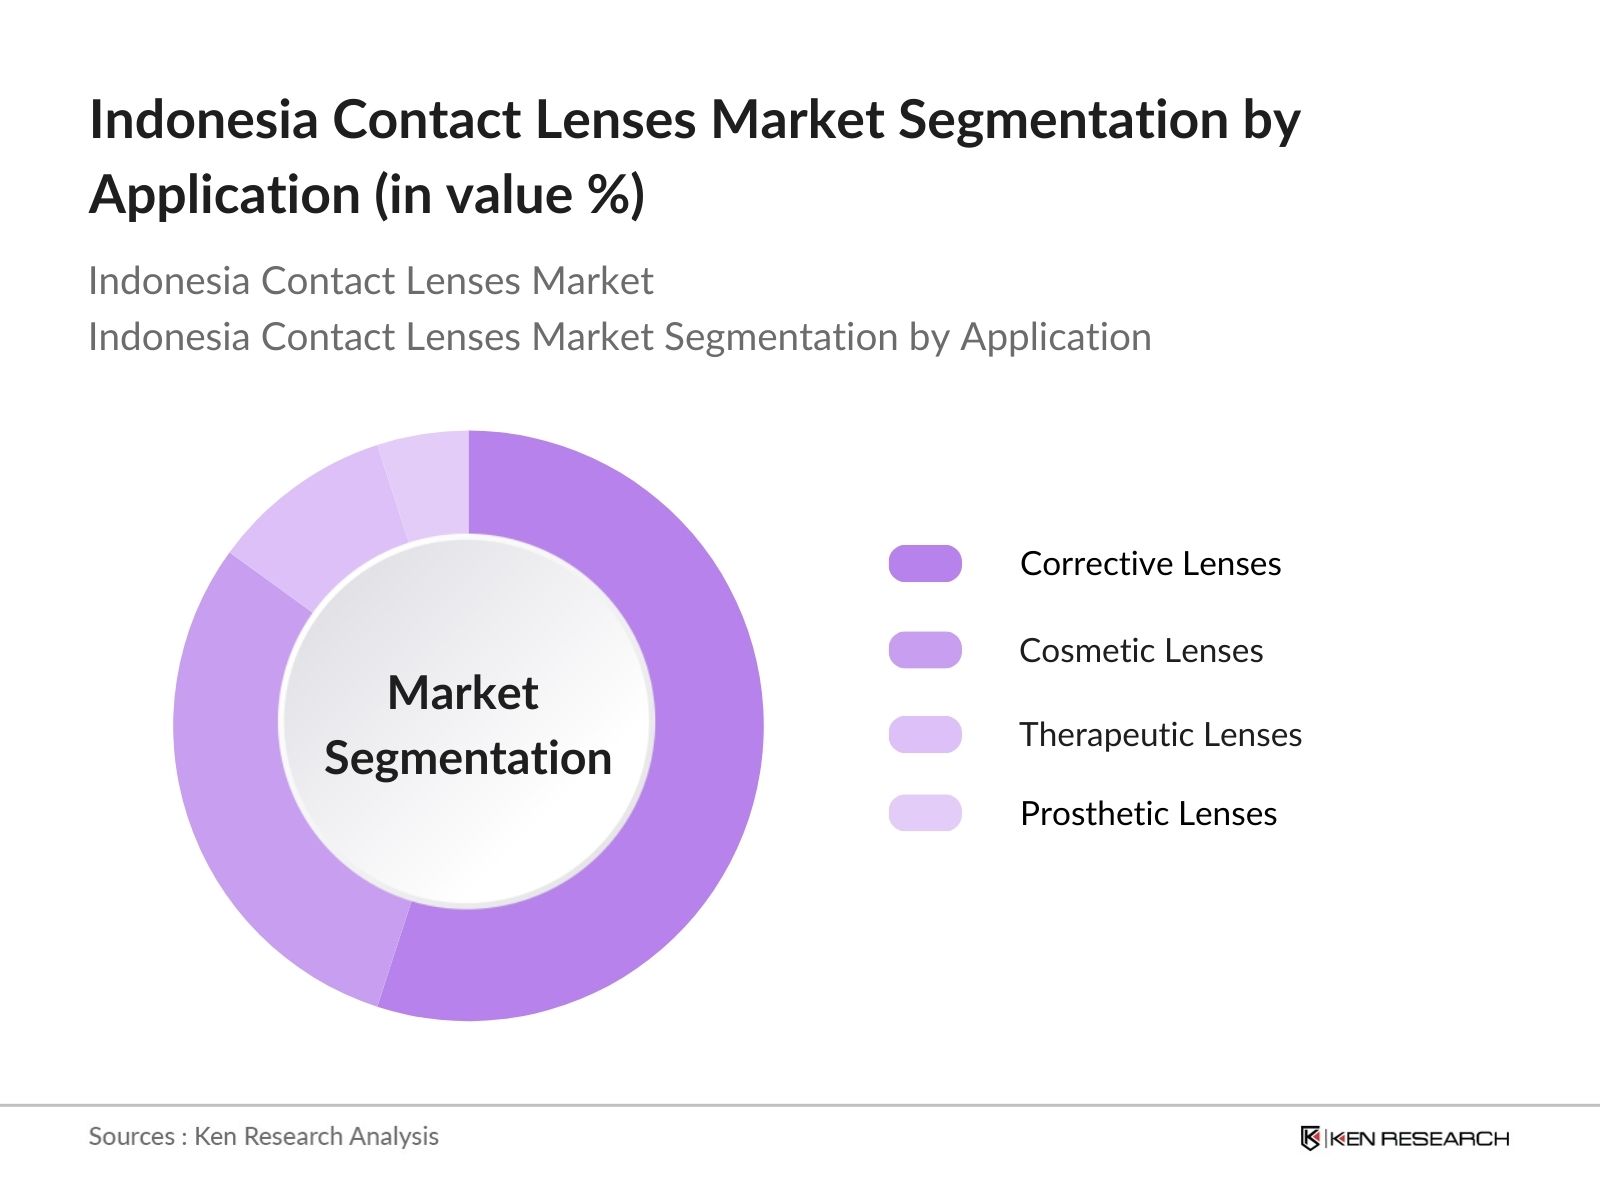
- By Application: The market is further segmented by application into corrective lenses, cosmetic lenses, therapeutic lenses, and prosthetic lenses. Corrective lenses dominate this segment, accounting for 55% of the market share in 2023. The dominance of corrective lenses is driven by the increasing prevalence of myopia and astigmatism, particularly among younger populations due to increased screen time and poor eye health practices. The preference for lenses over traditional glasses, owing to aesthetic and convenience factors, further boosts this segment.
Indonesia Contact Lenses Market Competitive Landscape
The Indonesia Contact Lenses market is dominated by several major players, including multinational corporations and local brands. The competitive landscape highlights the dominance of a few large companies that have established a strong presence through extensive product portfolios and innovations in contact lens technology.
|
Company Name |
Year of Establishment |
Headquarters |
Lens Material Expertise |
Online Presence |
Regional Reach |
Product Portfolio |
Technological Innovation |
Revenue (USD Million) |
Manufacturing Capability |
|
Johnson & Johnson Vision |
1886 |
New Jersey, USA |
- |
- |
- |
- |
- |
- |
- |
|
CooperVision |
1980 |
Pleasanton, USA |
- |
- |
- |
- |
- |
- |
- |
|
Bausch + Lomb |
1853 |
Rochester, USA |
- |
- |
- |
- |
- |
- |
- |
|
Alcon (Novartis) |
1945 |
Geneva, Switzerland |
- |
- |
- |
- |
- |
- |
- |
|
Menicon Co., Ltd. |
1951 |
Nagoya, Japan |
- |
- |
- |
- |
- |
- |
- |
Indonesia Contact Lenses Market Analysis
Indonesia Contact Lenses Market Growth Drivers
- Increasing Urbanization: Indonesia's urban population has been steadily growing, with the World Bank reporting that over 57% of the population now resides in urban areas. This shift has resulted in higher demand for contact lenses, particularly among working professionals and students who require vision correction solutions. The convenience of contact lenses is a key factor driving this demand. Jakarta, Surabaya, and other major cities have seen increased adoption due to lifestyle changes and the need for more flexible eyewear. Urbanization continues to drive market growth as more people move to cities, raising awareness and availability of these products.
- Rising Prevalence of Vision Disorders: The rise in vision disorders is a driver for Indonesia's contact lens market. The Indonesian Ministry of Health estimates that approximately 10 million people in the country suffer from various types of refractive errors, such as myopia and hyperopia. The increasing screen time due to the use of digital devices is one of the main causes of this rise in eye disorders. As a result, the demand for vision correction devices, particularly contact lenses, is escalating. The availability of advanced lenses offering improved comfort has further enhanced market adoption.
- Growth of E-commerce in Eyewear: The growth of e-commerce has impacted the distribution of contact lenses in Indonesia. The Indonesian E-Commerce Association (idEA) reported a growth in online transactions, with more than 200 million internet users in the country contributing to the expansion of digital sales platforms. The ease of access to a wide range of contact lenses, combined with attractive discounts and faster delivery services, has encouraged consumers to purchase eyewear online. E-commerce platforms like Tokopedia and Shopee have become key distribution channels for contact lenses.
Indonesia Contact Lenses Market Challenges
- High Product Costs: One of the primary challenges facing the Indonesian contact lenses market is the high cost of lenses, especially for premium brands and advanced technologies. The average cost of contact lenses in Indonesia is considerably higher compared to traditional spectacles. The Indonesian Consumer Protection Foundation (YLKI) has highlighted the price disparity between imported and locally manufactured lenses, which can limit accessibility for middle- to lower-income consumers. Affordability remains a critical concern, particularly as the majority of the population earns less than USD 300 per month.
- Limited Awareness in Rural Areas: While urban areas see a growing adoption of contact lenses, rural regions remain underserved due to limited awareness and access. According to the Indonesian Statistics Bureau (BPS), nearly 43% of Indonesias population resides in rural areas, where contact lenses are rarely used due to a lack of education on vision correction alternatives. Rural healthcare infrastructure is also underdeveloped, with fewer eye care professionals available, making access to optometry services difficult. Efforts to expand awareness and availability in these regions remain a major challenge for market players.
Indonesia Contact Lenses Market Future Outlook
Over the next five years, the Indonesia Contact Lenses market is expected to show growth, driven by the rising demand for cosmetic lenses, increased digitalization of retail channels, and a growing middle-class population. The market is also expected to witness advancements in smart contact lenses and innovative lens materials, such as silicone hydrogel, which enhance wearer comfort. Moreover, the government's focus on improving eye health awareness, coupled with the rising availability of affordable lenses, is likely to propel the market forward.
Indonesia Contact Lenses Market Opportunities
- Growing Demand for Cosmetic Contact Lenses: Cosmetic contact lenses have gained popularity in Indonesia, especially among the younger population. The demand for color-changing and fashion lenses has surged, with the Indonesian Fashion Designers Association (APPMI) noting that these lenses are often used in conjunction with beauty and fashion trends. The rise of influencers on social media platforms like Instagram and TikTok has further fueled interest in cosmetic lenses. This trend represents a key opportunity for brands to expand their product lines and cater to fashion-conscious consumers.
- Increasing Penetration of Online Sales Channels: With the expansion of internet access across Indonesia, particularly in second-tier cities, the penetration of online sales channels continues to grow. The Indonesian Ministry of Communications and Information Technology reports that over 70% of the population now has access to the internet, enabling more consumers to shop online for contact lenses. The convenience of online shopping, coupled with the availability of customer reviews and price comparisons, presents an opportunity for eyewear companies to tap into a wider audience through digital channels
Scope of the Report
|
Product Type |
Soft Contact Lenses Rigid Gas Permeable (RGP) Lenses Hybrid Lenses |
|
Usage Type |
Daily Disposable Weekly Disposable Monthly Disposable |
|
Distribution Channel |
Retail Stores Online Stores Optical Chains |
|
Application |
Corrective Lenses Therapeutic Lenses Cosmetic Lenses Prosthetic Lenses |
|
Region |
Java Sumatra Kalimantan Sulawesi Bali |
Products
Key Target Audience
Ophthalmologists and Optometrists
Hospitals and Eye Care Clinics
Optical Chains and Retailers
E-commerce Platforms and Online Retailers
Medical Device Distributors
Manufacturers of Contact Lenses
Investments and Venture Capitalist Firms
Government and Regulatory Bodies (Indonesian Ministry of Health, BPOM)
Companies
Indonesia Contact Lenses Market Major Players
Johnson & Johnson Vision
CooperVision
Bausch + Lomb
Alcon (Novartis)
Menicon Co., Ltd.
Hoya Corporation
Carl Zeiss AG
Seed Co., Ltd.
Essilor International
UltraVision CLPL
SynergEyes, Inc.
X-Cel Specialty Contacts
Neo Vision Co. Ltd.
Ginko International Co. Ltd.
Shanghai Hydron Contact Lens Co. Ltd.
Table of Contents
1. Indonesia Contact Lenses Market Overview
1.1. Definition and Scope
1.2. Market Taxonomy
1.3. Market Growth Rate
1.4. Market Segmentation Overview
2. Indonesia Contact Lenses Market Size (In USD Bn)
2.1. Historical Market Size
2.2. Year-On-Year Growth Analysis
2.3. Key Market Developments and Milestones
3. Indonesia Contact Lenses Market Analysis
3.1. Growth Drivers
3.1.1. Increasing Urbanization
3.1.2. Rising Prevalence of Vision Disorders
3.1.3. Growth of E-commerce in Eyewear
3.1.4. Technological Advancements in Lens Material
3.2. Market Challenges
3.2.1. High Product Costs
3.2.2. Limited Awareness in Rural Areas
3.2.3. Stringent Government Regulations
3.3. Opportunities
3.3.1. Growing Demand for Cosmetic Contact Lenses
3.3.2. Increasing Penetration of Online Sales Channels
3.3.3. Expanding Disposable Income in Urban Areas
3.4. Trends
3.4.1. Rising Preference for Daily Disposable Contact Lenses
3.4.2. Growth in Smart Contact Lens Technology
3.4.3. Customization of Contact Lenses
3.5. Government Regulation
3.5.1. Health Ministry Guidelines on Vision Correction Devices
3.5.2. Import Regulations on Medical Devices
3.5.3. Standards for Contact Lens Manufacturing
3.6. SWOT Analysis
3.7. Stakeholder Ecosystem
3.8. Porters Five Forces Analysis
3.9. Competition Ecosystem
4. Indonesia Contact Lenses Market Segmentation
4.1. By Product Type (In Value %)
4.1.1. Soft Contact Lenses
4.1.2. Rigid Gas Permeable (RGP) Lenses
4.1.3. Hybrid Lenses
4.2. By Usage Type (In Value %)
4.2.1. Daily Disposable
4.2.2. Weekly Disposable
4.2.3. Monthly Disposable
4.3. By Distribution Channel (In Value %)
4.3.1. Retail Stores
4.3.2. Online Stores
4.3.3. Optical Chains
4.4. By Application (In Value %)
4.4.1. Corrective Lenses
4.4.2. Therapeutic Lenses
4.4.3. Cosmetic Lenses
4.4.4. Prosthetic Lenses
4.5. By Region (In Value %)
4.5.1. Java
4.5.2. Sumatra
4.5.3. Kalimantan
4.5.4. Sulawesi
4.5.5. Bali
5. Indonesia Contact Lenses Market Competitive Analysis
5.1. Detailed Profiles of Major Companies
5.1.1. Johnson & Johnson
5.1.2. CooperVision
5.1.3. Bausch + Lomb
5.1.4. Alcon (Novartis)
5.1.5. Menicon Co. Ltd.
5.1.6. Hoya Corporation
5.1.7. Carl Zeiss AG
5.1.8. Seed Co., Ltd.
5.1.9. Essilor International
5.1.10. UltraVision CLPL
5.1.11. SynergEyes, Inc.
5.1.12. X-Cel Specialty Contacts
5.1.13. Neo Vision Co. Ltd.
5.1.14. Ginko International Co. Ltd.
5.1.15. Shanghai Hydron Contact Lens Co. Ltd.
5.2. Cross Comparison Parameters (Lens Material, Product Portfolio, Production Capacity, Global Reach, Revenue Contribution by Region, Online Penetration, Innovation Capability, Regulatory Compliance)
5.3. Market Share Analysis
5.4. Strategic Initiatives
5.5. Mergers And Acquisitions
5.6. Investment Analysis
5.7. Venture Capital Funding
5.8. Government Grants
5.9. Private Equity Investments
6. Indonesia Contact Lenses Market Regulatory Framework
6.1. Health Ministry Guidelines
6.2. Licensing and Certification Requirements
6.3. Import Tariffs and Taxes on Medical Devices
7. Indonesia Contact Lenses Future Market Size (In USD Bn)
7.1. Future Market Size Projections
7.2. Key Factors Driving Future Market Growth
8. Indonesia Contact Lenses Future Market Segmentation
8.1. By Product Type (In Value %)
8.2. By Usage Type (In Value %)
8.3. By Distribution Channel (In Value %)
8.4. By Application (In Value %)
8.5. By Region (In Value %)
9. Indonesia Contact Lenses Market Analysts Recommendations
9.1. TAM/SAM/SOM Analysis
9.2. Marketing Initiatives
9.3. Customer Demographics Analysis
9.4. White Space Opportunity Analysis
Research Methodology
Step 1: Identification of Key Variables
In the initial stage, the ecosystem map for the Indonesia Contact Lenses Market was constructed, identifying major stakeholders such as manufacturers, distributors, and healthcare professionals. This stage also involved extensive desk research using credible databases, ensuring comprehensive industry-level insights. The primary objective was to define key variables influencing market dynamics, including product type, application, and market drivers.
Step 2: Market Analysis and Construction
The second stage involved analyzing historical data of the Indonesia Contact Lenses Market, evaluating penetration levels, regional dynamics, and revenue generation. This analysis enabled a clear understanding of demand shifts within different regions, applications, and product segments. Additionally, key milestones and market developments were mapped for accuracy in projections.
Step 3: Hypothesis Validation and Expert Consultation
Market hypotheses were developed and validated through consultations with industry professionals, including ophthalmologists, contact lens manufacturers, and distributors. These consultations provided in-depth financial and operational insights, refining our revenue estimates and market forecasts. Computer-assisted telephone interviews (CATIs) were used to ensure data precision and credibility.
Step 4: Research Synthesis and Final Output
In the final stage, interactions with contact lens manufacturers were conducted to gather detailed insights into product trends, sales performance, and consumer preferences. This engagement allowed for the verification of bottom-up estimates, ensuring a robust and validated market analysis.
Frequently Asked Questions
01. How big is the Indonesia Contact Lenses Market?
The Indonesia Contact Lenses Market, valued at USD 102 million in 2023, is driven by the rising prevalence of vision disorders, disposable income growth, and increasing e-commerce penetration in urban areas.
02. What are the challenges in the Indonesia Contact Lenses Market?
The Indonesia Contact Lenses Market challenges include high product costs, especially for advanced lenses, and limited awareness in rural areas, where access to optometric services and eye care products is constrained.
03. Who are the major players in the Indonesia Contact Lenses Market?
Key players in the Indonesia Contact Lenses Market include Johnson & Johnson Vision, CooperVision, Bausch + Lomb, Alcon (Novartis), and Menicon Co., Ltd., who dominate the market due to their extensive product portfolios and advanced technology.
04. What are the growth drivers of the Indonesia Contact Lenses Market?
The Indonesia Contact Lenses market is propelled by increasing urbanization, a growing middle class with disposable income, and rising awareness of eye health, particularly in the younger population with extensive digital device usage.
Why Buy From Us?
 Framework")
What makes us stand out is that our consultants follows Robust, Refine and Result (RRR) methodology. i.e. Robust for clear definitions, approaches and sanity checking, Refine for differentiating respondents facts and opinions and Result for presenting data with story

We have set a benchmark in the industry by offering our clients with syndicated and customized market research reports featuring coverage of entire market as well as meticulous research and analyst insights.

While we don't replace traditional research, we flip the method upside down. Our dual approach of Top Bottom & Bottom Top ensures quality deliverable by not just verifying company fundamentals but also looking at the sector and macroeconomic factors.

With one step in the future, our research team constantly tries to show you the bigger picture. We help with some of the tough questions you may encounter along the way: How is the industry positioned? Best marketing channel? KPI's of competitors? By aligning every element, we help maximize success.

Our report gives you instant access to the answers and sources that other companies might choose to hide. We elaborate each steps of research methodology we have used and showcase you the sample size to earn your trust.

If you need any support, we are here! We pride ourselves on universe strength, data quality, and quick, friendly, and professional service.