Join Meeting Now

Your data is secure and never shared.

Indonesia
August 2026

Indonesia Cosmetics Market Size, Share & Forecast, By Product Type, Distribution Channel & Price Tier, 2025-2032

2032

The Indonesia Cosmetics Market worth USD 9,740 million in 2025 is growing at a CAGR of 4.35% to reach USD 13,122 million by 2032. Paragon Technology and Innovation, Unilever Indonesia, L'Oréal Indonesia, Martina Berto Tbk and Mandom Indonesia Tbk are the major companies operating in this market.

Report Details

Base Year

2025

Pages

91

Region

Indonesia

Author

Ken Research

Product Code
KR-RPT-V02-09272

CHAPTER 1 - MARKET SUMMARY

Market Overview

The Indonesia Cosmetics Market operates through multinational brand subsidiaries, domestic manufacturers, contract producers, distributors, specialty retailers, pharmacies and digital marketplaces. Indonesia had more than 141.8 million women in 2025, providing a broad recurring-demand base for skincare, haircare, fragrances and color cosmetics. Product innovation and affordable pack sizes are converting demographic scale into higher purchase frequency.

Manufacturing and brand activity is concentrated around Greater Jakarta, West Java and East Java, where contract manufacturing, packaging, logistics and modern retail ecosystems are deepest. BPOM recorded 1,292 cosmetics industries by December 2024, creating a broad supplier base but intensifying competition for shelf visibility, creators and marketplace traffic. Scale increasingly depends on distribution execution rather than production access alone.

Market Value

USD 9,740 million

2025

Dominant Region

Java

2025

Dominant Segment

Skincare

fastest growing, 2025-2032

Total Number of Players

1,292

2024

Future Outlook

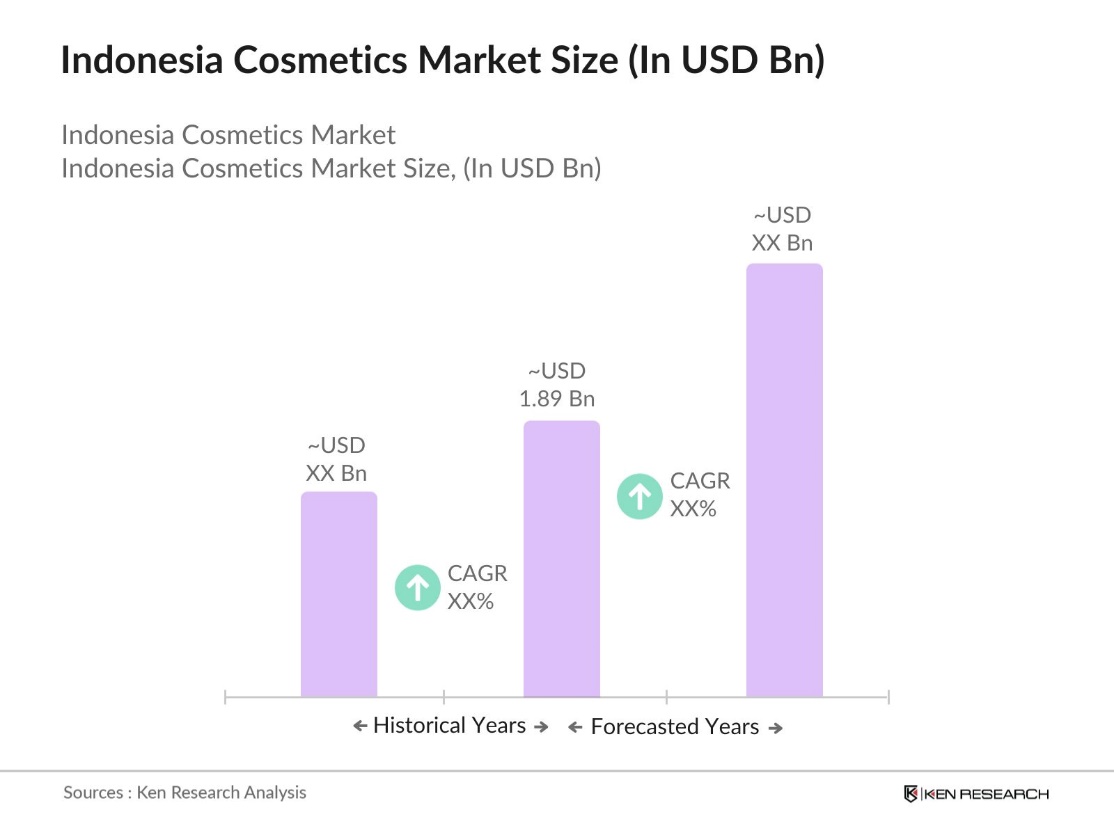
The Indonesia Cosmetics Market is projected to increase from USD 9,740 million in 2025 to USD 13,122 million by 2032, representing a 4.35% CAGR. This follows a 6.98% historical CAGR during 2020-2025, when digital commerce, post-pandemic normalization and rapid local-brand formation accelerated category spending. Growth should moderate as the market becomes larger, but skincare, sun protection, halal-certified products and digitally native brands will outperform mature mass categories. The projected value for 2031 is USD 12,575 million, maintaining a consistent transition toward higher-value routines, clinically positioned formulations and omnichannel replenishment.

Market expansion will be shaped by the interaction of demographic scale, formulation innovation, regulatory compliance and channel economics. Domestic manufacturers should benefit from shorter innovation cycles and culturally relevant claims, while multinational companies retain advantages in research, premium branding and retail execution. Online channels will gain share, although marketplace commissions, creator acquisition costs and discounting may constrain margins. Companies combining BPOM-compliant product development, halal readiness, strong repeat-purchase economics and selective offline distribution will be best placed to capture growth. The forecast assumes stable regulation, continued household consumption growth and no prolonged disruption to imported ingredients or packaging inputs.

4.35%

Forecast CAGR

$13,122 Mn

2030 Projection

Base Year

2025

Historical Period

2020-2025

Forecast Period

2025-2032

Historical CAGR

6.98%

CHAPTER 2 - SCOPE OF REPORT

Scope of the Market

Click to Explore Interactive Mind Map

CHAPTER 3 - Key Stakeholders

Key Target Audience

Key stakeholders who can leverage from this market analysis for investment, strategy, and operational planning.

Investors

CAGR, brand economics, margin, retention, regulatory risk

Corporates

innovation velocity, portfolio mix, channel productivity, pricing

Government

compliance, halal readiness, exports, SME development, safety

Operators

manufacturing utilization, formulation pipeline, quality, distribution reach

Financial institutions

working capital, brand durability, cash conversion, covenants

What You'll Gain

  • Market sizing and trajectory
  • Regulatory compliance mapping
  • Segment growth priorities
  • Competitive landscape shortlist
  • Channel economics assessment
  • CEO-grade risk priorities

80+

Pages of insights

CHAPTER 4 - Market Size & Growth

Market Size, Growth Forecast and Trends

This section evaluates the historical market size, analyzes year-over-year growth dynamics, and presents forecast projections supported by market performance indicators and demand-side drivers.

Historical & Projected Market Size ($ Million)

Year-over-Year Growth Rate (%)

Market Value vs Volume Growth (%)

Historical Market Performance (2020-2025)

Market value increased by USD 2,790 million between 2020 and 2025. The 2020 base reflected mobility restrictions and weaker discretionary purchasing, while 2022-2024 produced the strongest expansion as stores reopened, marketplace adoption deepened and domestic brands multiplied. Annual growth peaked at 9.00% in 2024 before normalizing to 5.87% in 2025. The resulting 6.98% historical CAGR was supported by both unit expansion and premiumization.

Forecast Market Outlook (2025-2032)

Growth is forecast to stabilize near 4.35% annually, adding USD 3,382 million through 2032. Estimated volume growth of 3.1%-3.3% implies a positive value uplift from richer skincare routines, active ingredients and premium formats. Skincare and digital channels should outpace the total market, while mature mass toiletries face stronger price competition. The forecast closes at USD 13,122 million in 2032, consistent with a seven-year CAGR of 4.35%.

CHAPTER 5 - Market Data

Market Breakdown

The market combines resilient repeat-purchase demand with an increasingly competitive domestic manufacturing base. For investors, future returns will depend on digital conversion, product renewal and compliant scale rather than category growth alone.

Market Breakdown

Historical Data (2020-2024) • Base Data (2025) • Forecast Data (2026-2032)

Year
Market Size (USD Mn)
YoY Growth (%)
Domestic Manufacturers
Authorized Product SKUs
Export Value (USD Mn)
Period
2020$6,950 Mn+---
$#%
Forecast
2021$7,305 Mn+5.11%--
$#%
Forecast
2022$7,850 Mn+7.46%913-
$#%
Forecast
2023$8,440 Mn+7.52%1,010-
$#%
Forecast
2024$9,200 Mn+9.00%1,292283,391
$#%
Forecast
2025$9,740 Mn+5.87%1,500-
$#%
Forecast
2026$10,164 Mn+4.35%--
$#%
Forecast
2027$10,606 Mn+4.35%--
$#%
Forecast
2028$11,067 Mn+4.35%--
$#%
Forecast
2029$11,548 Mn+4.35%--
$#%
Forecast
2030$12,050 Mn+4.35%--
$#%
Forecast
2031$12,575 Mn+4.36%--
$#%
Forecast
2032$13,122 Mn+4.35%--
$#%
Forecast

Domestic Manufacturers

1,292 manufacturers, December 2024, Indonesia. A larger supplier base lowers sourcing barriers but raises customer-acquisition pressure. BPOM separately reported 1,904 business entities holding cosmetics notifications in September 2024.

Authorized Product SKUs

283,391 products, October 2024, Indonesia. SKU abundance increases assortment choice while making differentiation and claims governance critical. Domestic products represented 68.80% of notified cosmetics.

Export Value

USD 473.8 million, 2025, Indonesia. Export growth creates a second scaling pathway for compliant domestic brands. The comparable 2024 value was USD 416.8 million, implying 13.7% annual expansion.

CHAPTER 6 - Segmentation

Market Segmentation Framework

Comprehensive analysis across key dimensions providing insights into market structure, consumer preferences, and distribution patterns.

No of Segments

7

Dominant Segment

Product Type

Fastest Growing Segment

Distribution Channel

Product Type

Skincare
$%
Haircare
$%
Color Cosmetics
$%
Fragrances
$%

Price Tier

Mass
$%
Masstige
$%
Premium
$%
Luxury
$%

Customer Type

Women
$%
Men
$%
Gender-Neutral Consumers
$%

Purchase Occasion

Daily Personal Care
$%
Corrective Treatment
$%
Social and Formal Events
$%
Gifting
$%

Distribution Channel

Marketplaces
$%
Brand E-Commerce
$%
Specialty Beauty Retailers
$%
Pharmacies and Drugstores
$%
Department Stores
$%

Packaging Format

Bottles and Pumps
$%
Tubes
$%
Jars
$%
Sachets and Refills
$%

Geography

Java
$%
Sumatra
$%
Kalimantan
$%
Sulawesi and Eastern Indonesia
$%

Key Segmentation Takeaways

Comprehensive analysis across all extracted segmentation dimensions providing insights into market structure, consumer preferences, and distribution patterns.

Product Type

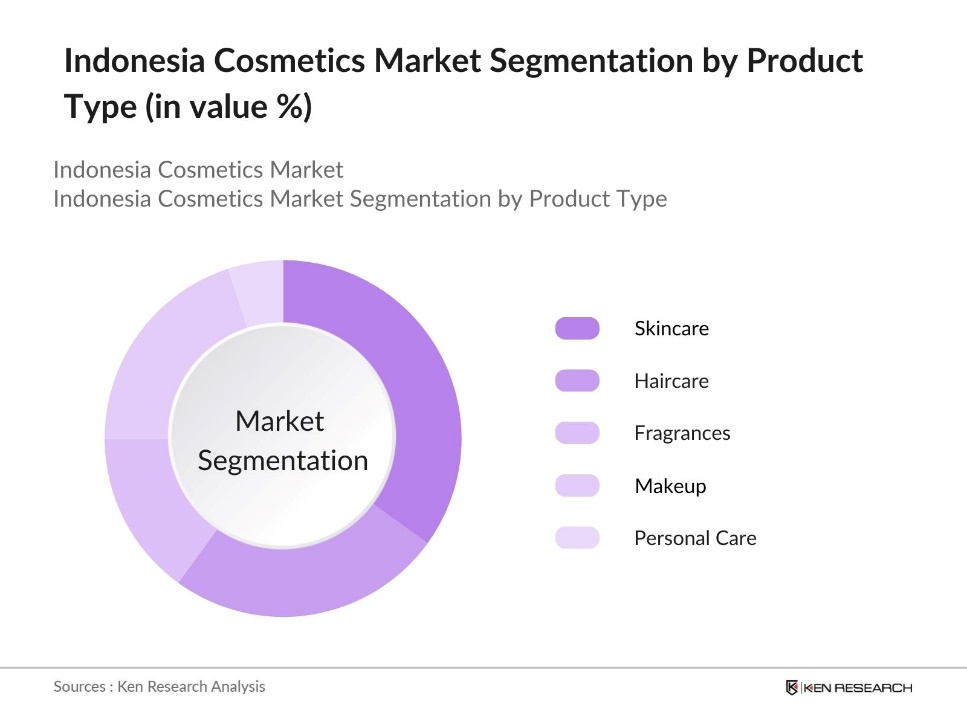
Skincare is the principal value pool because Indonesian consumers use multi-step facial care, sun protection and acne-oriented products suited to a humid tropical climate. Higher repeat frequency and active-ingredient innovation support stronger lifetime value than occasional color cosmetics or fragrance purchases. Haircare remains an important volume category, while dermocosmetics are expanding the premium end of skincare.

Distribution Channel

Marketplaces and brand e-commerce are the fastest-growing routes because they combine national reach, creator-led discovery, rapid assortment testing and measurable conversion. Winning brands are shifting from discount-led acquisition toward repeat purchasing, bundles and customer data. Offline specialty retailers and pharmacies remain important for product trial, professional credibility and premium consultation, supporting an increasingly integrated omnichannel model.

CHAPTER 7 - Regional Analysis

Regional Analysis

Indonesia ranks first among selected Southeast Asian cosmetics markets by 2025 value, supported by the region's largest population and a fast-expanding domestic producer base. Thailand remains the closest manufacturing and consumption comparator, while the Philippines, Malaysia and Vietnam offer smaller but strategically relevant demand pools.

Peer Country Ranking

1st

Indonesia Market Size (2025)

USD 9,740 Mn

Indonesia CAGR (2025-2032)

4.35%

Regional Analysis (Current Year)

Regional Analysis Comparison

MetricIndonesiaThailandPhilippinesMalaysiaVietnam
Market SizeUSD 9,740 Mn (2025)USD 5,600 Mn (2024)USD 3,100 Mn (2024)USD 3,700 Mn (2026)USD 1,800 Mn (2025)
CAGR (%)4.35%6.80%6.20%5.60%5.38%
Population (Mn)Approximately 284Approximately 72Approximately 116Approximately 35Approximately 101
Cosmetics Production Base1,292 manufacturers (2024)Established export-oriented hubImport-led with local manufacturingHalal-oriented manufacturing hubDeveloping domestic production base

Market Position

Indonesia ranks first in the selected peer set at USD 9,740 million in 2025, with its population and domestic-brand ecosystem providing a larger addressable base than neighboring markets.

Growth Advantage

Indonesia's 4.35% forecast CAGR is below Thailand's 6.80%, positioning it as the scale leader but a moderate-growth market requiring share capture and premiumization for outperformance.

Competitive Strengths

A base of 1,292 manufacturers, 283,391 authorized products and USD 473.8 million in 2025 exports gives Indonesia meaningful formulation, commercialization and regional-expansion capabilities.

CHAPTER 8 - INDUSTRY ANALYSIS

Growth Drivers, Challenges & Opportunities

Comprehensive analysis of key factors shaping the Indonesia Cosmetics Market, including growth catalysts, operational challenges, and emerging opportunities across production, distribution, and consumer segments.

Growth Drivers

Large Demographic and Recurring Beauty Demand

  • 284 million residents (2025, Indonesia) support mass-market scale and enable brands to build distinct products for multiple age, income and regional cohorts.
  • USD 3.07 billion skincare value (2025, Indonesia) indicates meaningful demand for facial care, sun protection and treatment products, benefiting formulation-led brands.
  • 6.1% skincare CAGR (2025-2032, Indonesia) supports allocating product development and marketing capital toward higher-frequency routines rather than occasional categories.

Domestic Brand and Manufacturing Expansion

  • 1,500 businesses (October 2025, Indonesia) indicate rapid entry, expanding contract-manufacturing demand while intensifying brand competition.
  • 90% small and medium industry share (2025, Indonesia) makes scalable quality systems, financing and distribution partnerships critical enablers of consolidation.
  • 68.80% domestic-product share of notifications (October 2024, Indonesia) demonstrates local innovation depth and lowers dependence on finished-product imports.

Export Market Development

  • Exports rose from USD 416.8 million to USD 473.8 million (2024-2025, Indonesia), improving the investment case for export-ready capacity and certification.
  • 82 cosmetics exporters (March 2025, Indonesia) show that export participation remains concentrated, leaving room for specialized market-access services.
  • 1,468 export certificates (through March 2025, Indonesia) demonstrate active regulatory facilitation and support wider ASEAN distribution.

Market Challenges

Regulatory and Portfolio Complexity

  • 283,391 authorized SKUs (October 2024, Indonesia) increase launch competition and shorten the commercial window for recovering formulation and marketing investment.
  • 1,904 notification-holding entities (September 2024, Indonesia) create a crowded brand environment in which compliance alone does not secure distribution.
  • 235 illegal or hazardous items (October-November 2024, Indonesia) expose legitimate brands and platforms to trust, enforcement and monitoring costs.

Illegal Products and Channel Enforcement

  • Four enforcement areas (2024, Indonesia) were involved in the cited action, showing that illicit distribution is geographically dispersed rather than isolated.
  • 235 seized product items (2024, Indonesia) require marketplaces and retailers to strengthen seller verification and rapid delisting processes.
  • 31.20% imported share of notified products (October 2024, Indonesia) increases the need for traceability across importers, distributors and online sellers.

Margin Pressure in a Fragmented Market

  • 90% small and medium operators (2025, Indonesia) suggests many competitors lack purchasing scale, increasing sensitivity to packaging and ingredient costs.
  • 4.35% forecast CAGR (2025-2032, Indonesia) means operators cannot rely on market growth alone and must win share while preserving contribution margins. kenresearch.com
  • 13.7% export growth (2024-2025, Indonesia) creates opportunity but also requires additional certification, distributor support and working capital.

Market Opportunities

Halal and Ingredient-Transparent Beauty

  • 68.80% domestic notification share (2024, Indonesia) enables local producers to monetize culturally aligned formulation and supply-chain transparency.
  • 1,292 manufacturers (2024, Indonesia) provide potential partners for brand owners and investors seeking asset-light contract production.
  • 283,391 authorized products (2024, Indonesia) make verified claims, certification visibility and ingredient education necessary for differentiation.

Dermocosmetics and Climate-Specific Skincare

  • USD 3.07 billion skincare value (2025, Indonesia) provides sufficient scale for specialist acne, pigmentation, barrier and sun-care portfolios.
  • 6.1% skincare CAGR (2025-2032, Indonesia) should benefit active-ingredient suppliers, dermatology channels and evidence-led local brands.
  • USD 1.57 billion incremental skincare value (2025-2032, Indonesia) requires stronger substantiation, consumer education and repeat-purchase systems to materialize.

Regional Export Scaling

  • 82 active exporters (March 2025, Indonesia) leave room for distributors, regulatory advisers and logistics providers to expand the exporter cohort.
  • USD 57 million export increase (2024-2025, Indonesia) strengthens the case for regional brand building and dedicated export production lines.
  • 1,468 export certificates (through March 2025, Indonesia) indicate that regulatory throughput and destination-market compliance are essential scaling capabilities.

CHAPTER 9 - Competitive Landscape

Competitive Landscape Overview

Competition is fragmented across global groups, large domestic manufacturers and digitally native local brands, with regulatory approval, distribution access, innovation speed and sustained marketing investment forming the main barriers to scale.

Market Share Distribution

Paragon Technology and Innovation
Unilever Indonesia
L'Oréal Indonesia
Martina Berto Tbk

Top 5 Players

1
Paragon Technology and Innovation
!$*
2
Unilever Indonesia
^&
3
L'Oréal Indonesia
#@
4
Martina Berto Tbk
$
5
Mandom Indonesia Tbk
&@$
Combined Share$%

Market Dynamics

Local Players70%
Regional/Int'l30%

8 new entrants in the past 5 years, indicating strong market attractiveness and growth potential.

Company Profiles (Top 10 Players)
Company Name
Market Share
Headquarters
Founding Year
Core Market Focus
Paragon Technology and Innovation
-Jakarta, Indonesia1985Halal skincare and color cosmetics
Unilever Indonesia
-Tangerang, Indonesia1933Mass skincare, haircare and personal beauty
L'Oréal Indonesia
-Jakarta, Indonesia-Mass, dermocosmetics and premium beauty
Martina Berto Tbk
-Jakarta, Indonesia1977Herbal skincare and color cosmetics
Mandom Indonesia Tbk
-Bekasi, Indonesia1969Hair styling, grooming and fragrance
Mustika Ratu Tbk
-Jakarta, Indonesia1975Herbal beauty and traditional formulations
Gondowangi Tradisional Kosmetika
-Jakarta, Indonesia-Haircare and natural beauty products
Royal Pesona Indonesia
-Jakarta, Indonesia-Digital-native skincare and beauty
Beiersdorf Indonesia
-Jakarta, Indonesia-Mass and therapeutic skincare
Procter & Gamble Indonesia
-Jakarta, Indonesia-Haircare and prestige skincare

Cross Comparison Parameters

The report provides detailed cross-comparison of key players across 10 performance parameters to identify competitive strengths and weaknesses.

Analysis Covered

Market Share Analysis:

Assesses competitive scale across product categories and distribution channels.

Cross Comparison Matrix:

Benchmarks innovation, reach, revenue growth and margin performance consistently.

SWOT Analysis:

Evaluates strategic strengths, vulnerabilities, opportunities and competitive threats systematically.

Pricing Strategy Analysis:

Compares mass, masstige, premium and luxury price architecture choices.

Company Profiles:

Reviews portfolio focus, positioning, capabilities and market participation depth.

CHAPTER 10 - REPORT TOC

Market Report Structure

Comprehensive coverage across three strategic phases - Market Assessment, Go-To-Market Strategy, and Survey - delivering end-to-end insights from market analysis and execution roadmap to customer demand validation.

91Pages
34Chapters
10Companies Profiled
7Segmentation Types
Phase 1

Market Assessment Phase

11

Supply-side and competitive intelligence covering market sizing, segmentation, competitive dynamics, regulatory landscape, and future forecasts.

Phase 2

Go-To-Market Strategy Phase

15 chapters

Entry strategy evaluation, execution roadmap, partner recommendations, and profitability outlook.

Phase 3

Survey Phase

8 chapters

Demand-side primary research conducted through structured interviews and online surveys with end users across priority metros and Tier 2/3 cities to capture consumption behavior, unmet needs, and purchase drivers.

Complete Report Coverage

201+ detailed sections covering every aspect of the market

143

Assessment Sections

58

Strategy Sections

CHAPTER 11 - Our Approach

Research Methodology

Desk Research

  • Reviewed BPOM cosmetics notification records
  • Analyzed industrial production and trade
  • Mapped brand portfolios and channels
  • Benchmarked category pricing and launches

Primary Research

  • Interviewed cosmetics manufacturing directors
  • Consulted regulatory affairs managers
  • Engaged beauty retail category heads
  • Surveyed marketplace brand managers

Validation and Triangulation

  • Validated findings across 284 respondents
  • Reconciled retail and manufacturer revenues
  • Cross-checked volumes against pricing
  • Reviewed outliers by market scope

CHAPTER 12 - FAQ

FAQs

Still have questions?

Our research team is here to help you find the right solution

Contact Research Team

CHAPTER 13 - Related Research

Explore Related Reports

Expand your market intelligence with complementary research across regions and adjacent markets.

Regional/Country Reports

Related market analysis across key regions

No regional reports found.

Adjacent Reports

Related markets and complementary research

No adjacent reports found.

500+

Market Research Reports

50+

Countries Covered

15+

Industry Verticals

Want the full report and an analyst walkthrough?

Unlock the complete dataset, segmentation cuts, and competitive analysis—plus a discovery call that maps insights to your go-to-market priorities.

;