
Indonesia Digital Transformation Market Outlook to 2030
Region:Indonesia
Author(s):Shreya
Product Code:KROD3677
Region:Indonesia
Author(s):Shreya
Product Code:KROD3677
November 2024
93
Indonesia Digital Transformation Market Overview
The Indonesia Digital Transformation Market is valued at USD 19.8 billion, driven primarily by the countrys increasing internet penetration, mobile connectivity, and government initiatives promoting digital transformation across various sectors. A comprehensive analysis over the past five years indicates significant growth in digital adoption across industries such as e-commerce, financial services, and manufacturing. The rapid development of digital infrastructure, including the deployment of 5G technology, has further fueled this growth, enabling businesses to embrace cloud computing, artificial intelligence (AI), and Internet of Things (IoT) solutions. The market continues to evolve as businesses invest in digital technologies to improve operational efficiency and customer engagement. 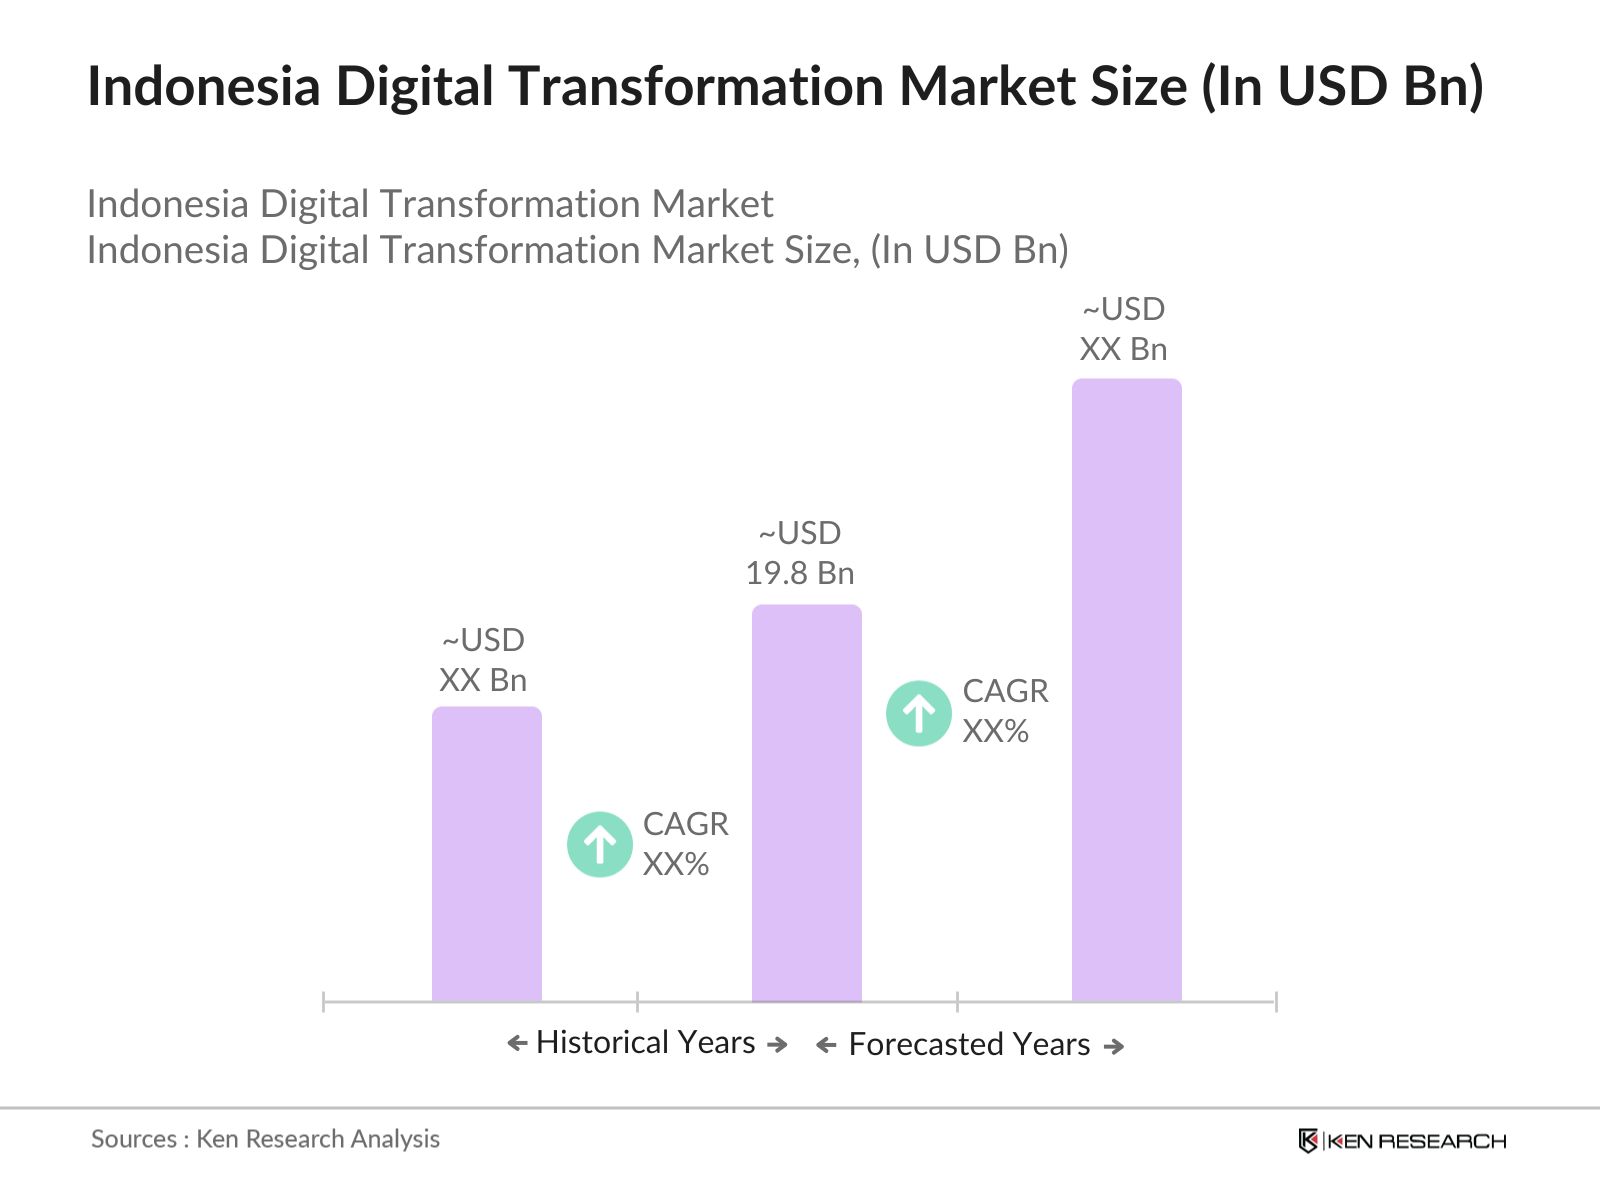
Key cities driving the digital transformation market in Indonesia include Jakarta, Surabaya, and Bandung. Jakartas dominance is attributed to its role as the economic and business hub of Indonesia, attracting multinational corporations and a high concentration of tech startups. Surabaya and Bandung are emerging as regional tech hubs due to their growing tech ecosystems, fostering innovation in digital services. The dominance of these cities is further supported by government incentives to develop smart cities and increase technology adoption, positioning them as leaders in digital transformation initiatives.
Indonesias Personal Data Protection Act (PDP) was enacted in 2023 to regulate the use and storage of personal data. The law mandates businesses to obtain explicit consent before collecting personal information, enforce data protection protocols, and report any data breaches. In 2023, over 2,500 companies were audited for compliance with the PDP Act, ensuring that Indonesia aligns with global data protection standards.
By Technology: The market is segmented by technology into cloud computing, artificial intelligence, internet of things (IoT), big data and analytics, and robotic process automation (RPA). Cloud computing holds a dominant market share due to its essential role in providing scalable infrastructure for businesses transitioning digitally. This segment benefits from the growing reliance on cloud-based applications for data storage and management, supported by government policies promoting cloud adoption across public and private sectors. 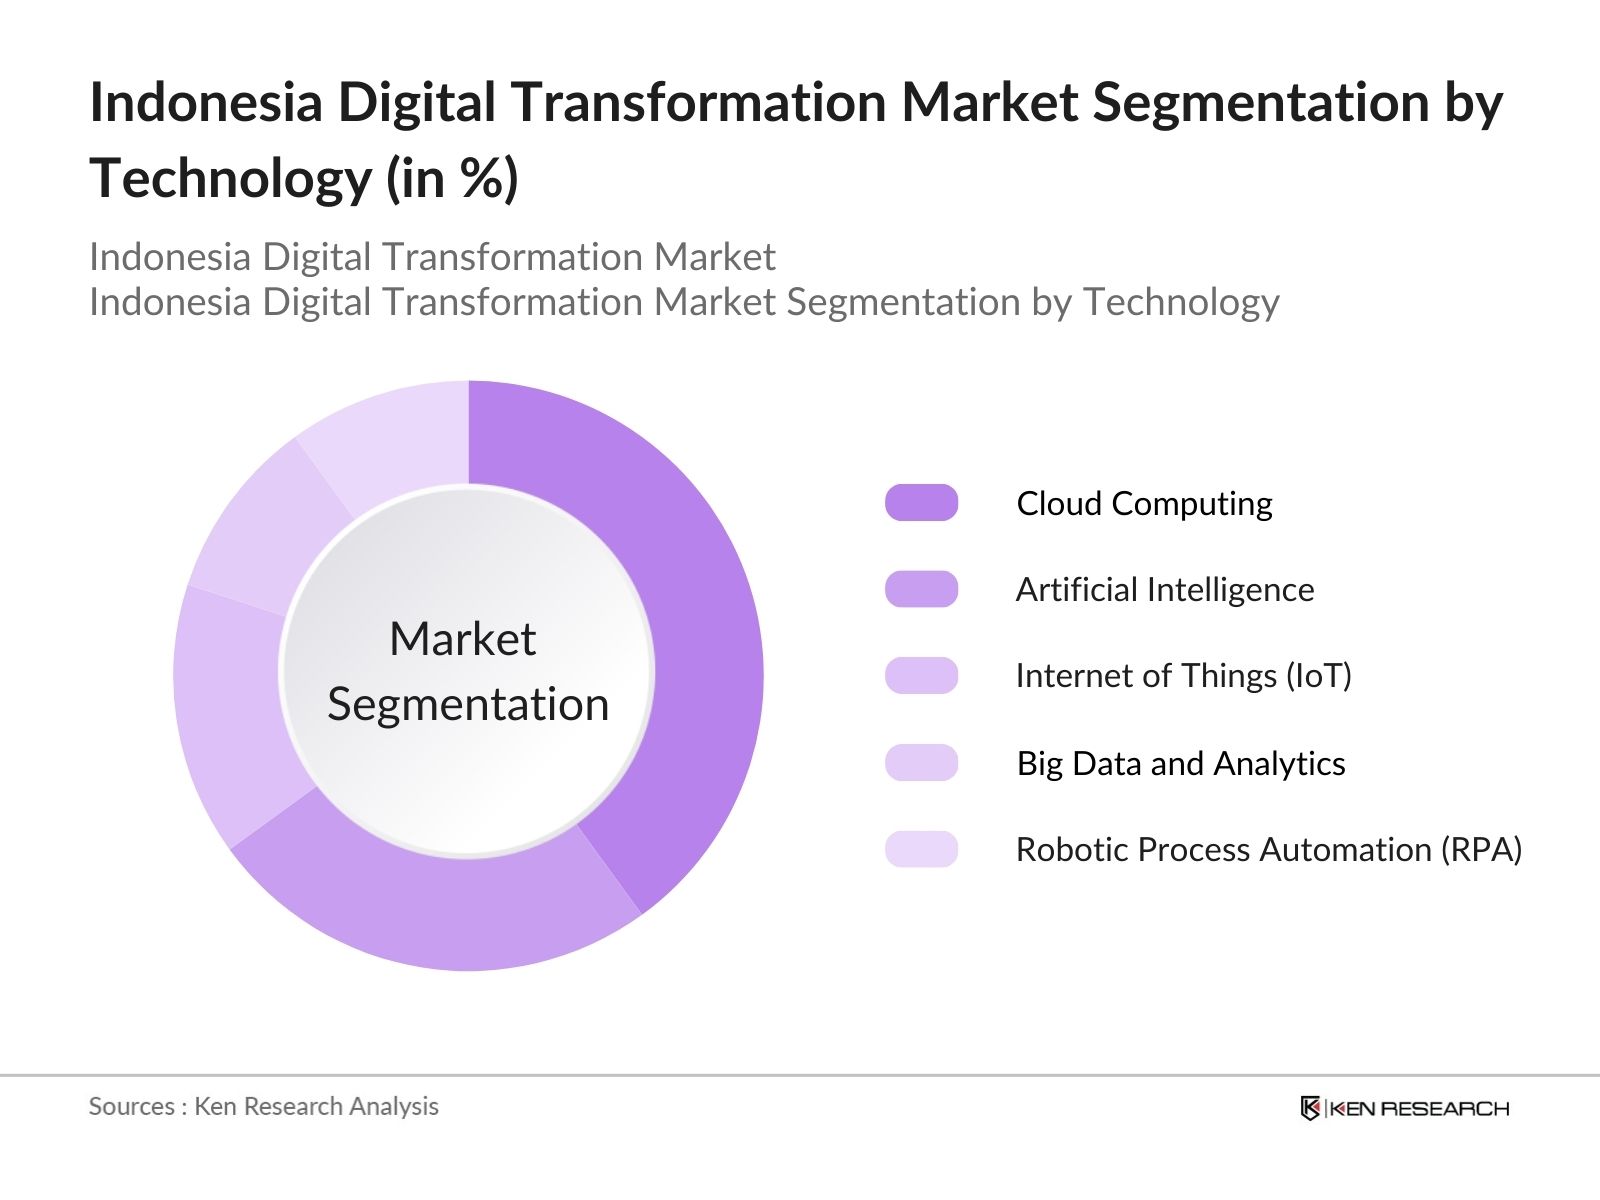
By Application Area: The market is further segmented by application area, covering healthcare, education, retail and e-commerce, manufacturing, and financial services. The financial services sector is dominant due to the expansion of digital banking and fintech solutions, driven by the increasing demand for secure and efficient digital transactions. This segment also gains from regulatory support for fintech innovations, making it a central application area for digital transformation in Indonesia.

The Indonesia Digital Transformation Market is characterized by a mix of local and international players, with a focus on providing innovative solutions across multiple industries. Major players in the market include Telkom Indonesia, Gojek, Tokopedia, and international giants like Microsoft Indonesia and Alibaba Cloud. The market is dominated by these key players, who are driving digital adoption through extensive partnerships, investments in technology infrastructure, and product innovation. Local companies, such as Gojek and Tokopedia, have played a crucial role in shaping the digital economy by providing accessible and scalable digital services to both consumers and businesses.
|
Company Name |
Establishment Year |
Headquarters |
No. of Employees |
Digital Solutions Portfolio |
Cloud Adoption Level |
AI Integration |
Strategic Partnerships |
Market Share |
|
Telkom Indonesia |
1965 |
Jakarta, Indonesia |
||||||
|
Gojek |
2010 |
Jakarta, Indonesia |
||||||
|
Tokopedia |
2009 |
Jakarta, Indonesia |
||||||
|
Microsoft Indonesia |
1995 |
Jakarta, Indonesia |
||||||
|
Alibaba Cloud Indonesia |
2009 |
Jakarta, Indonesia |
Governments National Digital Transformation Strategy: Indonesia's government has been pushing a robust national digital transformation strategy that includes major initiatives like the "Making Indonesia 4.0" plan, which is set to integrate advanced technology into key industries. By 2024, the government plans to digitize over 5,000 traditional markets and empower 30 million micro, small, and medium enterprises (MSMEs) with digital capabilities. According to the Ministry of Communication and Informatics, 11% of Indonesias GDP in 2023 came from the digital economy, making it a significant driver of national growth.
Rise in E-Commerce Platforms: Indonesias booming e-commerce market, one of the largest in Southeast Asia, is a key driver of digital transformation. Over 130 million people made online purchases in 2023, supported by robust internet penetration and increasing consumer trust in digital transactions. The value of transactions surpassed $40 billion in 2023, driven by major platforms like Tokopedia, Shopee, and Lazada. E-commerce is projected to contribute significantly to the nations overall economic activities.
5G Network Deployment: Indonesia is actively rolling out its 5G network, with initial deployment in major cities such as Jakarta, Surabaya, and Medan. By 2023, the 5G service had reached over 3 million users, boosting sectors like healthcare, manufacturing, and education. The Ministry of Communication and Informatics has allocated $2 billion for 5G infrastructure development. This rollout is expected to elevate IoT usage and streamline business operations across multiple sectors.
Digital Literacy Gap: A key challenge for digital transformation in Indonesia is the digital literacy gap, particularly in rural areas. In 2023, the National Bureau of Statistics reported that 37% of the rural population lacked basic digital skills, impacting the effective use of digital platforms. Despite government programs, such as digital literacy training for 12 million people by 2025, this gap continues to slow the adoption of digital services.
Infrastructure Limitations in Rural Areas: Despite efforts to bridge the digital divide, infrastructure in Indonesias rural areas remains a challenge. Over 12,000 villages still lack reliable internet access as of 2023, according to Indonesias Ministry of Communication and Informatics. This shortfall limits digital inclusion and hampers access to government e-services, e-commerce, and online education in these regions.
The Indonesia Digital Transformation Market is poised for significant growth in the coming years, driven by continuous advancements in technology, government support, and increasing digital adoption across various industries. The rise of smart city initiatives, digital payment systems, and cloud-based services will further fuel this growth. The governments push for digital literacy and its vision to position Indonesia as a digital economy powerhouse will be pivotal in shaping the future market landscape.
Growth of Fintech and Digital Payments: The rapid expansion of fintech services presents a significant opportunity in Indonesias digital transformation journey. As of 2023, digital payments reached 425 million transactions per month, driven by platforms like OVO, GoPay, and Dana. The value of these transactions was over $18 billion. With a low banked population, the fintech sector offers a promising avenue for financial inclusion, especially in rural areas.
Expansion of Smart City Initiatives: Indonesias push for smart city development offers vast opportunities for technological integration. By 2023, 100 cities, including Jakarta, Surabaya, and Bandung, had launched smart city initiatives focusing on efficient public services, transportation, and environmental management. The Ministry of National Development Planning allocated $8 billion for smart city projects, including the application of IoT, AI, and big data analytics.
|
Technology |
Cloud Computing |
|
Application Area |
Healthcare |
|
Deployment Type |
Cloud |
|
Enterprise Size |
Large Enterprises |
|
Region |
Java |
Major Players
Key Target Audience
1.1. Definition and Scope
1.2. Market Taxonomy
1.3. Digital Adoption Growth Rate
1.4. Market Segmentation Overview
2.1. Historical Market Size
2.2. Year-On-Year Growth Analysis
2.3. Key Market Developments and Milestones (Digital Infrastructure, E-Government Initiatives)
3.1. Growth Drivers
3.1.1. Governments National Digital Transformation Strategy
3.1.2. Rise in E-Commerce Platforms
3.1.3. 5G Network Deployment
3.1.4. Increasing Mobile and Internet Penetration
3.2. Market Challenges
3.2.1. Digital Literacy Gap
3.2.2. Infrastructure Limitations in Rural Areas
3.2.3. Cybersecurity Threats
3.3. Opportunities
3.3.1. Growth of Fintech and Digital Payments
3.3.2. Expansion of Smart City Initiatives
3.3.3. Emerging Cloud Computing Demand
3.4. Trends
3.4.1. Adoption of AI and Machine Learning in Business Operations
3.4.2. Digital Workforce Upskilling Programs
3.4.3. IoT Integration in Manufacturing
3.5. Government Regulation
3.5.1. Data Protection Laws (Indonesia Personal Data Protection Act)
3.5.2. Digital Infrastructure Regulations
3.5.3. E-Commerce Regulations and Consumer Protection
3.5.4. Cybersecurity Framework
3.6. SWOT Analysis
3.7. Stakeholder Ecosystem (Public-Private Partnerships, Technology Vendors)
3.8. Porters Five Forces
3.9. Competition Ecosystem (Local vs. International Players)
4.1. By Industry Vertical (In Value %)
4.1.1. Financial Services
4.1.2. Retail & E-Commerce
4.1.3. Manufacturing
4.1.4. Telecommunications
4.1.5. Healthcare
4.2. By Technology (In Value %)
4.2.1. Cloud Computing
4.2.2. Artificial Intelligence (AI)
4.2.3. Internet of Things (IoT)
4.2.4. Big Data Analytics
4.2.5. Blockchain
4.3. By Organization Size (In Value %)
4.3.1. Small and Medium Enterprises (SMEs)
4.3.2. Large Enterprises
4.4. By Deployment Mode (In Value %)
4.4.1. On-Premises
4.4.2. Cloud-Based
4.5. By Region (In Value %)
4.5.1. Java
4.5.2. Sumatra
4.5.3. Kalimantan
4.5.4. Sulawesi
4.5.5. Papua
5.1. Detailed Profiles of Major Companies
5.1.1. Telkom Indonesia
5.1.2. PT Bank Central Asia Tbk
5.1.3. Gojek (PT Aplikasi Karya Anak Bangsa)
5.1.4. Tokopedia
5.1.5. Shopee Indonesia
5.1.6. Bukalapak
5.1.7. PT XL Axiata Tbk
5.1.8. PT Indosat Tbk
5.1.9. Huawei Technologies Indonesia
5.1.10. Microsoft Indonesia
5.1.11. Google Indonesia
5.1.12. Oracle Indonesia
5.1.13. Alibaba Cloud Indonesia
5.1.14. PT Telekomunikasi Indonesia International
5.1.15. Cisco Systems Indonesia
5.2. Cross Comparison Parameters (No. of Employees, Headquarters, Inception Year, Revenue, Digital Solutions Portfolio, Strategic Partnerships, Cloud Adoption Level, AI Integration, Market Share)
5.3. Market Share Analysis
5.4. Strategic Initiatives
5.5. Mergers and Acquisitions
5.6. Investment Analysis
5.7. Venture Capital Funding
5.8. Government Grants
5.9. Private Equity Investments
6.1. Digital Economy Regulations
6.2. Cybersecurity Compliance Requirements
6.3. E-Commerce and Fintech Regulatory Environment
6.4. Data Privacy and Protection Laws
7.1. Future Market Size Projections
7.2. Key Factors Driving Future Market Growth
8.1. By Industry Vertical (In Value %)
8.2. By Technology (In Value %)
8.3. By Organization Size (In Value %)
8.4. By Deployment Mode (In Value %)
8.5. By Region (In Value %)
9.1. TAM/SAM/SOM Analysis
9.2. Digital Adoption Roadmap
9.3. Market Penetration Strategies
9.4. White Space Opportunity Analysis
Disclaimer Contact Us
The initial stage involves mapping out the key stakeholders in the Indonesia Digital Transformation Market. Using desk research and proprietary databases, this phase identifies the main variables affecting market dynamics, including technological adoption, market penetration, and regulatory changes.
Historical data regarding digital transformation initiatives is collected and analyzed, including digital penetration rates, the impact of cloud computing, and revenue generation across verticals. This step also examines the growth of e-commerce and fintech sectors in the Indonesian market.
Market hypotheses are validated through expert interviews from technology companies, government bodies, and industry experts. These consultations provide deep insights into market trends, digital adoption strategies, and operational efficiencies, helping refine the reports conclusions.
Finally, engagement with leading digital transformation players in Indonesia provides detailed insights into product development, market strategies, and adoption rates. This primary research ensures that the final report is accurate, comprehensive, and validated against real-world industry data.
The Indonesia Digital Transformation Market is valued at USD 19.8 billion, driven by rapid technological advancements, increased internet penetration, and significant investments in digital infrastructure.
Challenges in the Indonesia Digital Transformation Market include digital literacy gaps, cybersecurity threats, and uneven infrastructure development, particularly in rural areas, which hampers the widespread adoption of digital technologies across the country.
Key players in the Indonesia Digital Transformation Market include Telkom Indonesia, Gojek, Tokopedia, Microsoft Indonesia, and Alibaba Cloud Indonesia. These companies dominate due to their strong partnerships, innovative digital solutions, and extensive reach across industries.
Growth drivers in the Indonesia Digital Transformation Market include the expansion of cloud computing services, government-led digital transformation initiatives, and the increasing demand for e-commerce, fintech, and smart city solutions in major urban centers.
The Indonesia Digital Transformation Market is expected to see significant growth in the coming years, with increased investment in cloud computing, AI, and IoT technologies. Government efforts to position Indonesia as a digital economy leader will further drive adoption across sectors.

What makes us stand out is that our consultants follows Robust, Refine and Result (RRR) methodology. i.e. Robust for clear definitions, approaches and sanity checking, Refine for differentiating respondents facts and opinions and Result for presenting data with story

We have set a benchmark in the industry by offering our clients with syndicated and customized market research reports featuring coverage of entire market as well as meticulous research and analyst insights.

While we don't replace traditional research, we flip the method upside down. Our dual approach of Top Bottom & Bottom Top ensures quality deliverable by not just verifying company fundamentals but also looking at the sector and macroeconomic factors.

With one step in the future, our research team constantly tries to show you the bigger picture. We help with some of the tough questions you may encounter along the way: How is the industry positioned? Best marketing channel? KPI's of competitors? By aligning every element, we help maximize success.

Our report gives you instant access to the answers and sources that other companies might choose to hide. We elaborate each steps of research methodology we have used and showcase you the sample size to earn your trust.

If you need any support, we are here! We pride ourselves on universe strength, data quality, and quick, friendly, and professional service.