
Indonesia Sugar Market Outlook to 2030
Region:Asia
Author(s):Mukul
Product Code:KROD2161
Region:Asia
Author(s):Mukul
Product Code:KROD2161
November 2024
93


|
Company |
Established Year |
Headquarters |
|
PT Perkebunan Nusantara (PTPN) |
1950 |
Jakarta, Indonesia |
|
PT Rajawali Nusantara Indonesia (RNI) |
1964 |
Jakarta, Indonesia |
|
PT Kebon Agung |
1951 |
Surabaya, Indonesia |
|
PT Gunung Madu |
1975 |
Lampung, Indonesia |
|
PT PG Krebet Baru |
1978 |
Malang, Indonesia |
Indonesia Sugar Market Growth Drivers
Indonesia Sugar Market Challenges
Government Initiatives in the Indonesia Sugar Market
The Indonesia sugar market is poised for growth over the next five years, driven by government initiatives aimed at achieving self-sufficiency and reducing reliance on imports. With the countrys food and beverage sector continuing to expand, domestic demand for sugar is expected to remain strong.
Future Trends
|
By Product Type |
Raw Sugar Refined Sugar Brown Sugar |
|
By End-User |
Industrial Retail Pharmaceuticals |
|
By Region |
North South East West |
1.1. Definition and Scope
1.2. Market Taxonomy
1.3. Market Growth Rate
1.4. Market Segmentation Overview
2.1. Historical Market Size
2.2. Year-on-Year Growth Analysis
2.3. Key Market Developments and Milestones
3.1. Growth Drivers
3.1.1. Rising Demand from Food and Beverage Sector
3.1.2. Increasing Domestic Consumption
3.1.3. Government Support for Production Expansion
3.2. Restraints
3.2.1. Inconsistent Sugarcane Yields
3.2.2. Dependence on Sugar Imports
3.2.3. Infrastructure and Logistics Challenges
3.3. Opportunities
3.3.1. Technology Integration in Sugarcane Farming
3.3.2. Expansion of Renewable Energy in Mills
3.3.3. Government Subsidies for Farmers
3.4. Trends
3.4.1. Adoption of Smart Farming Technologies
3.4.2. Renewable Energy Integration in Sugar Mills
3.4.3. Expansion of Sugarcane Plantations
3.5. Government Regulation
3.5.1. Expansion of Sugarcane Plantations (2023)
3.5.2. Revitalization of Sugar Mills (2023)
3.5.3. Import Restriction Policy (2024)
3.6. SWOT Analysis
3.7. Stake Ecosystem
3.8. Competition Ecosystem
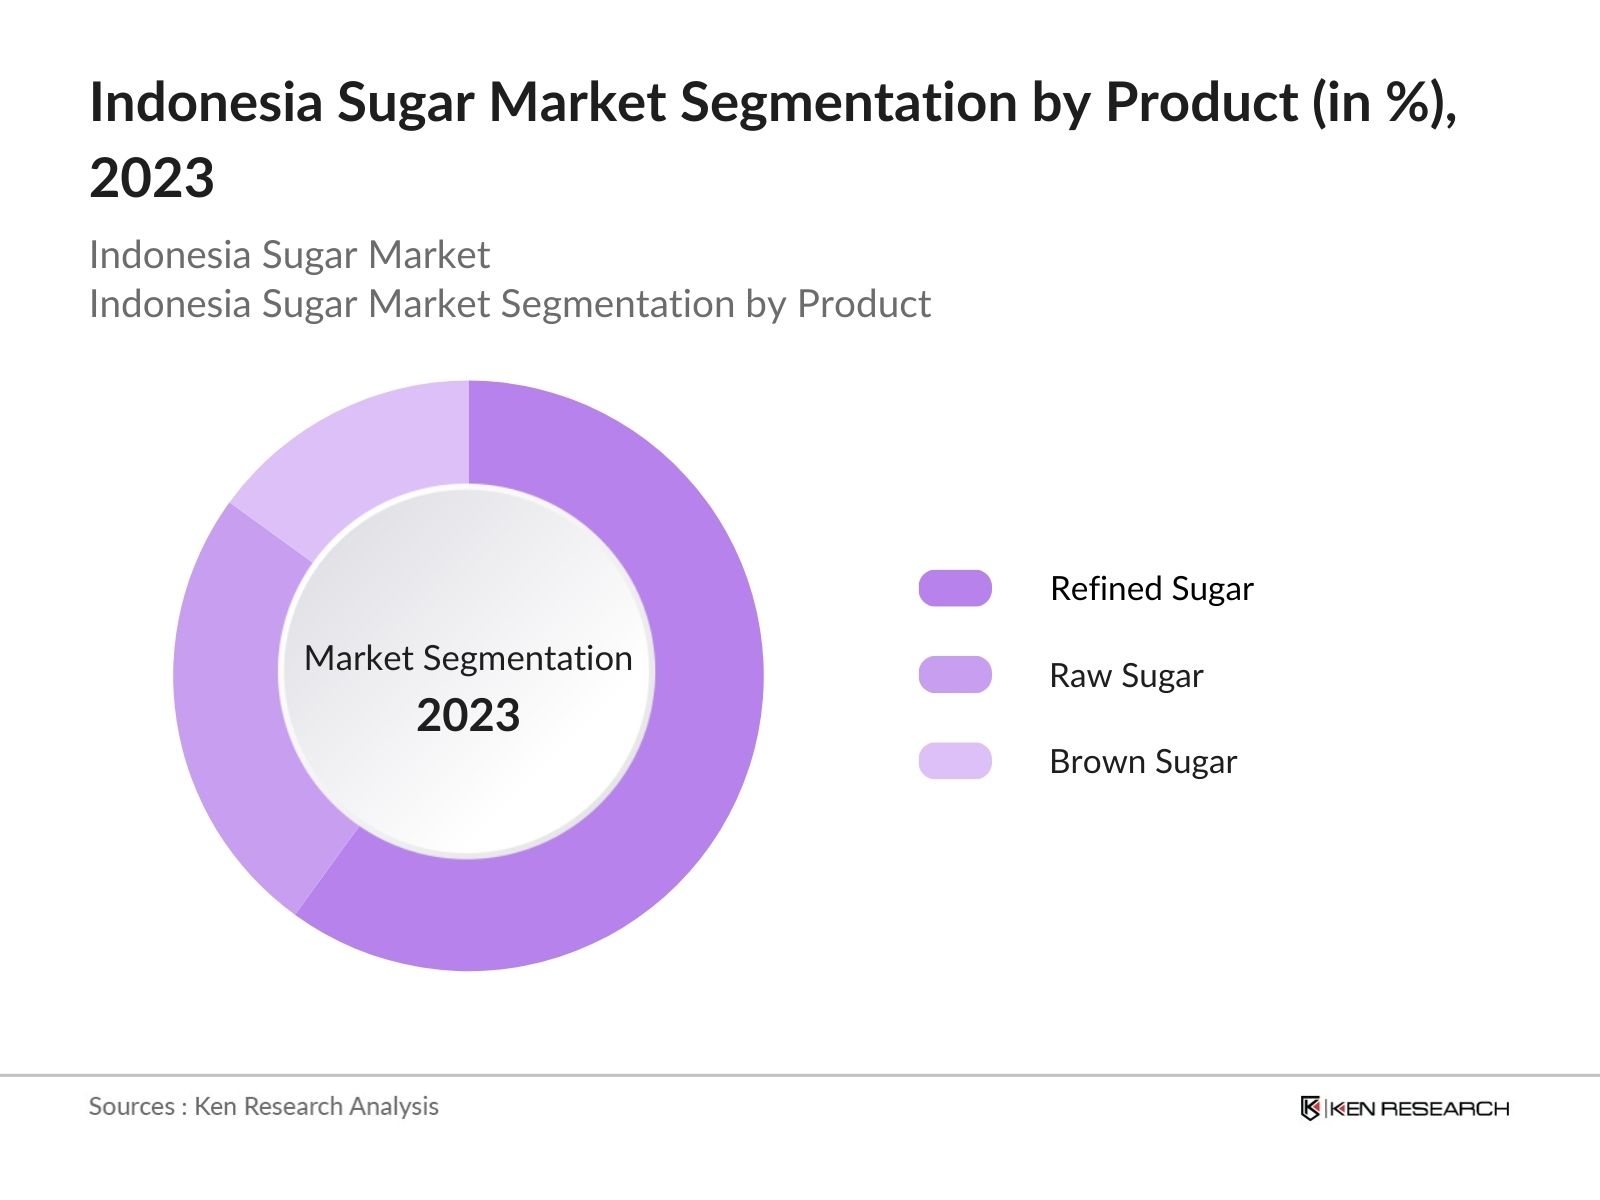
4.1. By Product Type (in Value %)
4.1.1. Raw Sugar
4.1.2. Refined Sugar
4.1.3. Brown Sugar
4.2. By End-User (in Value %)
4.2.1. Industrial (Food & Beverage Manufacturers)
4.2.2. Retail (Households)
4.2.3. Pharmaceuticals
4.3. By Region (in Value %)
4.3.1. North Indonesia
4.3.2. South Indonesia
4.3.3. East Indonesia
4.3.4. West Indonesia
5.1. Detailed Profiles of Major Companies
5.1.1. PT Perkebunan Nusantara (PTPN)
5.1.2. PT Rajawali Nusantara Indonesia (RNI)
5.1.3. PT Kebon Agung
5.1.4. PT Gunung Madu
5.1.5. PT PG Krebet Baru
5.1.6. PT PG Cinta Manis
5.1.7. PT PG Pakis Baru
5.1.8. PT PG Glenmore
5.1.9. PT PG Djombang Baru
5.1.10. PT Indo Lampung Perkasa
5.2. Cross Comparison Parameters (No. of Employees, Headquarters, Inception Year, Revenue)
6.1. Market Share Analysis
6.2. Strategic Initiatives
6.3. Mergers and Acquisitions
6.4. Investment Analysis
6.4.1. Venture Capital Funding
6.4.2. Government Grants
6.4.3. Private Equity Investments
7.1. Sugar Production and Import Regulations
7.2. Compliance Requirements
7.3. Certification Processes
8.1. Future Market Size Projections
8.2. Key Factors Driving Future Market Growth
9.1. By Product Type (in Value %)
9.2. By End-User (in Value %)
9.3. By Region (in Value %)
10.1. TAM/SAM/SOM Analysis
10.2. Customer Cohort Analysis
10.3. Marketing Initiatives
10.4. White Space Opportunity Analysis
Disclaimer
Contact Us
Ecosystem creation for all major entities within the Indonesia Sugar Market by referring to multiple secondary and proprietary databases. This step involves conducting desk research to gather detailed industry-level information, focusing on market dynamics, key players, product types, and regional distributions. Specific attention is paid to government policies, production trends, and import-export data to form a comprehensive view of the market.
Compiling statistics on the Indonesia Sugar Market over recent years, including production volumes, import and export figures, and regional segmentation. This process includes analyzing market share data by product type, production capacity of key players, and pricing trends. Additionally, data from government reports on subsidies, infrastructure investments, and regulatory changes are incorporated to compute revenue generated in the market.
Building market hypotheses and conducting Computer-Assisted Telephonic Interviews (CATIs) with industry experts from leading sugar manufacturing companies and agricultural cooperatives. This step ensures the validation of gathered statistics and refinement of market insights. Operational and financial data is also gathered from company representatives to cross-check the accuracy of projections and adjust the market analysis as needed.
Our team engages with sugar producers, distributors, and government bodies in Indonesia to understand the dynamics of the supply chain, production trends, consumer demand, and emerging technologies in the sector. This bottom-up approach ensures the validation of data and that the research output is comprehensive, providing an accurate reflection of market conditions and future outlook.
The Indonesian sugar market was valued at USD 7.5 billion in 2023, fueled by rising domestic consumption, government initiatives aimed at enhancing local production, and the growth of the food and beverage sectors.
Challenges in the Indonesia sugar market include high dependence on sugar imports, inconsistent sugarcane yields due to extreme weather, and infrastructure bottlenecks, particularly in the transportation and milling sectors, which slow down the supply chain.
Key players in the Indonesia sugar market include PT Perkebunan Nusantara (PTPN), PT Rajawali Nusantara Indonesia (RNI), PT Gunung Madu, and PT Kebon Agung. These companies dominate due to their strong production capacities and extensive distribution networks.
The growth of the Indonesia sugar market is driven by increasing demand from the food and beverage industry, government support for expanding domestic sugar production, and investments in modern agricultural technologies that improve sugarcane yields.
 Framework")
What makes us stand out is that our consultants follows Robust, Refine and Result (RRR) methodology. i.e. Robust for clear definitions, approaches and sanity checking, Refine for differentiating respondents facts and opinions and Result for presenting data with story

We have set a benchmark in the industry by offering our clients with syndicated and customized market research reports featuring coverage of entire market as well as meticulous research and analyst insights.

While we don't replace traditional research, we flip the method upside down. Our dual approach of Top Bottom & Bottom Top ensures quality deliverable by not just verifying company fundamentals but also looking at the sector and macroeconomic factors.

With one step in the future, our research team constantly tries to show you the bigger picture. We help with some of the tough questions you may encounter along the way: How is the industry positioned? Best marketing channel? KPI's of competitors? By aligning every element, we help maximize success.

Our report gives you instant access to the answers and sources that other companies might choose to hide. We elaborate each steps of research methodology we have used and showcase you the sample size to earn your trust.

If you need any support, we are here! We pride ourselves on universe strength, data quality, and quick, friendly, and professional service.