CHAPTER 1 - MARKET SUMMARY
Market Overview
The KSA Biodiesel Market operates through collection of used cooking oil and other lipid feedstocks, pretreatment, transesterification, quality testing and sale of B100 or blended fuel to fleet, marine, construction and power-generation customers. More than 15.8 million vehicles were registered in 2024, providing a large diesel-consuming installed base against which low-percentage biodiesel blending can scale commercially.
Production and feedstock aggregation are concentrated in the Eastern Province, particularly Jubail, where industrial infrastructure, ports, refineries and heavy-equipment customers create efficient collection and offtake economics. The leading domestic producer operates from Jubail Industrial City and collects used oil from restaurants, hotels, malls, cloud kitchens and industrial kitchens, reducing transportation losses across the supply chain.
Market Value
USD 52 million
2025
Dominant Region
Eastern Province
Dominant Segment
Used Cooking Oil-Based Biodiesel
largest feedstock segment
Total Number of Players
18
Future Outlook
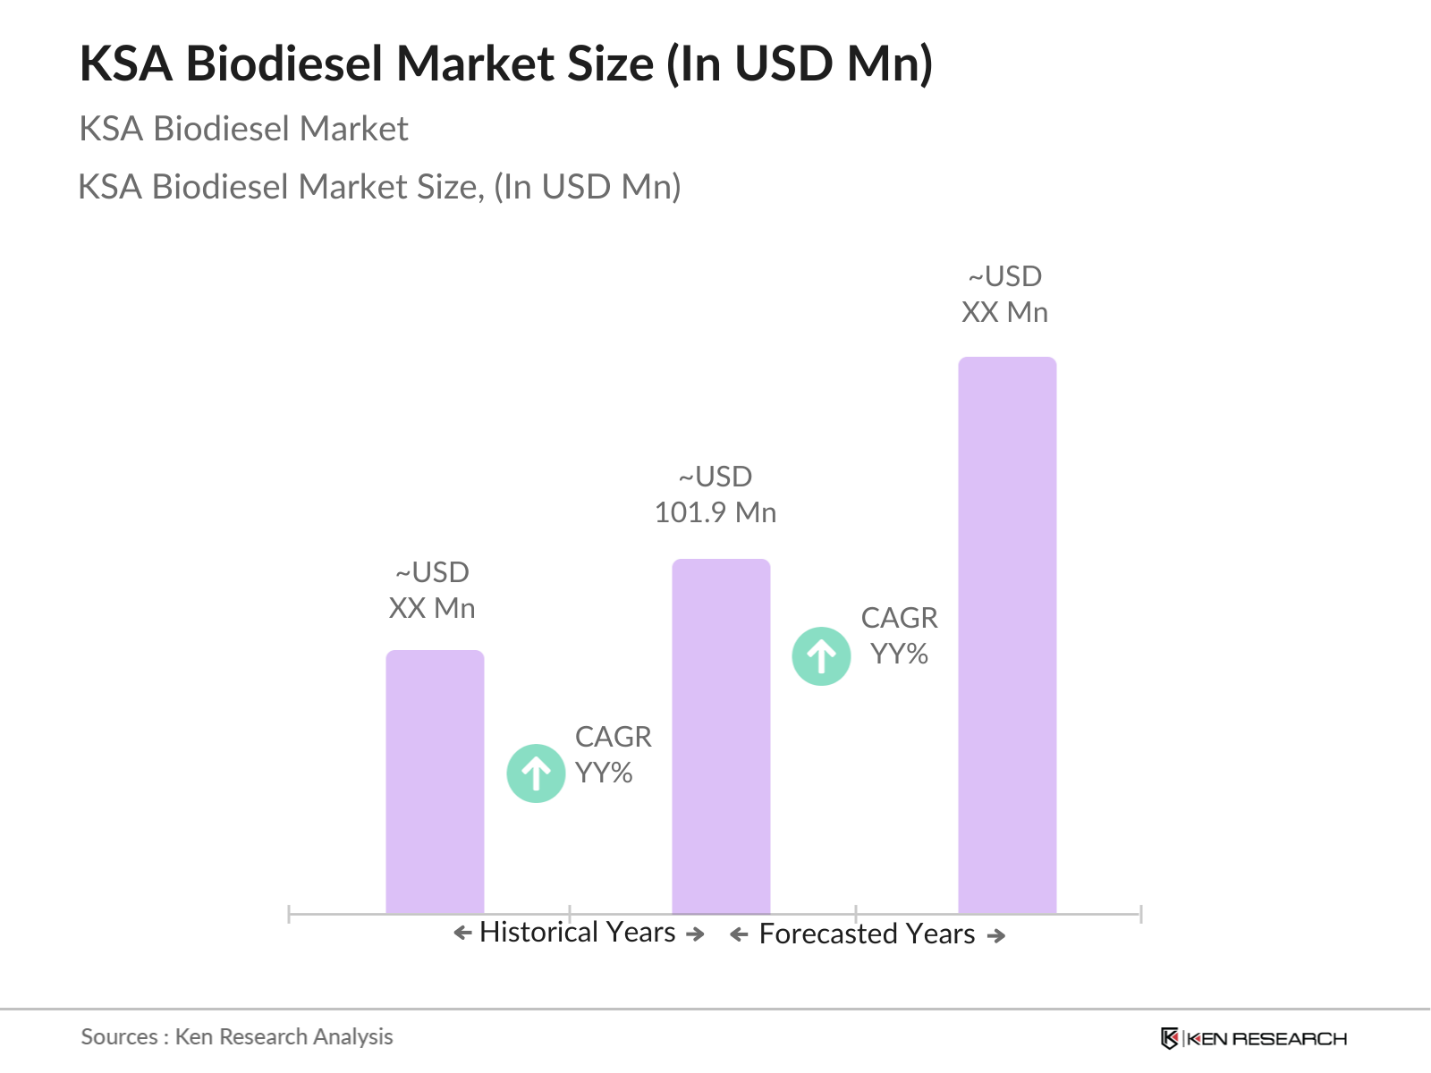
The KSA Biodiesel Market is projected to expand from USD 52 million in 2025 to USD 113 million by 2031, representing a forecast CAGR of 13.80%. Growth is expected to accelerate as formal used cooking oil collection improves, industrial buyers adopt verifiable carbon-reduction programs and fuel suppliers develop standardized B5, B20 and B100 offerings. The historical CAGR of 8.87% during 2020-2025 reflected gradual commercial adoption from a small base, limited collection density and concentrated domestic production. The next phase will depend on procurement commitments from logistics fleets, ports, construction companies and off-grid power users.
Volume is forecast to increase from approximately 57,000 tonnes in 2025 to 114,000 tonnes by 2031, while the modeled average selling price rises from USD 912 per tonne to USD 991 per tonne. Used cooking oil will remain the primary feedstock because it avoids direct competition with food production and supports circular-economy targets. Marine and industrial applications are expected to outpace road transport where nationwide blending obligations remain undeveloped. Investors should prioritize integrated collection networks, feedstock testing, storage, blending services and long-term offtake contracts rather than relying exclusively on spot B100 sales.
13.80%
Forecast CAGR
$113 Mn
2030 Projection
Base Year
2025
Historical Period
2020-2025
Forecast Period
2026-2031
Historical CAGR
8.87%
CHAPTER 2 - SCOPE OF REPORT
Scope of the Market
CHAPTER 3 - Key Stakeholders
Key Target Audience
Key stakeholders who can leverage from this market analysis for investment, strategy and operational planning.
Investors
CAGR, feedstock security, utilization, margins, capex, risk
Corporates
fuel cost, emissions, blending, procurement, certification, reliability
Government
waste diversion, compliance, fuel resilience, localization, emissions
Operators
collection density, yield, uptime, quality, storage, logistics
Financial institutions
project finance, offtake, covenants, utilization, feedstock risk
CHAPTER 4 - Market Size & Growth
Market Size, Growth Forecast and Trends
This section evaluates the historical market size, analyzes year-over-year growth dynamics, and presents forecast projections supported by market performance indicators and demand-side drivers.
Historical & Projected Market Size ($ Million)
Year-over-Year Growth Rate (%)
Market Value vs Volume Growth (%)
Historical Market Performance (2020-2025)
Historical growth accelerated after 2021 as commercial users moved from isolated trials toward structured procurement. The strongest annual expansion occurred in 2025, when market value increased 10.64% and modeled volume reached 57,000 tonnes. Growth was supported by tighter used cooking oil collection practices, greater availability of certified B100 and rising interest from construction, logistics and industrial operators. The principal constraint was limited production diversity, with domestic refining capacity concentrated among a small number of suppliers and feedstock collectors.
Forecast Market Outlook (2026-2031)
Forecast growth is expected to remain above 13% annually as collection density improves and fuel buyers adopt multi-year carbon-reduction targets. Market volume is projected to double to approximately 114,000 tonnes by 2031, while average selling prices rise through quality certification, pretreatment costs and higher demand for traceable waste-derived feedstock. Marine, off-grid power and heavy industrial applications should account for a growing proportion of incremental demand because these customers can adopt controlled blends without waiting for a nationwide road-fuel mandate.
CHAPTER 5 - Market Data
Market Breakdown
The KSA Biodiesel Market is transitioning from a specialist waste-recovery activity into a structured lower-carbon fuel category. For investors, value creation is increasingly linked to feedstock access, certification and contracted utilization rather than installed capacity alone.
Year | Market Size (USD Mn) | YoY Growth (%) | Biodiesel Volume (000 Tonnes) | Average Selling Price (USD/Tonne) | UCO-Derived Share (%) | Period |
|---|---|---|---|---|---|---|
| 2020 | $34 Mn | +- | 40 | 850 | Forecast | |
| 2021 | $36 Mn | +5.88% | 42 | 857 | Forecast | |
| 2022 | $39 Mn | +8.33% | 45 | 867 | Forecast | |
| 2023 | $43 Mn | +10.26% | 49 | 878 | Forecast | |
| 2024 | $47 Mn | +9.30% | 53 | 887 | Forecast | |
| 2025 | $52 Mn | +10.64% | 57 | 912 | Forecast | |
| 2026 | $59 Mn | +13.46% | 64 | 922 | Forecast | |
| 2027 | $67 Mn | +13.56% | 72 | 931 | Forecast | |
| 2028 | $76 Mn | +13.43% | 81 | 938 | Forecast | |
| 2029 | $87 Mn | +14.47% | 91 | 956 | Forecast | |
| 2030 | $99 Mn | +13.79% | 102 | 971 | Forecast | |
| 2031 | $113 Mn | +14.14% | 114 | 991 | Forecast |
Biodiesel Volume
57,000 tonnes, 2025, KSA. Volume expansion determines plant utilization and feedstock procurement requirements. The domestic producer has publicly described plans to multiply refining capacity, indicating that future supply growth will require materially larger collection networks.
Average Selling Price
USD 912 per tonne, 2025, KSA. Pricing reflects feedstock quality, pretreatment intensity, certification and delivery terms. Four nationally specified B100 grades create scope for differentiated pricing based on sulfur limits and operational requirements.
UCO-Derived Share
78%, 2025, KSA. Used cooking oil provides the most scalable near-term feedstock pool because collection can be integrated with hospitality and industrial kitchens. The leading producer reports exclusive reliance on recycled used cooking oil for its biofuel output.
CHAPTER 6 - Segmentation
Market Segmentation Framework
Comprehensive analysis across key dimensions providing insights into market structure, buyer preferences and distribution patterns.
No of Segments
7
Dominant Segment
Feedstock
Fastest Growing Segment
Application
Feedstock
Blend Type
Application
End User
Sales Channel
Technology
Geography
Key Segmentation Takeaways
Comprehensive analysis across all extracted segmentation dimensions provides insights into market structure, buyer requirements and distribution economics.
Feedstock
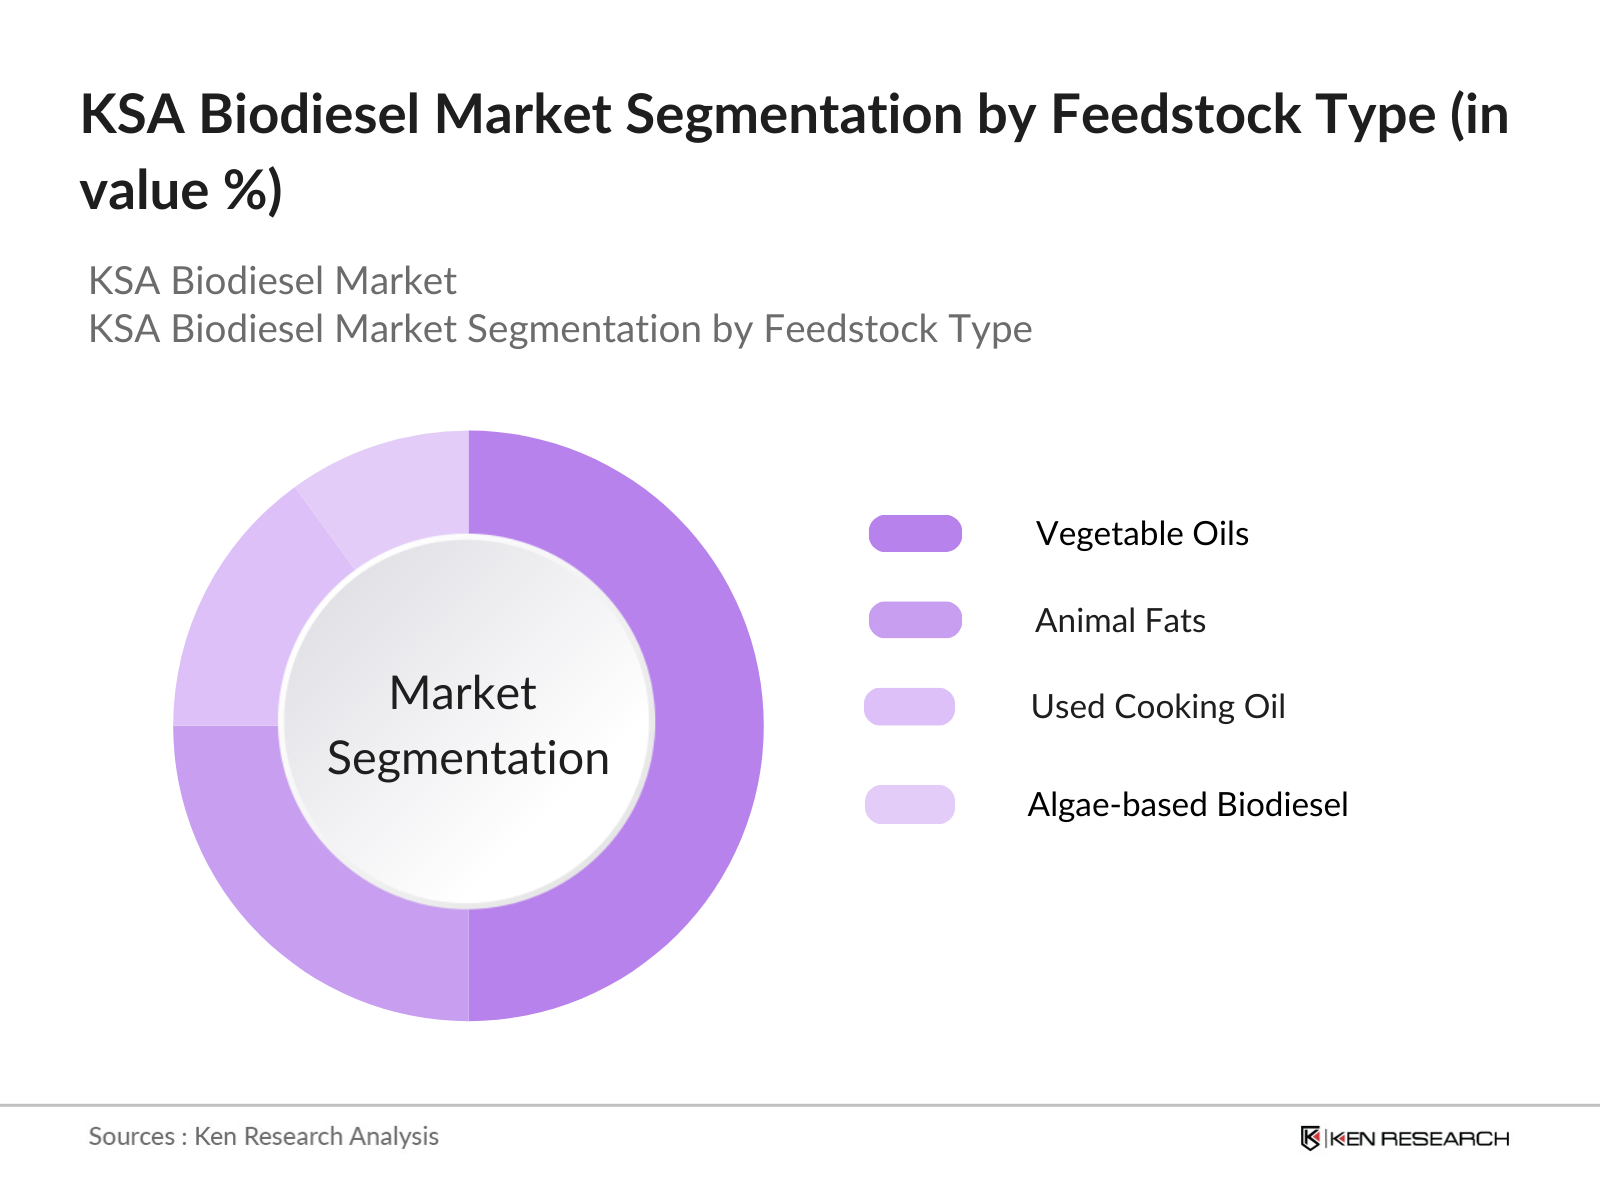
Feedstock is the dominant segmentation dimension because access to traceable, low-cost lipids determines plant utilization and gross margin. Used Cooking Oil is the largest Level-2 segment, supported by high-density restaurant, hotel, shopping mall and industrial kitchen clusters. Operators with exclusive or long-duration collection agreements gain a structural cost advantage over processors purchasing oil from fragmented spot suppliers.
Application
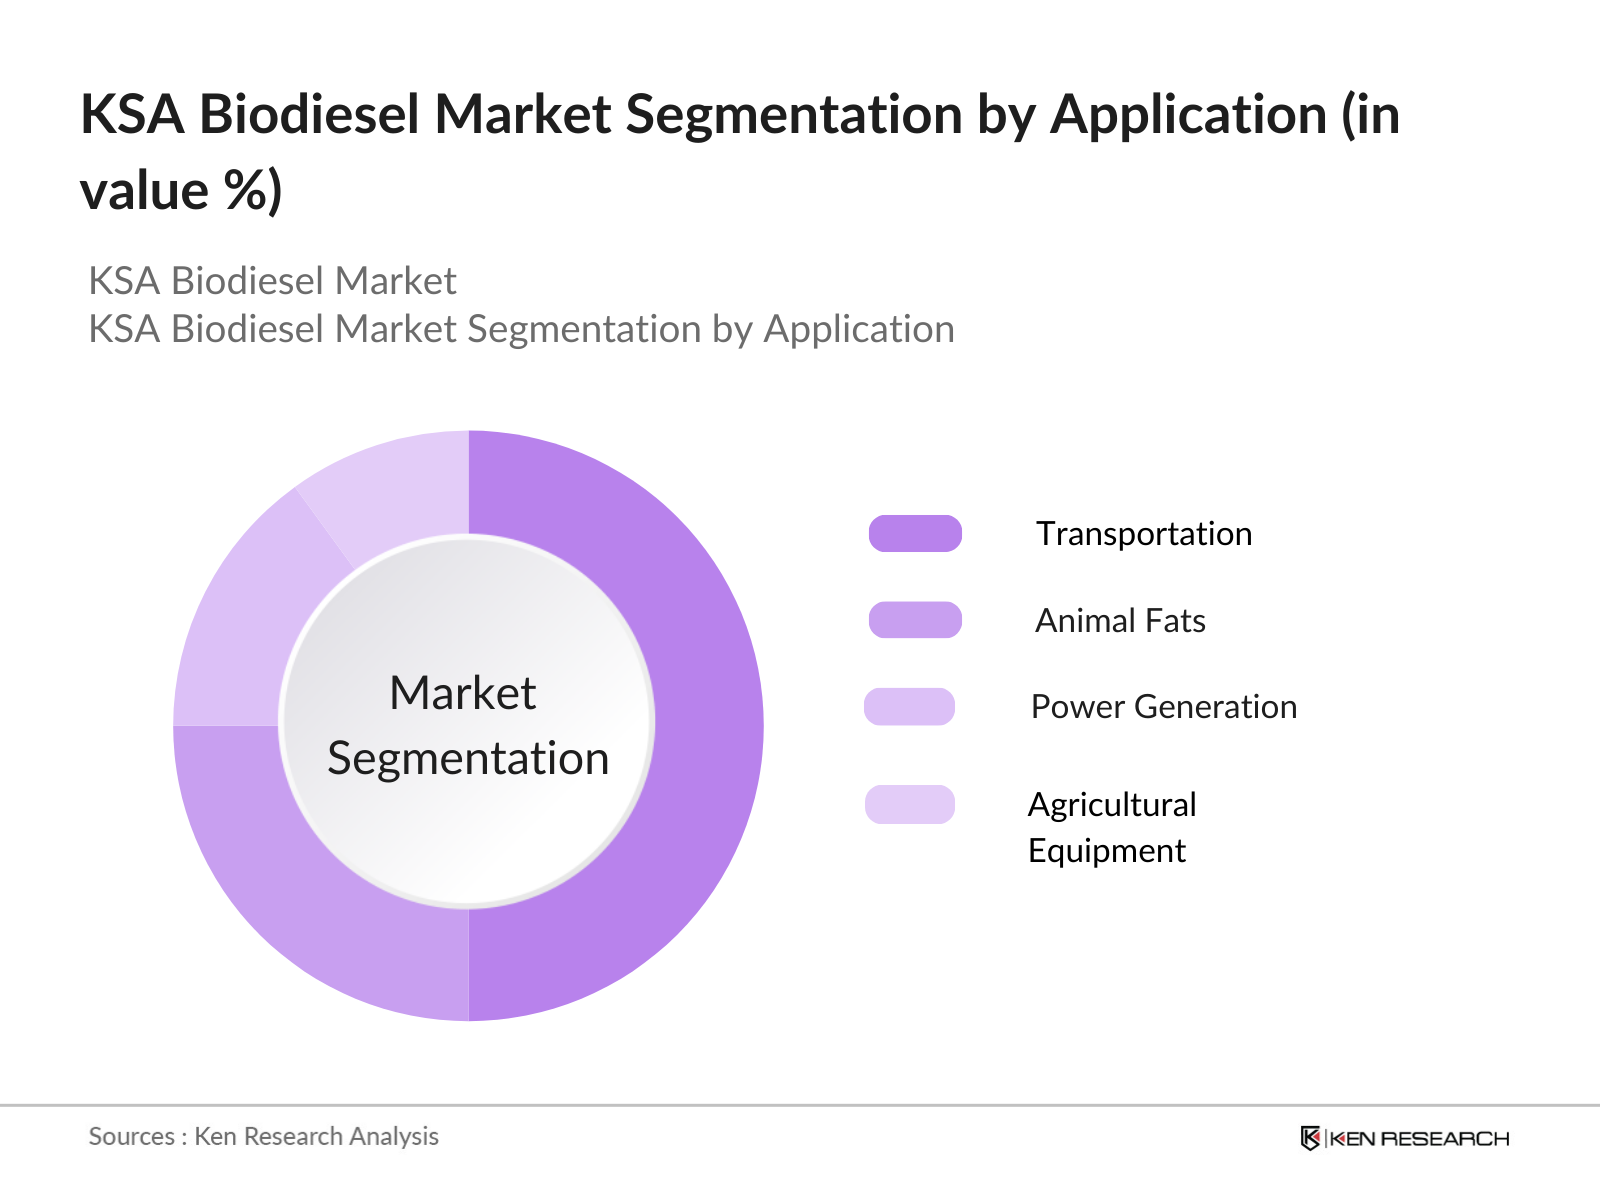
Application is the fastest-growing dimension as buyers move beyond demonstration projects. Marine Fuel is expected to be the fastest-growing Level-2 segment, followed by Off-Grid Power Generation, because ports, industrial sites and project operators can implement controlled blends under centralized procurement. These use cases provide measurable emissions reductions without requiring immediate changes across the nationwide retail fuel network.
CHAPTER 7 - Regional Analysis
Regional Analysis
Saudi Arabia ranks behind the UAE and Turkey but ahead of Oman and Qatar within the selected peer set. Its competitive position is supported by a large diesel-consuming fleet, industrial clusters and an emerging regulatory framework for B100 quality and used cooking oil collection.
Focus Country Ranking
3rd
Focus Country Market Size
USD 52 Mn
KSA CAGR (2026-2031)
13.80%
Focus Country Ranking
3rd
Focus Country Market Size
USD 52 Mn
KSA CAGR (2026-2031)
13.80%
Regional Analysis (Current Year)
Market Position
Saudi Arabia ranks third among selected peers, with a modeled 2025 market size of USD 52 million and a vehicle base exceeding 15.8 million units.
Growth Advantage
KSA's 13.80% forecast CAGR is higher than the modeled UAE rate of 12.20% and Turkey rate of 10.40%, positioning the Kingdom as the peer set's growth leader.
Competitive Strengths
Competitive advantages include four nationally specified B100 grades, an established Jubail producer and formal 2025 used cooking oil collection requirements supporting feedstock traceability.
CHAPTER 8 - INDUSTRY ANALYSIS
Growth Drivers, Challenges & Opportunities
Comprehensive analysis of key factors shaping the KSA Biodiesel Market, including growth catalysts, operational challenges and emerging opportunities across production, distribution and end-user segments.
Growth Drivers
Large Addressable Diesel Consumption Base
- Fleet operators can introduce B5 and B20 through centralized depots, creating recurring demand without immediately modifying the national retail network; registered vehicles increased 6.9% in 2024 (KSA).
- Gas and diesel oil imports reached 33 million barrels in 2023 (KSA), indicating room for domestically produced waste-derived fuel to displace a portion of incremental imports.
- Transport, storage and communications activity expanded 4.5% in 2024 (KSA), increasing freight movement and fuel demand for logistics operators capable of adopting certified blends.
Formalization of Used Cooking Oil Recovery
- Commercial kitchens, restaurants, malls and hotels represent concentrated collection points, reducing route costs and enabling processors to secure predictable monthly feedstock volumes.
- The leading domestic producer reports that its biodiesel is produced exclusively from recycled used cooking oil (current, KSA), demonstrating an established circular feedstock pathway.
- Formal collection keeps waste oil outside sewers and landfills while creating a monetizable input for refiners, improving economics for collectors, municipalities and fuel producers.
Industrial and Lower-Carbon Fuel Investment
- The partnership targets an Eastern Province facility, strengthening local demand for feedstock pretreatment, quality testing, storage and logistics services.
- Saudi Arabia's aircraft fleet reached 361 aircraft in 2024 (KSA), supporting broader investment in sustainable liquid-fuel capability and transferable processing infrastructure.
- Passenger traffic reached 140.9 million in 2025 (KSA), increasing the strategic importance of low-carbon fuels and waste-derived lipid supply chains.
Market Challenges
Absence of a Nationwide Minimum Blend Obligation
- Without a disclosed nationwide minimum biodiesel blend, producers depend on voluntary fleet, marine and industrial contracts, increasing sales-cycle duration and demand uncertainty.
- Conventional diesel benefits from mature refining, distribution and storage infrastructure, requiring biodiesel suppliers to demonstrate total-cost and emissions benefits for each customer.
- OEM warranty compatibility becomes more important above low blend levels, making technical testing, customer training and engine-specific approvals necessary for broader B20 adoption.
Fragmented Feedstock Collection
- Water, food particles and variable free-fatty-acid content increase pretreatment costs and can reduce yield, directly affecting gross margin and plant throughput.
- Collectors require sealed containers, scheduled pickups, documentation and staff training, increasing customer acquisition and service costs before feedstock volumes become economical.
- Updated 2025 collection requirements (KSA) improve market quality but raise compliance requirements for smaller informal collectors.
Production Concentration and Scale Risk
- Limited producer diversity reduces redundancy for large fleet buyers that require guaranteed volumes, multiple delivery locations and contingency supply arrangements.
- Capacity expansion requires coordinated investment in pretreatment, methanol handling, storage, quality laboratories and feedstock collection rather than reactor capacity alone.
- New projects must compete with sustainable aviation fuel and export demand for the same used cooking oil and animal-fat feedstocks, potentially increasing procurement costs.
Market Opportunities
Contracted B5 and B20 Fleet Programs
- Producers can bundle biodiesel, blending, storage, testing and carbon reporting into multi-year fuel-service contracts.
- Logistics operators, municipal fleets and construction companies gain measurable fuel-transition progress without replacing diesel assets.
- Fleet trials must demonstrate engine compatibility, predictable cold-flow performance and transparent lifecycle emissions documentation.
Marine and Industrial Decarbonization
- Port bunkering, remote generators and industrial boilers can support premium pricing for certified, delivered and application-specific blends.
- Ports, vessel operators, mining companies and project contractors can lower reported fuel emissions using existing combustion equipment.
- Suppliers need coastal storage, mobile blending, customer-specific fuel testing and dependable high-volume delivery capability.
Integrated UCO-to-Fuel Ecosystems
- Integrated operators can generate revenue from collection services, feedstock sales, biodiesel, glycerin and certification-linked exports.
- Waste companies, refiners, hospitality groups and energy investors capture value from materials previously treated as disposal liabilities.
- Digital chain-of-custody systems and harmonized sustainability certification must connect collection points with domestic and export offtakers.
CHAPTER 9 - Competitive Landscape
Competitive Landscape Overview
The market remains highly concentrated in domestic refining, while competition is broader across feedstock collection, waste management, fuel distribution, technology and prospective sustainable-fuel projects.
Market Share Distribution
Top 5 Players
Market Dynamics
8 new entrants in the past 5 years, indicating strong market attractiveness and growth potential.
Company Name | Market Share | Headquarters | Founding Year | Core Market Focus |
|---|---|---|---|---|
The Biofuel Company Ltd | - | Jubail, Saudi Arabia | - | UCO collection, B100 production and industrial fuel supply |
Bioenergy Arabia | - | Saudi Arabia | - | Waste cooking oil conversion and biodiesel development |
Saudi Arabian Oil Company | - | Dhahran, Saudi Arabia | 1933 | Advanced fuels, blending capability and sustainable-fuel development |
Saudi Investment Recycling Company | - | Riyadh, Saudi Arabia | 2017 | Organic waste recovery and sustainable feedstock development |
TotalEnergies SE | - | Courbevoie, France | 1924 | Biofuels technology, refining and sustainable-fuel partnerships |
Moeve | - | Madrid, Spain | 1929 | Renewable fuels, certified feedstock and international offtake |
BEEAH Group | - | Sharjah, UAE | 2007 | Waste collection, resource recovery and regional circular-economy services |
Averda | - | Dubai, UAE | - | Commercial waste collection and resource-management services |
Veolia | - | Paris, France | 1853 | Industrial waste services and resource recovery |
Lootah Biofuels | - | Dubai, UAE | - | Used cooking oil collection and regional biodiesel supply |
Cross Comparison Parameters
The report provides detailed cross-comparison of key players across 10 performance parameters to identify competitive strengths and weaknesses.
Analysis Covered
Market Share Analysis:
Evaluates concentration across producers, collectors, distributors and project developers
Cross Comparison Matrix:
Benchmarks feedstock security, capacity, revenue growth and profitability performance
SWOT Analysis:
Assesses competitive advantages, operational gaps, threats and expansion options
Pricing Strategy Analysis:
Compares contract structures, blend premiums, logistics and certification costs
Company Profiles:
Reviews market focus, operating footprint, partnerships and strategic positioning
CHAPTER 10 - REPORT TOC
Table of Contents
Market Assessment Phase
Supply-side and competitive intelligence covering market sizing, segmentation, competitive dynamics, regulatory landscape, and future forecasts.
Go-To-Market Strategy Phase
15 chapters
Entry strategy evaluation, execution roadmap, partner recommendations, and profitability outlook.
Survey Phase
8 chapters
Demand-side primary research conducted through structured interviews and online surveys with end users across priority metros and Tier 2/3 cities to capture consumption behavior, unmet needs, and purchase drivers.
Complete Report Coverage
201+ detailed sections covering every aspect of the market
143
Assessment Sections
58
Strategy Sections
CHAPTER 11 - Our Approach
Research Methodology
Desk Research
- Reviewed national diesel consumption statistics
- Mapped used cooking oil regulations
- Assessed biodiesel quality specifications
- Screened producer and collector footprints
Primary Research
- Interviewed biodiesel plant operations directors
- Consulted used-oil collection managers
- Engaged fleet fuel procurement heads
- Interviewed marine sustainability managers
Validation and Triangulation
- Validated across 310 market respondents
- Reconciled feedstock and output volumes
- Benchmarked pricing across customer applications
- Tested utilization under three scenarios
CHAPTER 12 - FAQ
FAQs
Still have questions?
Our research team is here to help you find the right solution
CHAPTER 13 - Related Research
Explore Related Reports
Expand your market intelligence with complementary research across regions and adjacent markets.
Regional/Country ReportsRelated market analysis across key regions
Related market analysis across key regions
- Indonesia Biodiesel Market Size, Share & Forecast, By Feedstock, Blend Type & End User, 2026-2031
- Vietnam Biodiesel Market Size, Share & Forecast, By Feedstock, Blend Type & End User, 2026-2031
- Thailand Biodiesel Market Size, Share & Forecast, By Feedstock, Blend Type & End User, 2026-2031
- Malaysia Biodiesel Market Size, Share & Forecast, By Feedstock, Blend Type & End User, 2026-2031
- Philippines Biodiesel Market Size, Share & Forecast, By Feedstock, Blend Type & End User, 2026-2031
Adjacent ReportsRelated markets and complementary research
Related markets and complementary research
- Germany Biodiesel Feedstock Market
- Oman Used Cooking Oil Collection Market
- Malaysia Sustainable Fuel Production Market
- Kuwait Carbon Reduction Technology Market
- UAE Recycling Services Market
500+
Market Research Reports
50+
Countries Covered
15+
Industry Verticals