CHAPTER 1 - MARKET SUMMARY
Market Overview
The Saudi Arabia MICE Market connects event organizers, venues, destination-management companies, hotels, airlines and technical-production suppliers around business gatherings that generate organizer fees, venue rental, sponsorship, exhibition-space sales and delegate services. Approximately 17,000 qualifying business events were held in 2025, creating recurring demand from corporations, ministries, associations and international exhibitors seeking market access, procurement leads and stakeholder engagement.
Riyadh is the market's principal commercial hub because it concentrates government institutions, regional headquarters, convention assets and large corporate buyers. The Central Region represented approximately 42.12% of national MICE revenue in 2025. This concentration improves organizer economics through higher sponsor density and executive attendance, although venue congestion and hotel compression during peak event weeks can increase fulfillment costs.
Market Value
USD 3,220 million
2025
Dominant Region
Central Region
2025
Dominant Segment
Exhibitions and Trade Shows
fastest growing, 2025
Total Number of Players
480
Future Outlook
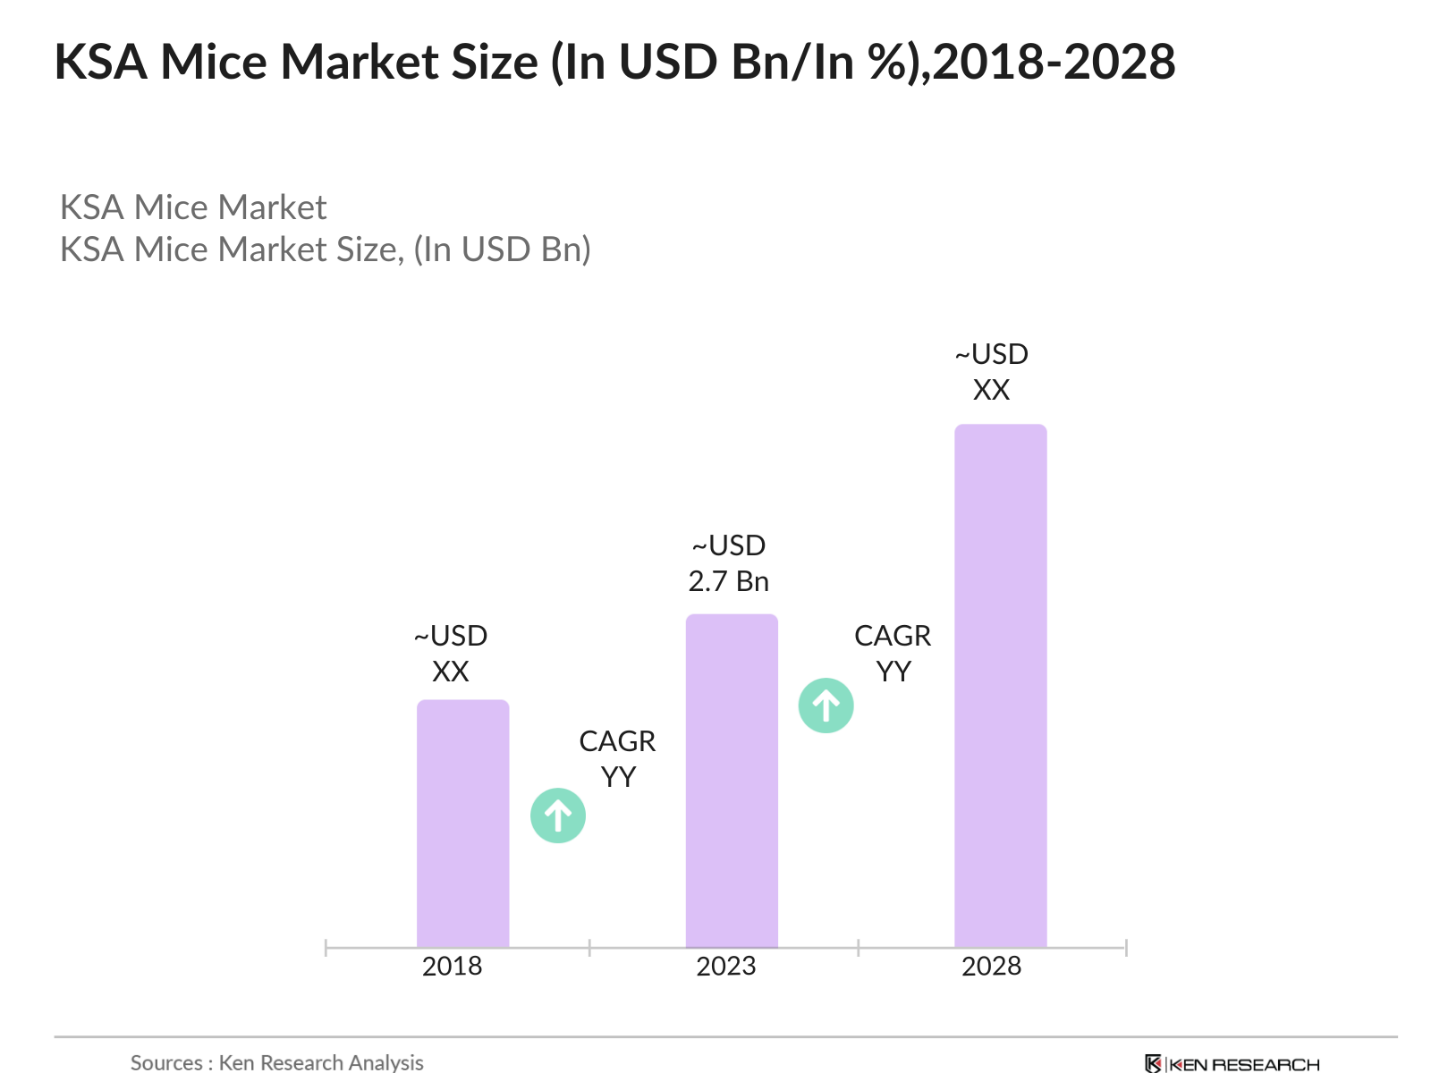
The Saudi Arabia MICE Market is projected to expand from USD 3,220 million in 2025 to USD 5,655 million by 2031. Forecast growth of 9.82% annually follows a 24.95% historical CAGR during 2020-2025, when reopening, government-led event activation and tourism investment drove rapid recovery. Future growth is expected to be more balanced, combining higher event volumes with premium exhibition formats, international congresses and destination-based incentive travel. Expansion of aviation links, accredited venues and licensed accommodation will increase addressable delegate capacity, while organizer-owned intellectual property will allow leading operators to capture recurring sponsorship and exhibition-space revenue.
Riyadh will remain the primary revenue center, supported by government procurement, regional-headquarters activity and the Expo 2030 pipeline. Jeddah will retain a strong role in healthcare, logistics, tourism and pilgrimage-linked conferences, while AlUla, the Red Sea and other destination projects will broaden incentive-travel demand. The highest-value profit pools will shift toward sector-specific exhibitions, hosted-buyer programs, event technology, audience analytics and integrated venue-hotel packages. Execution risks include competition from Dubai and Doha, event-calendar congestion, specialized workforce shortages and uneven demand outside major cities. Operators with proprietary event brands, international sales networks and local licensing expertise will be best positioned.
9.82%
Forecast CAGR
$5,655 Mn
2030 Projection
Base Year
2025
Historical Period
2020-2025
Forecast Period
2026-2031
Historical CAGR
24.95%
CHAPTER 2 - SCOPE OF REPORT
Scope of the Market
CHAPTER 3 - Key Stakeholders
Key Target Audience
Key stakeholders who can leverage from this market analysis for investment, strategy, and operational planning.
Investors
CAGR, venue yield, capex intensity, event-brand scalability, margins
Corporates
delegate reach, sponsorship ROI, procurement cost, lead conversion
Government
destination ranking, localization, visitor spend, venue utilization, compliance
Operators
floor-space yield, attendance, renewal rate, production efficiency, utilization
Financial institutions
project finance, cash flow, covenants, demand stability, utilization
CHAPTER 4 - Market Size & Growth
Market Size, Growth Forecast and Trends
This section evaluates the historical market size, analyzes year-over-year growth dynamics, and presents forecast projections supported by market performance indicators and demand-side drivers.
Historical & Projected Market Size ($ Million)
Year-over-Year Growth Rate (%)
Market Value vs Volume Growth (%)
Historical Market Performance (2020-2025)
The market's trough occurred in 2020 as restrictions reduced international travel, venue utilization and physical exhibition activity. Recovery accelerated in 2021 and 2022, when event volume increased by 37.7% and 33.3%, respectively. A structural inflection appeared after 2023 as growth shifted from reopening toward premiumization. Revenue per event rose by 5.6% in 2024 and 8.3% in 2025, supported by larger exhibition footprints, higher sponsorship values, hosted-buyer programs and government-backed sector platforms. Demand remained concentrated in Riyadh, but Jeddah and destination-based programs broadened national participation.
Forecast Market Outlook (2026-2031)
Forecast growth is expected to stabilize near 9.82% annually as the market moves from recovery into planned capacity expansion. Qualifying event volume is projected to rise from approximately 17,000 in 2025 to 26,700 in 2031, while average revenue per event increases from approximately USD 189,000 to USD 212,000. Exhibitions, international congresses and destination-management packages should outpace routine corporate meetings because these formats generate stronger sponsorship, floor-space and delegate-spending economics. Expo 2030, improved international air connectivity and expanded hotel inventory provide the principal acceleration mechanisms through the forecast horizon.
CHAPTER 5 - Market Data
Market Breakdown
The Saudi Arabia MICE Market is transitioning from recovery-led volume growth to a more durable combination of event expansion, venue investment and higher monetization per delegate. The operating KPI trajectory is relevant to investors because it indicates where capacity, pricing power and event-brand ownership will create defensible returns.
Year | Market Size (USD Mn) | YoY Growth (%) | Qualifying Business Events | Accredited Venues | International Air Passengers (Mn) | Period |
|---|---|---|---|---|---|---|
| 2020 | $1,056 Mn | +- | 6,100 | 410 | Forecast | |
| 2021 | $1,438 Mn | +36.17% | 8,400 | 470 | Forecast | |
| 2022 | $1,855 Mn | +29.00% | 11,200 | 545 | Forecast | |
| 2023 | $2,253 Mn | +21.46% | 13,600 | 789 | Forecast | |
| 2024 | $2,659 Mn | +18.02% | 15,200 | 870 | Forecast | |
| 2025 | $3,220 Mn | +21.10% | 17,000 | 923 | Forecast | |
| 2026 | $3,540 Mn | +9.94% | 18,300 | 980 | Forecast | |
| 2027 | $3,888 Mn | +9.83% | 19,800 | 1,040 | Forecast | |
| 2028 | $4,270 Mn | +9.83% | 21,400 | 1,105 | Forecast | |
| 2029 | $4,689 Mn | +9.81% | 23,100 | 1,175 | Forecast | |
| 2030 | $5,149 Mn | +9.81% | 24,900 | 1,250 | Forecast | |
| 2031 | $5,655 Mn | +9.83% | 26,700 | 1,330 | Forecast |
Qualifying Business Events
approximately 17,000 events, 2025, Saudi Arabia. Event-brand ownership and repeat frequency determine organizer revenue visibility. SCEGA reported that annual business-event activity had reached roughly 17,000 events, indicating a sufficiently broad pipeline for specialized production, registration and sponsorship providers.
Accredited Venues
923 venues, 2025, Saudi Arabia. Venue expansion reduces capacity constraints but increases competition for event calendars and anchor tenants. SCEGA reported 32% annual capacity growth across the accredited venue network, supporting more simultaneous exhibitions and conferences outside the largest established facilities.
International Air Passengers
76 million passengers, 2025, Saudi Arabia. International delegate access is becoming a stronger market-volume driver and broadens exhibitor participation. Saudi airports handled 140.9 million total passengers in 2025, increasing the viability of recurring regional conferences and incentive programs.
CHAPTER 6 - Segmentation
Market Segmentation Framework
Comprehensive analysis across key dimensions providing insights into market structure, consumer preferences, and distribution patterns.
No of Segments
7
Dominant Segment
Service Type
Fastest Growing Segment
Delivery Model
Service Type
Customer Type
End-Use Industry
Delivery Model
Business Model
Channel
Geography
Key Segmentation Takeaways
Comprehensive analysis across all extracted segmentation dimensions providing insights into market structure, consumer preferences, and distribution patterns.
Service Type
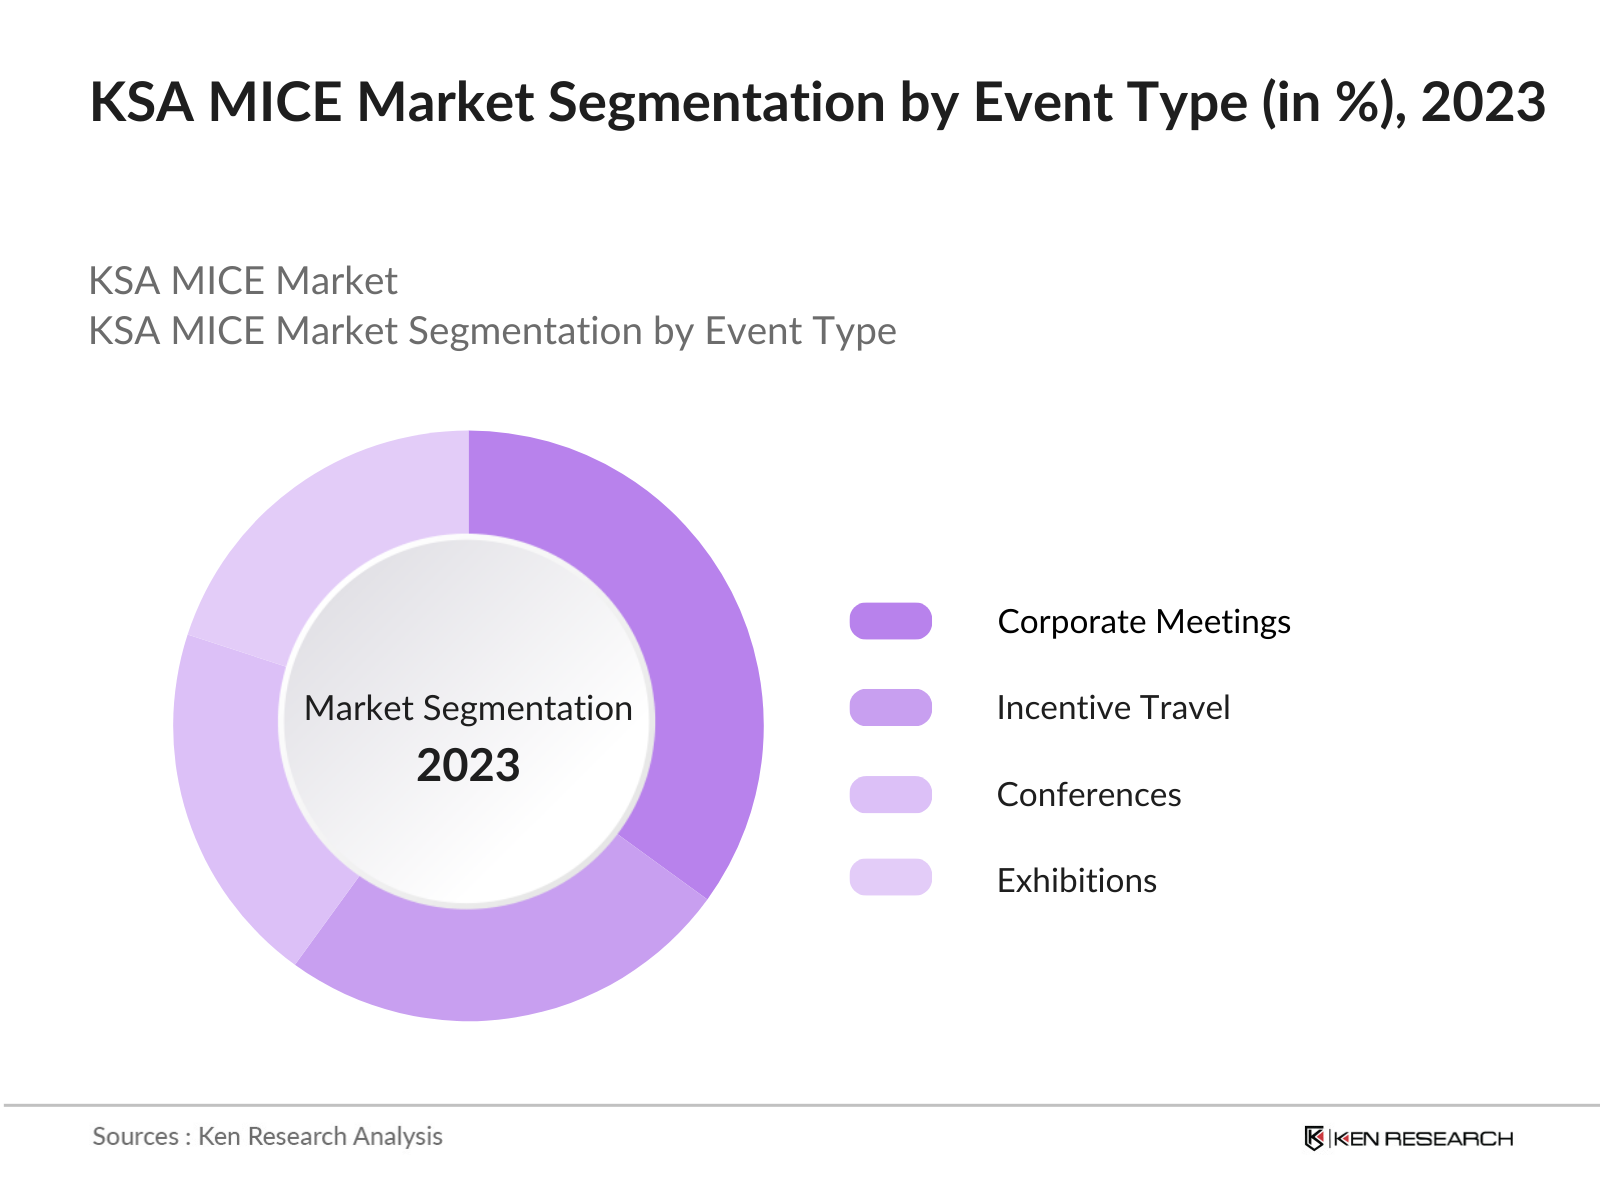
Service type is the dominant segmentation dimension because event format determines venue requirements, delegate economics, sponsorship potential and organizer margins. Conferences and congresses provide predictable delegate and registration revenue, while exhibitions and trade shows generate the strongest combined floor-space, sponsorship and lead-generation monetization. Routine meetings remain numerous but generally have lower average revenue and shorter booking cycles.
Delivery Model
Delivery model is the fastest-growing dimension as organizers add live-streaming, digital matchmaking, mobile registration and post-event content access to physical events. Hybrid events are the fastest-growing Level-2 segment because they extend audience reach without eliminating venue revenue. Operators that integrate attendee data, exhibitor lead scoring and digital content packages can create recurring revenue beyond the physical event dates.
CHAPTER 7 - Regional Analysis
Regional Analysis
Saudi Arabia ranked second among selected GCC MICE markets in 2025, behind the UAE and ahead of Qatar, Kuwait, Oman and Bahrain. Its scale reflects a large domestic corporate and government buyer base, while its stronger forecast growth is supported by venue expansion, aviation connectivity, tourism investment and an expanding regional-headquarters ecosystem.
Focus Country Ranking
2nd
Focus Country Market Size
USD 3,220 Mn
Saudi Arabia CAGR (2026-2031)
9.82%
Focus Country Ranking
2nd
Focus Country Market Size
USD 3,220 Mn
Saudi Arabia CAGR (2026-2031)
9.82%
Regional Analysis (Current Year)
Regional Analysis Comparison
Market Position
Saudi Arabia ranked second among selected GCC peers with a 2025 market value of USD 3,220 million, supported by its larger domestic buyer base and government-backed event pipeline.
Growth Advantage
Saudi Arabia's 9.82% forecast CAGR exceeds the UAE's 8.96% and Qatar's 8.39%, positioning the Kingdom as the GCC's strongest large-market growth challenger through 2031.
Competitive Strengths
The Kingdom combines 923 accredited venues, 76 million international air passengers and a 150 million-visit tourism target, providing scale across venues, delegate access and destination-led event demand.
CHAPTER 8 - INDUSTRY ANALYSIS
Growth Drivers, Challenges & Opportunities
Comprehensive analysis of key factors shaping the Saudi Arabia MICE Market, including growth catalysts, operational challenges, and emerging opportunities across production, distribution, and consumer segments.
Growth Drivers
Expansion of Venue, Hospitality and Aviation Capacity
- SCEGA reported a 32% increase in venue capacity (2025, Saudi Arabia), enabling organizers to operate larger concurrent calendars and create more sector-specific exhibition inventory.
- Licensed hospitality facilities reached 5,622 properties (Q3 2025, Saudi Arabia), improving room availability for multi-day conferences and increasing the feasibility of bundled delegate packages.
- Saudi airports handled 140.9 million passengers (2025, Saudi Arabia), including 76 million international passengers, expanding the addressable base for regional congresses, exhibitions and incentive travel.
Regional Headquarters and Corporate Buyer Formation
- Regional-headquarters licenses increased by 477% year on year (Q1 2024, Saudi Arabia), creating new demand for leadership summits, employee engagement, product launches and partner conferences.
- Approximately 350 multinational companies (2024, Saudi Arabia) had obtained regional-headquarters licenses, broadening the pool of corporate buyers requiring recurring event services and executive hospitality.
- Each qualifying regional headquarters is expected to maintain at least 15 full-time employees (2025, Saudi Arabia), including senior executives, concentrating decision-makers and supplier ecosystems in Riyadh.
Global Event and Tourism Pipeline
- Saudi Arabia recorded more than 123 million tourists (2025, Saudi Arabia), providing a larger hospitality and destination-services platform for international business events.
- Riyadh Expo is scheduled for October 2030 to March 2031 (Saudi Arabia), supporting venue development, supplier capability and international event-marketing expertise before and during the forecast terminal year.
- Saudi Arabia was confirmed as host of the 2034 FIFA World Cup (2024 decision, Saudi Arabia), sustaining long-cycle investment in venues, transport, accommodation and event operations beyond Expo 2030.
Market Challenges
Competition from Established GCC Meeting Hubs
- Dubai and Abu Dhabi together accounted for 87 association meetings (2023, UAE), providing international organizers with established bidding teams, repeat venue relationships and mature global sales networks.
- Qatar hosted 24 association meetings (2023, Qatar), exceeding Saudi Arabia despite its smaller population and corporate base, demonstrating the value of specialized convention-bureau bidding capability.
- Saudi organizers must overcome a market-recognition gap while protecting margins against destination incentives and venue packages offered by competing GCC hubs with longer international operating histories.
Specialized Workforce and Localization Constraints
- Tourism activities employed 1,009,691 people (Q3 2025, Saudi Arabia), but only 24.3% were Saudi nationals, increasing the importance of structured event-production and commercial-sales training.
- SCEGA introduced the Certified in Exhibition Management program (2025, Saudi Arabia) to strengthen specialized capability, but scaling accreditation across hundreds of organizers and venues requires sustained investment.
- Rapid venue expansion of 32% in one year (2025, Saudi Arabia) may outpace the availability of experienced show directors, sponsorship sellers, technical producers and crowd-management specialists.
Calendar Congestion and Uneven Geographic Utilization
- Hotel occupancy reached 49.1% in Q3 2025 (Saudi Arabia), but national quarterly averages can conceal sharp compression during flagship exhibitions, raising accommodation and delegate-logistics costs.
- The national network included 923 accredited venues (2025, Saudi Arabia), yet international demand remains concentrated in Riyadh and Jeddah, limiting utilization economics in smaller markets.
- Western Region demand is projected to grow at 28.03% annually through 2031 (Saudi Arabia), requiring synchronized investment in venues, air links, destination sales and specialist suppliers to prevent service bottlenecks.
Market Opportunities
International Association Congress Acquisition
- Congress bureaus can monetize bid preparation, destination marketing and local-host services by narrowing the gap with the UAE's 92 meetings (2023, UAE).
- Professional associations and NGOs are forecast to grow at 11.97% annually through 2031 (Saudi Arabia), benefiting convention centers, medical congress organizers, universities and specialist destination agencies.
- Materialization requires coordinated bidding support, academic ambassadors, transparent destination incentives and multi-year venue holds aligned with international association planning cycles.
Event Technology and Audience Data Monetization
- Registration, matchmaking, lead scoring and sponsored digital content can convert single-event transactions into annual platform subscriptions across a base of approximately 17,000 events (2025, Saudi Arabia).
- Exhibitors benefit from measurable lead quality, while organizers improve renewal rates by linking sponsorship pricing to verified audience engagement rather than physical branding alone.
- Commercial adoption requires interoperable registration systems, Arabic-English audience taxonomies, consent-based data governance and integration between venue access, mobile applications and exhibitor CRM platforms.
Destination-Led Incentive Travel and Secondary-City Events
- Destination-management companies can monetize accommodation, transport, experiences and executive retreats as the national tourism strategy targets 150 million visits by 2030 (Saudi Arabia).
- The Red Sea development is expected to add 8,000 hotel rooms by completion (Saudi Arabia), benefiting premium incentive planners, hospitality operators and experience providers.
- Scaling requires reliable destination air access, standardized service quality, licensed ground handlers and event calendars designed around climate, religious periods and local infrastructure capacity.
CHAPTER 9 - Competitive Landscape
Competitive Landscape Overview
The market combines government-backed Saudi platforms, established domestic production companies and international exhibition organizers. Entry barriers center on licensing, event intellectual property, venue access, sponsor relationships and dependable large-scale execution.
Market Share Distribution
Top 5 Players
Market Dynamics
8 new entrants in the past 5 years, indicating strong market attractiveness and growth potential.
Company Name | Market Share | Headquarters | Founding Year | Core Market Focus |
|---|---|---|---|---|
Tahaluf | - | Riyadh, Saudi Arabia | 2022 | Large-scale B2B exhibitions, conferences and sector platforms |
Sela | - | Jeddah, Saudi Arabia | 1997 | Major events, venue operations and destination experiences |
dmg events | - | Dubai, United Arab Emirates | - | Trade exhibitions across construction, energy and infrastructure |
Benchmark | - | Riyadh, Saudi Arabia | 2000 | Government, corporate and entertainment event production |
Riyadh Exhibitions Company | - | Riyadh, Saudi Arabia | 1980 | Industrial and commercial trade exhibitions |
Messe Frankfurt Middle East | - | Dubai, United Arab Emirates | - | International exhibition brands and B2B trade fairs |
RX Global | - | London, United Kingdom | - | International exhibitions, conferences and buyer platforms |
MCI Middle East | - | Dubai, United Arab Emirates | - | Congress management, corporate events and association services |
Semark | - | Riyadh, Saudi Arabia | - | Saudi event management, marketing and conference delivery |
Al Khaleejiah Advertising & PR | - | Riyadh, Saudi Arabia | - | Integrated corporate events, communications and brand activation |
Cross Comparison Parameters
The report provides detailed cross-comparison of key players across 10 performance parameters to identify competitive strengths and weaknesses.
Analysis Covered
Market Share Analysis:
Compares organizer revenue pools across Saudi business-event service categories.
Cross Comparison Matrix:
Benchmarks scale, monetization, margins and portfolio execution consistency across players.
SWOT Analysis:
Evaluates capabilities, vulnerabilities, growth options and competitive exposure by company.
Pricing Strategy Analysis:
Assesses venue, sponsorship, delegate and exhibition-space pricing architecture across competitors.
Company Profiles:
Reviews ownership, service portfolio, geographic presence and strategic positioning comprehensively.
CHAPTER 10 - REPORT TOC
Table of Contents
Market Assessment Phase
Supply-side and competitive intelligence covering market sizing, segmentation, competitive dynamics, regulatory landscape, and future forecasts.
Go-To-Market Strategy Phase
15 chapters
Entry strategy evaluation, execution roadmap, partner recommendations, and profitability outlook.
Survey Phase
8 chapters
Demand-side primary research conducted through structured interviews and online surveys with end users across priority metros and Tier 2/3 cities to capture consumption behavior, unmet needs, and purchase drivers.
Complete Report Coverage
201+ detailed sections covering every aspect of the market
143
Assessment Sections
58
Strategy Sections
CHAPTER 11 - Our Approach
Research Methodology
Desk Research
- Business-event permit and venue analysis
- Organizer portfolio and calendar mapping
- Aviation and hospitality capacity review
- Corporate buyer and association assessment
Primary Research
- Exhibition directors and show managers
- Convention venue commercial directors interviewed
- Corporate events procurement heads consulted
- Destination management executives interviewed
Validation and Triangulation
- 394 respondents across four cohorts
- Organizer revenues reconciled with calendars
- Venue capacity checked against utilization
- Delegate economics benchmarked across formats
CHAPTER 12 - FAQ
FAQs
Still have questions?
Our research team is here to help you find the right solution
CHAPTER 13 - Related Research
Explore Related Reports
Expand your market intelligence with complementary research across regions and adjacent markets.
Regional/Country ReportsRelated market analysis across key regions
Related market analysis across key regions
- Indonesia MICE Market Report, 2026-2031
- Vietnam MICE Market Report, 2026-2031
- Thailand MICE Market Report, 2026-2031
- Malaysia MICE Market Report, 2026-2031
- Philippines MICE Market Report, 2026-2031
Adjacent ReportsRelated markets and complementary research
Related markets and complementary research
- UAE Event Technology Market
- Singapore Destination Management Services Market
- South Africa Aviation Services Market
- Bahrain Exhibition and Trade Show Services Market
- KSA Corporate Travel Management Market
500+
Market Research Reports
50+
Countries Covered
15+
Industry Verticals