
Mexico Residential Real Estate Market Outlook to 2030
Region:Mexico
Author(s):Paribhasha Tiwari
Product Code:KROD5686
Region:Mexico
Author(s):Paribhasha Tiwari
Product Code:KROD5686
November 2024
88
The competitive landscape of the Mexico residential real estate market is dominated by a mix of large national players and international developers. Key players have established a strong foothold in the market by capitalizing on housing demand in high-growth urban areas and leveraging government housing initiatives. The market is dominated by both local developers, such as Casas GEO and Homex, and international firms like PulteGroup. These companies have developed a wide array of housing options, ranging from affordable units to luxury properties, to cater to Mexicos diverse housing needs. Local firms tend to focus on affordable housing projects in suburban areas, while international players emphasize high-end developments in urban centers.
|
Company |
Establishment Year |
Headquarters |
Total Number of Projects |
Focus on Affordable Housing |
Presence in Urban Centers |
Partnership with Govt Programs |
Revenue (2023) |
Number of Employees |
Sustainability Initiatives |
|
Casas GEO |
1973 |
Mexico City |
- | - | - | - | - | - | - |
|
Vinte Viviendas Integrales |
2001 |
Mexico City |
- | - | - | - | - | - | - |
|
Urbi Desarrollos Urbanos |
1981 |
Tijuana |
- | - | - | - | - | - | - |
|
PulteGroup |
1950 |
Atlanta, USA |
- | - | - | - | - | - | - |
|
Grupo Lar |
1965 |
Mexico City |
- | - | - | - | - | - | - |
Over the next five years, the Mexico residential real estate market is expected to show stable growth, driven by sustained government support through housing subsidies, continued infrastructure development, and increasing urbanization. The availability of low-interest mortgages, particularly for first-time home buyers, will likely continue to drive demand. Additionally, the demand for luxury properties in tourist-centric regions is expected to rise due to growing interest in second homes and investment properties among both domestic and foreign buyers.
|
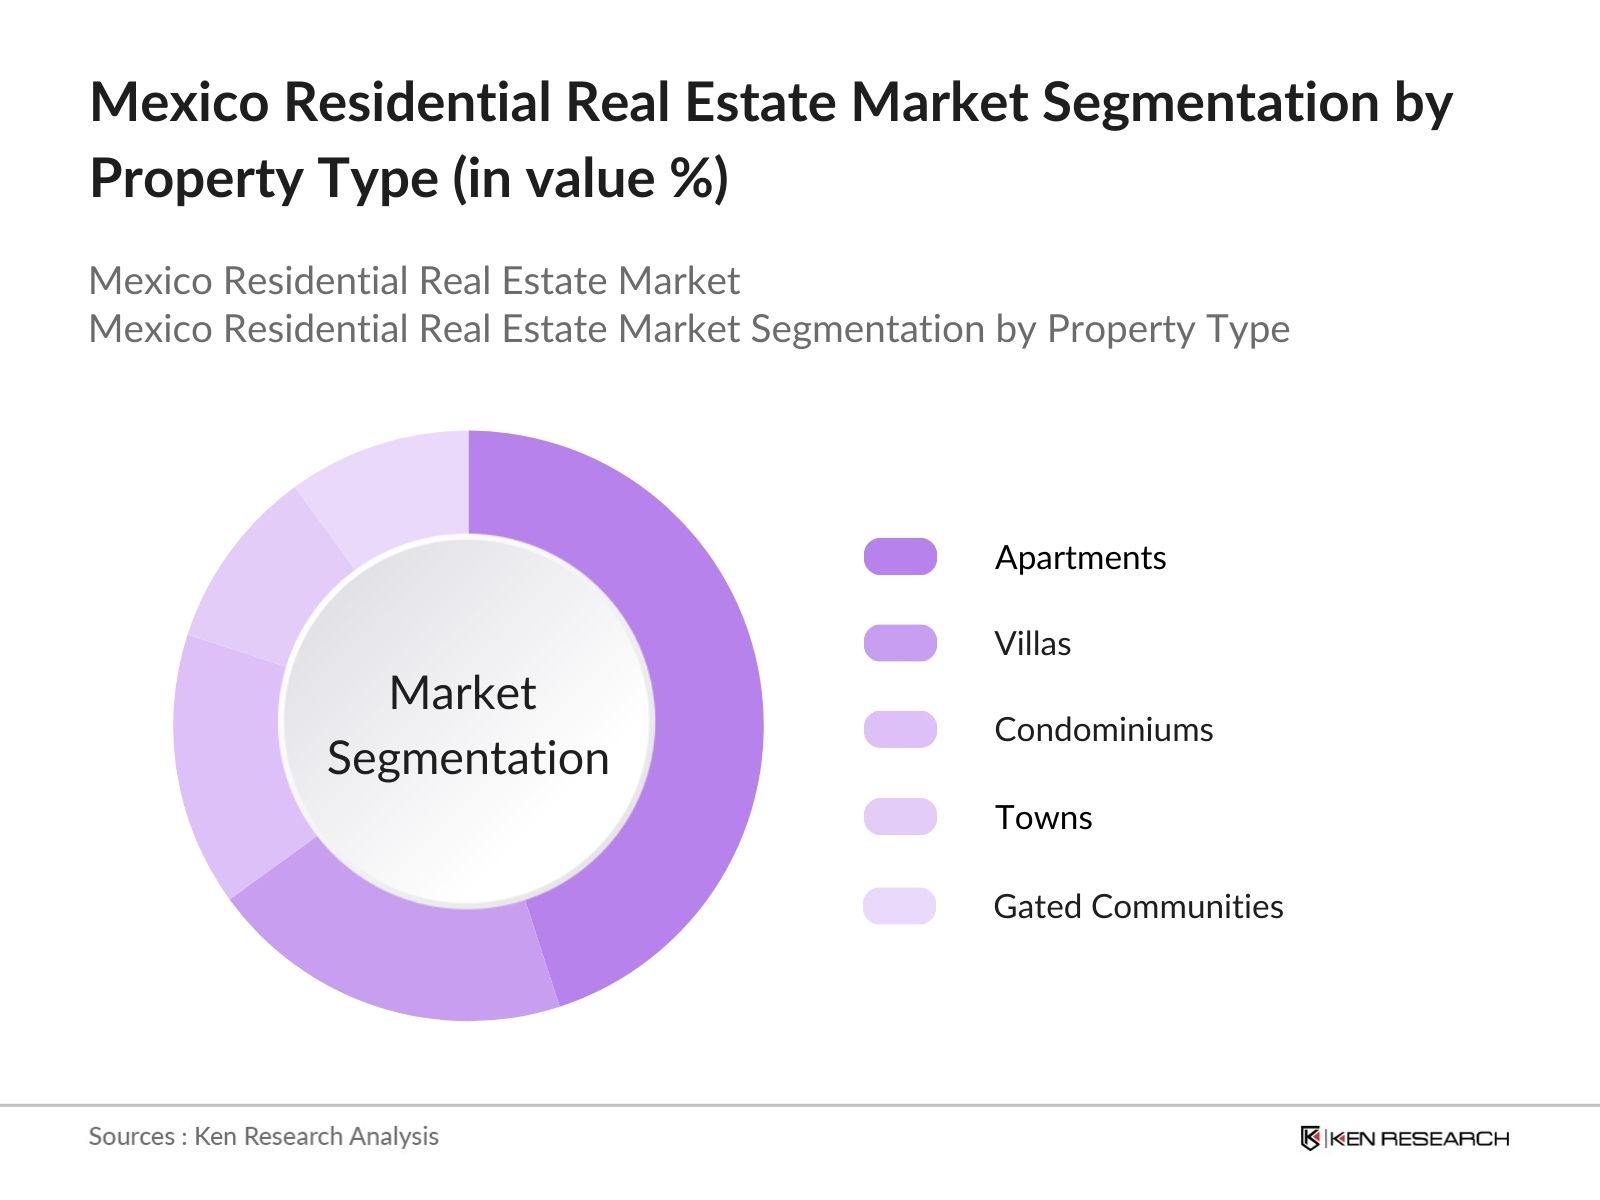
By Property Type |
Apartments Villas Condominiums Townhouses Gated Communities |
|
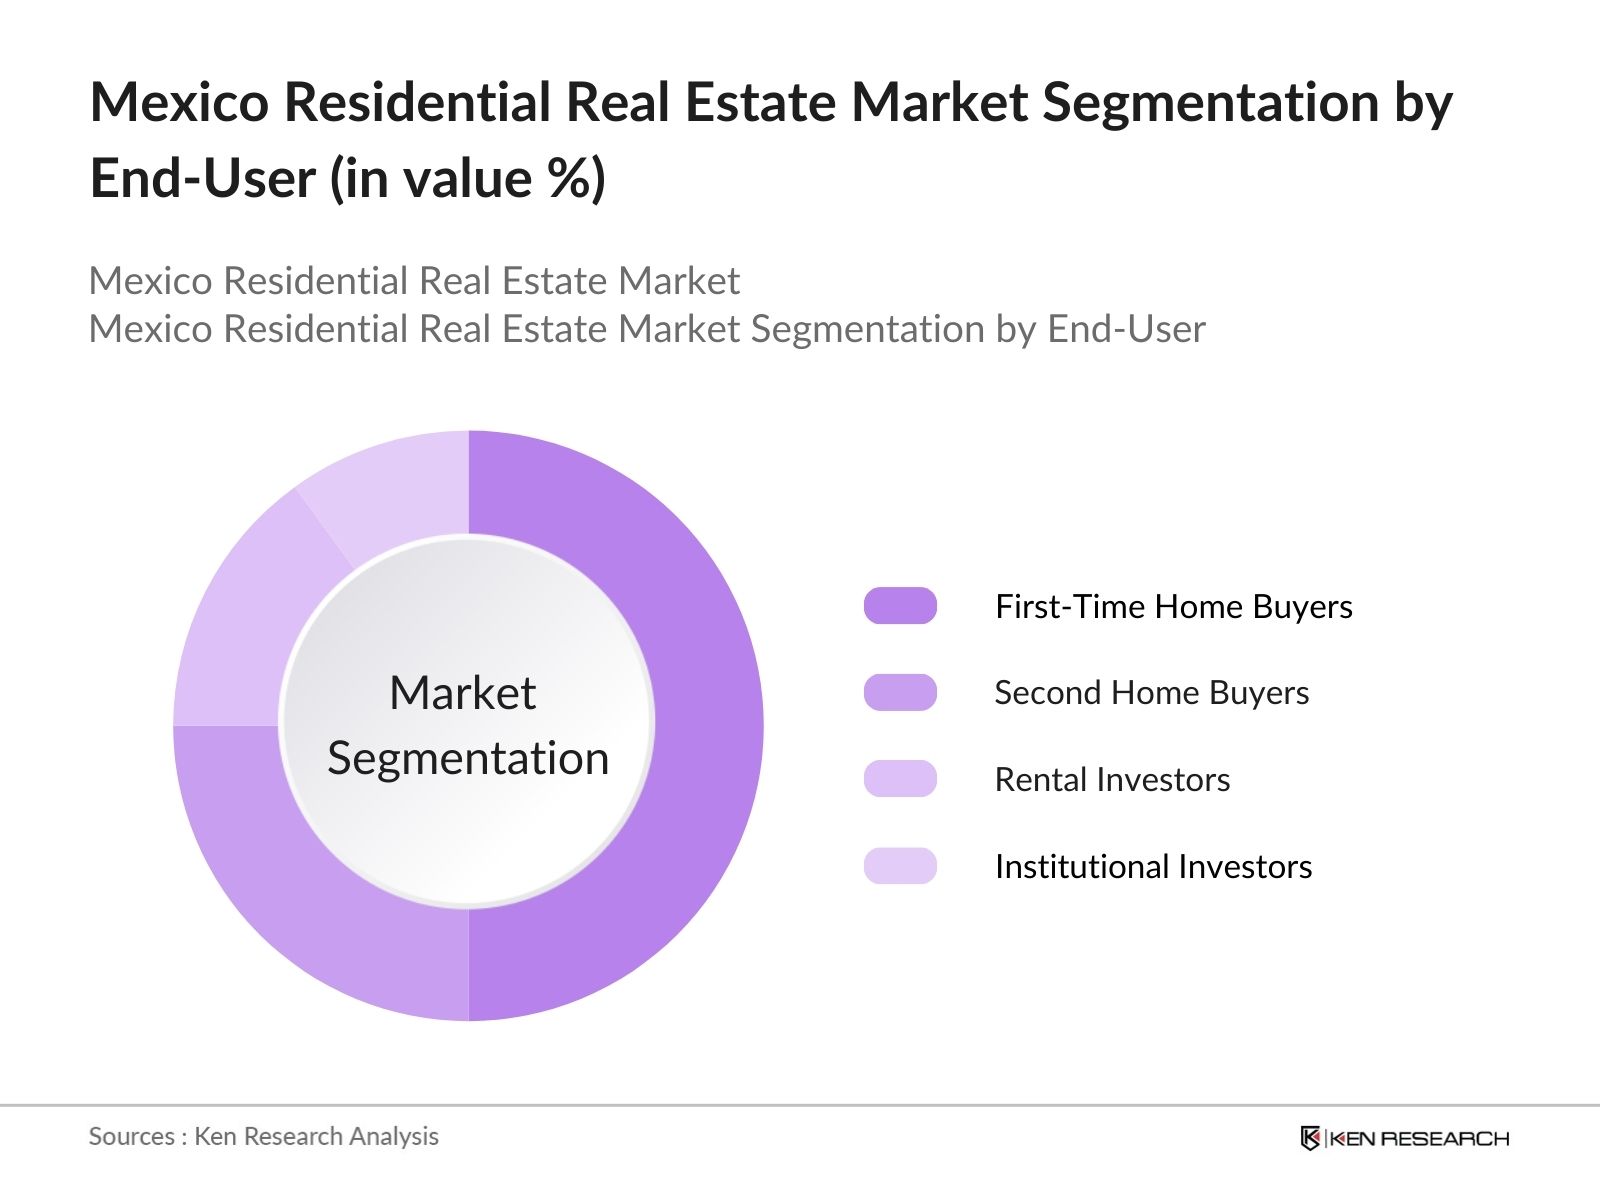
By End-User |
First-Time Home Buyers Second Home Buyers Rental Investors Institutional Investors |
|
By Location |
Urban Areas Tourist Locations Suburban Areas Rural Areas |
|
By Construction Type |
New Construction Pre-Owned/Resale Properties Rental Developments |
|
By Transaction Type |
Residential Sales Residential Rentals Mortgage-Based Purchases, Cash Purchases |
1.1. Definition and Scope
1.2. Market Taxonomy
1.3. Market Growth Rate
1.4. Market Segmentation Overview
2.1. Historical Market Size
2.2. Year-On-Year Growth Analysis
2.3. Key Market Developments and Milestones
3.1. Growth Drivers (Urbanization Rate, Population Growth, Mortgage Rate, Foreign Investments)
3.1.1. Urbanization and Influx of Population in Urban Areas
3.1.2. Increase in Government Housing Programs (e.g., INFONAVIT)
3.1.3. Foreign Direct Investment (FDI) in Real Estate Sector
3.1.4. Low Mortgage Interest Rates and Increased Lending Options
3.2. Market Challenges (Land Costs, Bureaucratic Delays, Construction Costs, Environmental Regulations)
3.2.1. Rising Land Prices in Prime Urban Areas
3.2.2. Delays Due to Bureaucracy in Real Estate Approval Process
3.2.3. Increasing Construction Costs due to Inflation and Material Price Hikes
3.2.4. Stringent Environmental and Zoning Regulations
3.3. Opportunities (Affordable Housing, Tourism-Driven Second Homes, Sustainable Development, Smart Cities)
3.3.1. Expansion of Affordable Housing Projects
3.3.2. Increased Demand for Second Homes and Rental Properties in Tourism Areas (e.g., Cancun, Tulum)
3.3.3. Government Incentives for Sustainable Construction and Green Building Practices
3.3.4. Growth in Smart City Developments and Digital Infrastructure
3.4. Trends (Sustainable Development, Technology Integration, Remote Working, Short-Term Rentals)
3.4.1. Adoption of Sustainable Construction Techniques and Eco-Friendly Materials
3.4.2. Growth in Technology-Enabled Smart Homes
3.4.3. Increase in Residential Properties Targeting Remote Workers
3.4.4. Rise of Short-Term Rental Platforms (e.g., Airbnb) Boosting Investment Property Demand
3.5. Government Regulation (Tax Policies, Real Estate Licensing, Environmental Impact Laws, Affordable Housing Programs)
3.5.1. Changes in Real Estate Taxation and Property Transfer Laws
3.5.2. Licensing and Regulations for Real Estate Professionals
3.5.3. Environmental Impact Assessment Requirements
3.5.4. Government-Led Affordable Housing Initiatives
3.6. SWOT Analysis
3.7. Stakeholder Ecosystem (Government Bodies, Real Estate Developers, Financial Institutions, Contractors)
3.8. Porters Five Forces
3.9. Competition Ecosystem
4.1. By Property Type (In Value %)
4.1.1. Apartments
4.1.2. Villas
4.1.3. Condominiums
4.1.4. Townhouses
4.1.5. Gated Communities
4.2. By End-User (In Value %)
4.2.1. First-Time Home Buyers
4.2.2. Second Home Buyers (Vacation/Investment Properties)
4.2.3. Rental Investors
4.2.4. Institutional Investors
4.3. By Location (In Value %)
4.3.1. Urban Areas (Mexico City, Guadalajara, Monterrey)
4.3.2. Tourist Locations (Cancun, Tulum, Puerto Vallarta)
4.3.3. Suburban and Semi-Urban Areas
4.3.4. Rural Areas
4.4. By Construction Type (In Value %)
4.4.1. New Construction
4.4.2. Pre-Owned/Resale Properties
4.4.3. Rental Developments
4.5. By Transaction Type (In Value %)
4.5.1. Residential Sales
4.5.2. Residential Rentals
4.5.3. Mortgage-Based Purchases
4.5.4. Cash Purchases
5.1. Detailed Profiles of Major Companies
5.1.1. Casas GEO
5.1.2. Vinte Viviendas Integrales
5.1.3. Urbi Desarrollos Urbanos
5.1.4. Homex
5.1.5. Grupo Sadasi
5.1.6. Gicsa
5.1.7. Quiero Casa
5.1.8. Ara
5.1.9. Citibanamex
5.1.10. Banorte
5.1.11. Santander
5.1.12. BBVA
5.1.13. PulteGroup
5.1.14. Cemex
5.1.15. Grupo Lar
5.2. Cross Comparison Parameters
5.2.1 Total Number of Employees
5.2.2 Headquarter Location
5.2.3 Inception Year
5.2.4 Revenue
5.2.5 Number of Projects Completed
5.2.6 Types of Residential Properties Developed
5.2.7 Presence in Different Regions
5.2.8 Partnerships and Joint Ventures
5.3. Market Share Analysis
5.4. Strategic Initiatives
5.5. Mergers and Acquisitions
5.6. Investment Analysis
5.7. Venture Capital Funding
5.8. Private Equity Investments
6.1. Property Ownership Laws for Foreigners (Fideicomiso, Restricted Zones)
6.2. Legal Requirements for Real Estate Transactions
6.3. Environmental and Zoning Regulations
6.4. Mortgage Lending Regulations
7.1. Future Market Size Projections
7.2. Key Factors Driving Future Market Growth
8.1. By Property Type (In Value %)
8.2. By End-User (In Value %)
8.3. By Location (In Value %)
8.4. By Construction Type (In Value %)
8.5. By Transaction Type (In Value %)
9.1. TAM/SAM/SOM Analysis
9.2. Marketing Initiatives
9.3. White Space Opportunity Analysis
9.4. Target Segment Analysis
The research began by mapping all major stakeholders in the Mexico residential real estate market, including developers, government housing agencies, and financial institutions. Extensive desk research from both secondary and proprietary databases was conducted to identify key variables like mortgage rates, land availability, and government housing initiatives.
Historical data on housing development, residential demand, and mortgage issuance was analyzed to construct the market landscape. The analysis involved data on residential property transactions, average selling prices, and the availability of affordable housing.
Market hypotheses were developed regarding the impact of government housing programs on demand and were validated through expert interviews with developers, government officials, and real estate agents. These consultations helped to refine revenue estimates and validate trends observed from desk research.
The final output involved a synthesis of expert insights and quantitative data, presenting a comprehensive overview of the residential real estate market. Direct consultations with industry players enabled the validation of forecasted trends and market dynamics, ensuring the accuracy of the final report.
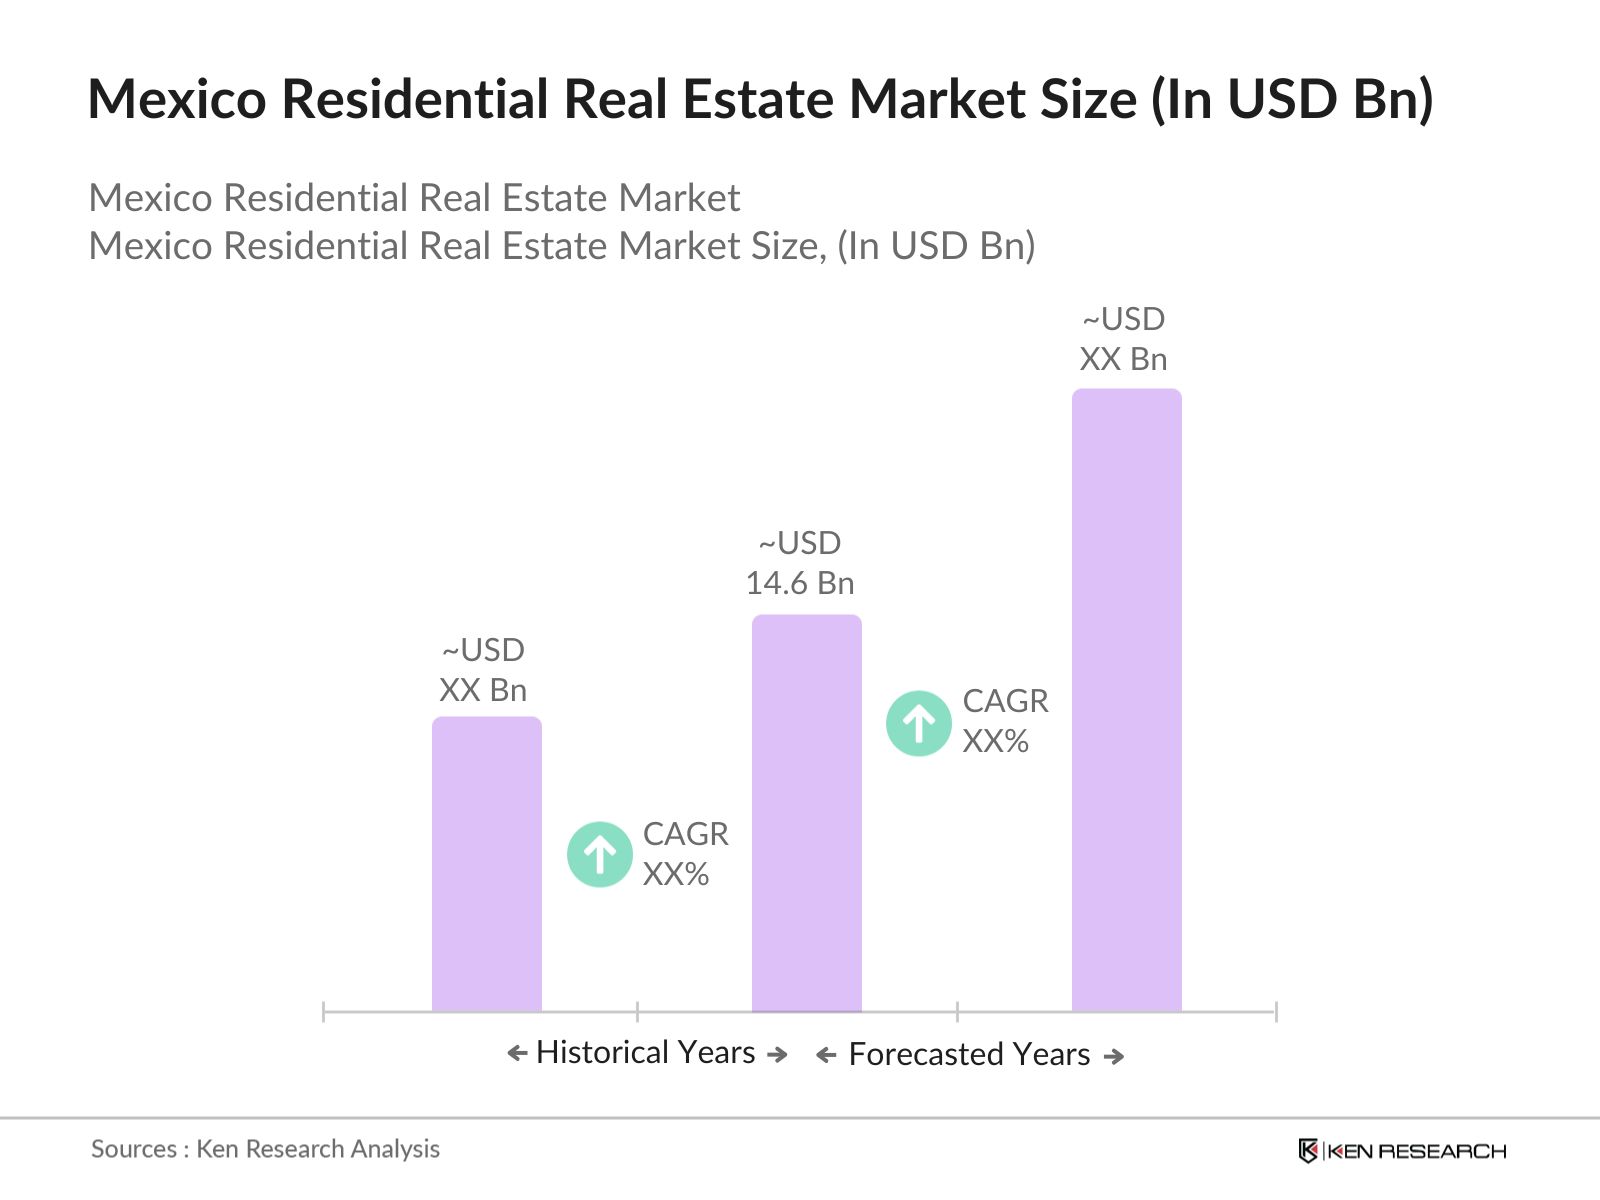
The Mexico residential real estate market is valued at USD 14.6 billion, driven by factors such as urbanization, mortgage accessibility, and government-backed housing initiatives.
Challenges in the Mexico residential real estate market include rising land and construction costs, bureaucratic delays in approvals, and stringent environmental regulations, all of which hinder rapid development.
Key players in the Mexico residential real estate market include Casas GEO, Homex, Vinte Viviendas Integrales, PulteGroup, and Urbi Desarrollos Urbanos, who dominate through large-scale residential projects and partnerships with government programs.
The Mexico residential real estate market is propelled by affordable mortgage options, government housing subsidies, and increasing urban migration, which continually raises demand for new housing units.

What makes us stand out is that our consultants follows Robust, Refine and Result (RRR) methodology. i.e. Robust for clear definitions, approaches and sanity checking, Refine for differentiating respondents facts and opinions and Result for presenting data with story

We have set a benchmark in the industry by offering our clients with syndicated and customized market research reports featuring coverage of entire market as well as meticulous research and analyst insights.

While we don't replace traditional research, we flip the method upside down. Our dual approach of Top Bottom & Bottom Top ensures quality deliverable by not just verifying company fundamentals but also looking at the sector and macroeconomic factors.

With one step in the future, our research team constantly tries to show you the bigger picture. We help with some of the tough questions you may encounter along the way: How is the industry positioned? Best marketing channel? KPI's of competitors? By aligning every element, we help maximize success.

Our report gives you instant access to the answers and sources that other companies might choose to hide. We elaborate each steps of research methodology we have used and showcase you the sample size to earn your trust.

If you need any support, we are here! We pride ourselves on universe strength, data quality, and quick, friendly, and professional service.