CHAPTER 1 - MARKET SUMMARY
Market Overview
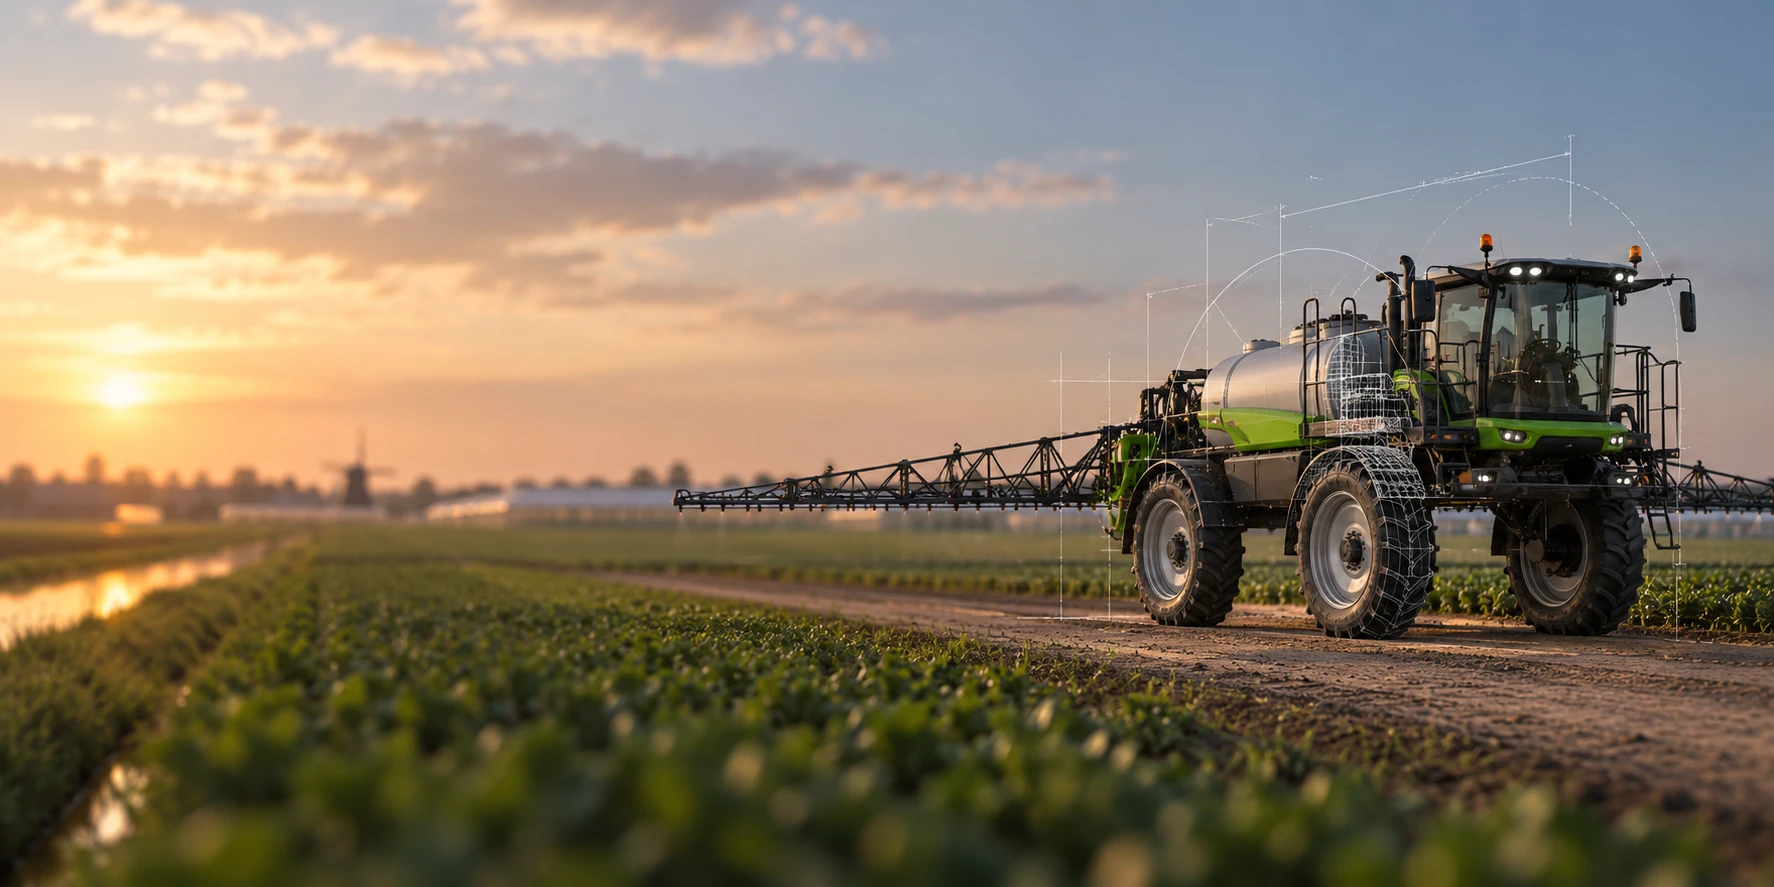
The Netherlands Crop Protection Market supports intensive agriculture across approximately 1.79 million hectares of utilised agricultural area in 2025. The commercial model combines field-crop protection, high-value horticultural applications and integrated greenhouse programs. Around 47,651 agricultural holdings managed utilised farmland in 2025, creating a technically sophisticated but fragmented customer base requiring crop-specific advice, authorised formulations and carefully timed applications.
Demand is geographically concentrated in West Netherlands, including Westland, where greenhouse vegetable and floriculture clusters support premium biological and precision-protection expenditure. The country had approximately 10,029 hectares of greenhouse cultivation in 2025, alongside 91,506 hectares of open-field horticulture. This concentration lowers technical-service delivery costs while increasing the commercial importance of pest monitoring, beneficial organisms and residue-compliant crop programs.
Market Value
USD 432 million
2025
Dominant Region
West Netherlands
2025
Dominant Segment
Biological and Low-Risk Products
fastest growing, 2026-2031
Total Number of Players
85
Future Outlook
The Netherlands Crop Protection Market is projected to expand from USD 432 million in 2025 to USD 516 million by 2031, representing a forecast CAGR of 3.00%. Growth will occur despite gradual reductions in conventional active-ingredient volumes. Value expansion will be supported by biological products, precision application, resistance-management combinations and premium crop programs for potatoes, vegetables, fruit and ornamental crops. The historical CAGR of 2.60% during 2020-2025 reflected pricing gains, formulation upgrades and biological adoption, partly offset by lower chemical usage and periodic distributor inventory adjustments.
By 2031, biological, microbial, macrobial and semiochemical solutions are expected to capture a materially larger proportion of industry revenue. In 2024, biological pest control was already used across 94% of surveyed greenhouse cultivation area, while predatory mite and thrips deployment reached 84%. Regulatory prioritisation of sustainable applications, combined with stricter water-quality assessments, will shift profit pools toward products offering lower residues, reduced application frequency and compatibility with integrated pest management. Suppliers with local trials, digital monitoring tools and defensible regulatory dossiers should achieve above-market growth.
3.00%
Forecast CAGR
$516 Mn
2030 Projection
Base Year
2025
Historical Period
2020-2025
Forecast Period
2026-2031
Historical CAGR
2.60%
CHAPTER 2 - SCOPE OF REPORT
Scope of the Market
CHAPTER 3 - Key Stakeholders
Key Target Audience
Key stakeholders who can leverage from this market analysis for investment, strategy, and operational planning.
Investors
CAGR, biological exposure, registration risk, margin resilience, consolidation
Corporates
portfolio mix, channel access, crop coverage, pricing power
Government
pesticide reduction, water quality, compliance, crop resilience
Operators
efficacy, application timing, resistance, residue management, yield
Financial institutions
working capital, regulatory risk, recurring demand, covenants
CHAPTER 4 - Market Size & Growth
Market Size, Growth Forecast and Trends
This section evaluates the historical market size, analyzes year-over-year growth dynamics, and presents forecast projections supported by market performance indicators and demand-side drivers.
Historical & Projected Market Size ($ Million)
Year-over-Year Growth Rate (%)
Market Value vs Volume Growth (%)
Historical Market Performance, 2020-2025
Market value increased by USD 52 million between 2020 and 2025, despite active-ingredient sales declining from 9.88 thousand tonnes in 2020 to an estimated 7.85 thousand tonnes in 2025. The strongest annual value increase occurred in 2022, when supplier pricing and formulation costs lifted growth to 3.9%. The 2023 volume correction represented the primary inflection point, but revenue remained supported by high-value horticulture, specialist fungicides and biological solutions.
Forecast Market Outlook, 2026-2031
The market is forecast to add USD 84 million between 2025 and 2031. Value growth is expected to accelerate from 2.8% in 2026 to 3.2% in 2031 as biological and precision-enabled products improve revenue per treated hectare. Conventional chemical volume will continue declining gradually, but premium microbial products, beneficial organisms and integrated resistance-management programs will support a 3.00% forecast CAGR and a terminal market value of USD 516 million.
CHAPTER 5 - Market Data
Market Breakdown
The Netherlands Crop Protection Market is moving from active-ingredient volume growth toward higher-value integrated crop programs. For CEOs and investors, the principal strategic question is whether portfolio mix, regulatory resilience and biological capability can offset declining conventional chemical volumes.
Year | Market Size (USD Mn) | YoY Growth (%) | Active-Ingredient Sales (000 Tonnes) | Biological and Low-Risk Revenue Share (%) | Authorised Plant Protection Products | Period |
|---|---|---|---|---|---|---|
| 2020 | $380 Mn | +- | 9.88 | 15% | Forecast | |
| 2021 | $389 Mn | +2.4% | 9.40 | 16% | Forecast | |
| 2022 | $404 Mn | +3.9% | 8.99 | 18% | Forecast | |
| 2023 | $411 Mn | +1.7% | 7.51 | 20% | Forecast | |
| 2024 | $424 Mn | +3.2% | 8.10 | 23% | Forecast | |
| 2025 | $432 Mn | +1.9% | 7.85 | 26% | Forecast | |
| 2026F | $444 Mn | +2.8% | 7.72 | 28% | Forecast | |
| 2027F | $457 Mn | +2.9% | 7.62 | 30% | Forecast | |
| 2028F | $471 Mn | +3.1% | 7.53 | 32% | Forecast | |
| 2029F | $485 Mn | +3.0% | 7.46 | 34% | Forecast | |
| 2030F | $500 Mn | +3.1% | 7.40 | 36% | Forecast | |
| 2031F | $516 Mn | +3.2% | 7.34 | 38% | Forecast |
Active-Ingredient Sales
8.10 thousand tonnes, 2024, Netherlands. Revenue is becoming less dependent on chemical tonnage as higher-value biological and precision formulations expand. Total agricultural usage was only 3.9 thousand tonnes across the 44 surveyed crops in 2024.
Biological and Low-Risk Revenue Share
26%, 2025, Netherlands estimate. The shift expands recurring technical-service and monitoring revenue while reducing exposure to active-substance withdrawal. Biological pest control covered 94% of surveyed greenhouse cultivation area in 2024.
Authorised Plant Protection Products
1,038 products, 2024, Netherlands. Portfolio breadth remains substantial, but the number of authorised active substances declined to 253, increasing concentration around defensible molecules and biological alternatives.
CHAPTER 6 - Segmentation
Market Segmentation Framework
Comprehensive analysis across key dimensions providing insights into market structure, consumer preferences, and distribution patterns.
No of Segments
7
Dominant Segment
Product Type
Fastest Growing Segment
Technology
Product Type
Crop Type
Customer Type
Application
Distribution Channel
Technology
Geography
Key Segmentation Takeaways
Comprehensive analysis across all extracted segmentation dimensions providing insights into market structure, consumer preferences, and distribution patterns.
Product Type
Product type is the dominant commercial dimension because crop-protection budgets are principally allocated by target organism and treatment objective. Fungicides and bactericides represent the largest conventional category, reflecting disease pressure in potatoes, vegetables, fruit and wet-season field crops. Biological and low-risk products are gaining importance as growers combine chemistry, beneficial organisms and environmental monitoring within integrated programs.
Technology
Technology is the fastest-growing dimension as microbial biocontrol, beneficial insects, pheromones and precision application systems replace broad-volume chemical treatment. Macrobial beneficials are particularly established in greenhouse horticulture, while microbial fungicides and soil treatments are extending into open-field crops. Growth depends on efficacy consistency, crop-specific registration, monitoring tools and compatibility with conventional resistance-management programs.
CHAPTER 7 - Regional Analysis
Regional Analysis
The Netherlands ranks behind France and Germany in absolute crop-protection revenue but materially above Belgium and Denmark. Its market intensity is structurally higher than its agricultural area would suggest because potatoes, greenhouse vegetables, floriculture and export-oriented horticulture require technically advanced protection programs.
Focus Country Ranking
3rd
Focus Country Market Size
USD 432 million (2025)
Netherlands CAGR (2026-2031)
3.00%
Focus Country Ranking
3rd
Focus Country Market Size
USD 432 million (2025)
Netherlands CAGR (2026-2031)
3.00%
Regional Analysis (Current Year)
Market Position
The Netherlands ranks third among selected peers with a USD 432 million market, supported by high crop value per hectare and approximately 102,000 hectares of open-field and greenhouse horticulture.
Growth Advantage
The 3.00% forecast CAGR exceeds France at 2.40% and Germany at 2.60%, reflecting faster biological adoption, premium crop programs and precision-application investment.
Competitive Strengths
Competitive strengths include 94% biological pest-control coverage in surveyed greenhouses, 10,000 hectares of protected cultivation and a dense technical ecosystem of growers, regulators and biological-control specialists.
CHAPTER 8 - INDUSTRY ANALYSIS
Growth Drivers, Challenges & Opportunities
Comprehensive analysis of key factors shaping the Netherlands Crop Protection Market, including growth catalysts, operational challenges, and emerging opportunities across production, distribution, and consumer segments.
Growth Drivers
High-Value and Intensive Crop Production
- Approximately 531,000 hectares (2024, Netherlands) were allocated to arable crops, sustaining fungicide, herbicide, seed-treatment and potato haulm-control expenditure.
- Open-field horticulture covered 92,000 hectares (2024, Netherlands), creating concentrated demand for disease, insect and residue-management programs.
- Greenhouse cultivation covered approximately 10,000 hectares (2024, Netherlands), where high crop values support premium biological and monitoring solutions.
Rapid Adoption of Biological Crop Protection
- Predatory mites and predatory thrips were used across 84% of surveyed area (2024, Netherlands), up from 69% in 2020.
- Microbiological agents were deployed across more than two-thirds of surveyed greenhouse area (2024, Netherlands), expanding microbial product revenue.
- Green-classified products represented 26% of agricultural product use (2024, Netherlands), supporting premium low-residue portfolios.
Export Quality and Crop-Loss Prevention Requirements
- Agricultural exports increased by 8.4% (2025, Netherlands), raising the economic value exposed to pest, disease and quality failures.
- Domestic-origin agricultural exports generated approximately EUR 42.3 billion (2024, Netherlands) in national earnings, supporting investment in crop reliability.
- Wet conditions increased plant-protection sales to 8.1 thousand tonnes (2024, Netherlands), illustrating weather-driven disease-protection demand.
Market Challenges
Regulatory Attrition and Rising Registration Costs
- Of approximately 80 plant-protection applications, 16 applications were rejected (2024, Netherlands), increasing sunk development and dossier costs.
- Some requested uses were rejected or withdrawn in 35% of applications (2024, Netherlands), restricting addressable crop and application revenue.
- Usage instructions were tightened in 37% of plant-protection authorisations (2024, Netherlands), requiring additional stewardship and grower training.
Water-Quality and Environmental Compliance Pressure
- The reassessment framework can mandate lower dosage, reduced frequency or withdrawal of uses, directly affecting supplier revenue from affected molecules.
- The related policy consultation received more than 100 responses from 24 organisations (2024, Netherlands), highlighting stakeholder and litigation intensity.
- The regulator processed approximately 50 objections and 20 settlements (2024, Netherlands), increasing uncertainty around product timelines and permitted uses.
Declining Conventional Volumes and Farm Consolidation
- Usage intensity fell from 7.1 to 5.6 kilograms per hectare between 2020 and 2024, requiring suppliers to expand value per application.
- The number of holdings with utilised agricultural area declined to 47,651 farms in 2025, concentrating procurement power among larger operations.
- Utilised agricultural area declined from 1.81 million hectares in 2020 to 1.79 million hectares in 2025, restricting addressable treatment area.
Market Opportunities
Microbial and Low-Risk Product Development
- A further six applications were pending at year-end 2024, providing a near-term pipeline for microbial, botanical and pheromone solutions.
- The specialist green assessment team submitted eight substances for European review in 2024, supporting future low-risk product availability.
- Suppliers can monetise crop-specific efficacy trials, integrated programs and technical support across the 94% biological greenhouse penetration level recorded in 2024.
Precision Application and Digital Stewardship
- Authorisation-database visits increased by 11% during 2024, indicating higher demand for accessible product and usage information.
- Digital labels, barcode scanning and decision-support systems can improve adherence where instructions were tightened in 37% of 2024 authorisations.
- Sensor-guided spraying can protect margins as conventional usage intensity falls below 6 kilograms per hectare in 2024.
High-Value Greenhouse and Specialty-Crop Programs
- Predatory mite and thrips deployment expanded by 15 percentage points between 2020 and 2024, supporting beneficial-organism replenishment revenue.
- Greenhouse vegetables, flowers and ornamentals require continuous monitoring, enabling suppliers to combine products, scouting and application equipment within multi-season contracts.
- Specialty portfolios can serve more than 100 countries through Dutch biological distribution networks, creating export and intellectual-property opportunities beyond domestic farm demand.
CHAPTER 9 - Competitive Landscape
Competitive Landscape Overview
The market is moderately concentrated, with multinational crop-science groups competing against specialist biological suppliers. Regulatory dossiers, local efficacy trials, distributor access and grower advisory capabilities form the primary barriers to entry.
Market Share Distribution
Top 5 Players
Market Dynamics
8 new entrants in the past 5 years, indicating strong market attractiveness and growth potential.
Company Name | Market Share | Headquarters | Founding Year | Core Market Focus |
|---|---|---|---|---|
Bayer Crop Science | - | Leverkusen, Germany | 1863 | Fungicides, herbicides, insecticides, biologicals and integrated crop management |
BASF Agricultural Solutions | - | Ludwigshafen, Germany | 1865 | Crop protection, seed treatment, biological products and digital agriculture |
Syngenta Crop Protection | - | Basel, Switzerland | 2000 | Fungicides, herbicides, insecticides, seeds and crop-program solutions |
Corteva Agriscience | - | Indianapolis, United States | 2019 | Herbicides, fungicides, insecticides, biologicals and seed technologies |
Koppert | - | Berkel en Rodenrijs, Netherlands | 1967 | Beneficial organisms, microbial products, pollination and pest monitoring |
Certis Belchim | - | Utrecht, Netherlands | 2022 | Biorationals, biological fungicides, insecticides and integrated crop programs |
ADAMA Northern Europe | - | Airport City, Israel | 1945 | Off-patent herbicides, fungicides, insecticides and crop-specific formulations |
UPL Benelux | - | Mumbai, India | 1969 | Crop protection, biosolutions, seed treatment and integrated farm solutions |
FMC Operational Netherlands | - | Philadelphia, United States | 1883 | Insecticides, herbicides and high-value crop-protection technologies |
Nufarm Benelux | - | Melbourne, Australia | 1916 | Professional agriculture herbicides, fungicides and specialist crop solutions |
Cross Comparison Parameters
The report provides detailed cross-comparison of key players across 10 performance parameters to identify competitive strengths and weaknesses.
Authorised Product Portfolio Breadth
Biological Solution Penetration
Netherlands Crop Protection Revenue Growth
Regulatory and R&D Investment Intensity
Analysis Covered
Market Share Analysis:
Estimates supplier positioning across chemical and biological crop protection categories
Cross Comparison Matrix:
Benchmarks portfolios, biological exposure, channels and regulatory capabilities systematically
SWOT Analysis:
Evaluates competitive advantages, vulnerabilities, opportunities and portfolio transition risks
Pricing Strategy Analysis:
Compares premium biological, branded chemical and generic formulation pricing
Company Profiles:
Reviews market focus, product coverage, presence and strategic positioning
CHAPTER 10 - REPORT TOC
Table of Contents
Market Assessment Phase
Supply-side and competitive intelligence covering market sizing, segmentation, competitive dynamics, regulatory landscape, and future forecasts.
Go-To-Market Strategy Phase
15 chapters
Entry strategy evaluation, execution roadmap, partner recommendations, and profitability outlook.
Survey Phase
8 chapters
Demand-side primary research conducted through structured interviews and online surveys with end users across priority agricultural clusters to capture application behavior, unmet needs, product performance and purchase drivers.
Complete Report Coverage
201+ detailed sections covering every aspect of the market
143
Assessment Sections
58
Strategy Sections
CHAPTER 11 - Our Approach
Research Methodology
Desk Research
- Reviewed pesticide sales and usage datasets
- Mapped authorised crop protection portfolios
- Analysed agricultural land and crops
- Assessed trade and regulatory developments
Primary Research
- Interviewed crop protection portfolio directors
- Engaged greenhouse integrated-pest-management managers
- Consulted agricultural distributor category managers
- Surveyed arable and horticultural growers
Validation and Triangulation
- Validated findings across 318 respondents
- Reconciled supplier and grower estimates
- Cross-checked value against product volumes
- Tested crop-level expenditure plausibility
CHAPTER 12 - FAQ
FAQs
Still have questions?
Our research team is here to help you find the right solution
CHAPTER 13 - Related Research
Explore Related Reports
Expand your market intelligence with complementary research across regions and adjacent markets.
Regional/Country ReportsRelated market analysis across key regions
Related market analysis across key regions
Adjacent ReportsRelated markets and complementary research
Related markets and complementary research
- North America Precision Agriculture Market Outlook to 2030: Size, Share, Growth and Trends
- UAE Greenhouse Horticulture Market
- Philippines Biological Pest Control Market
- Mexico Microbial Solutions Market
- UAE Sustainable Agriculture Market
500+
Market Research Reports
50+
Countries Covered
15+
Industry Verticals