


North America Business Intelligence Market Outlook to 2030
Region:North America
Author(s):Meenakshi Bisht
Product Code:KROD3161
October 2024
93
About the Report
North America Business Intelligence Market Overview
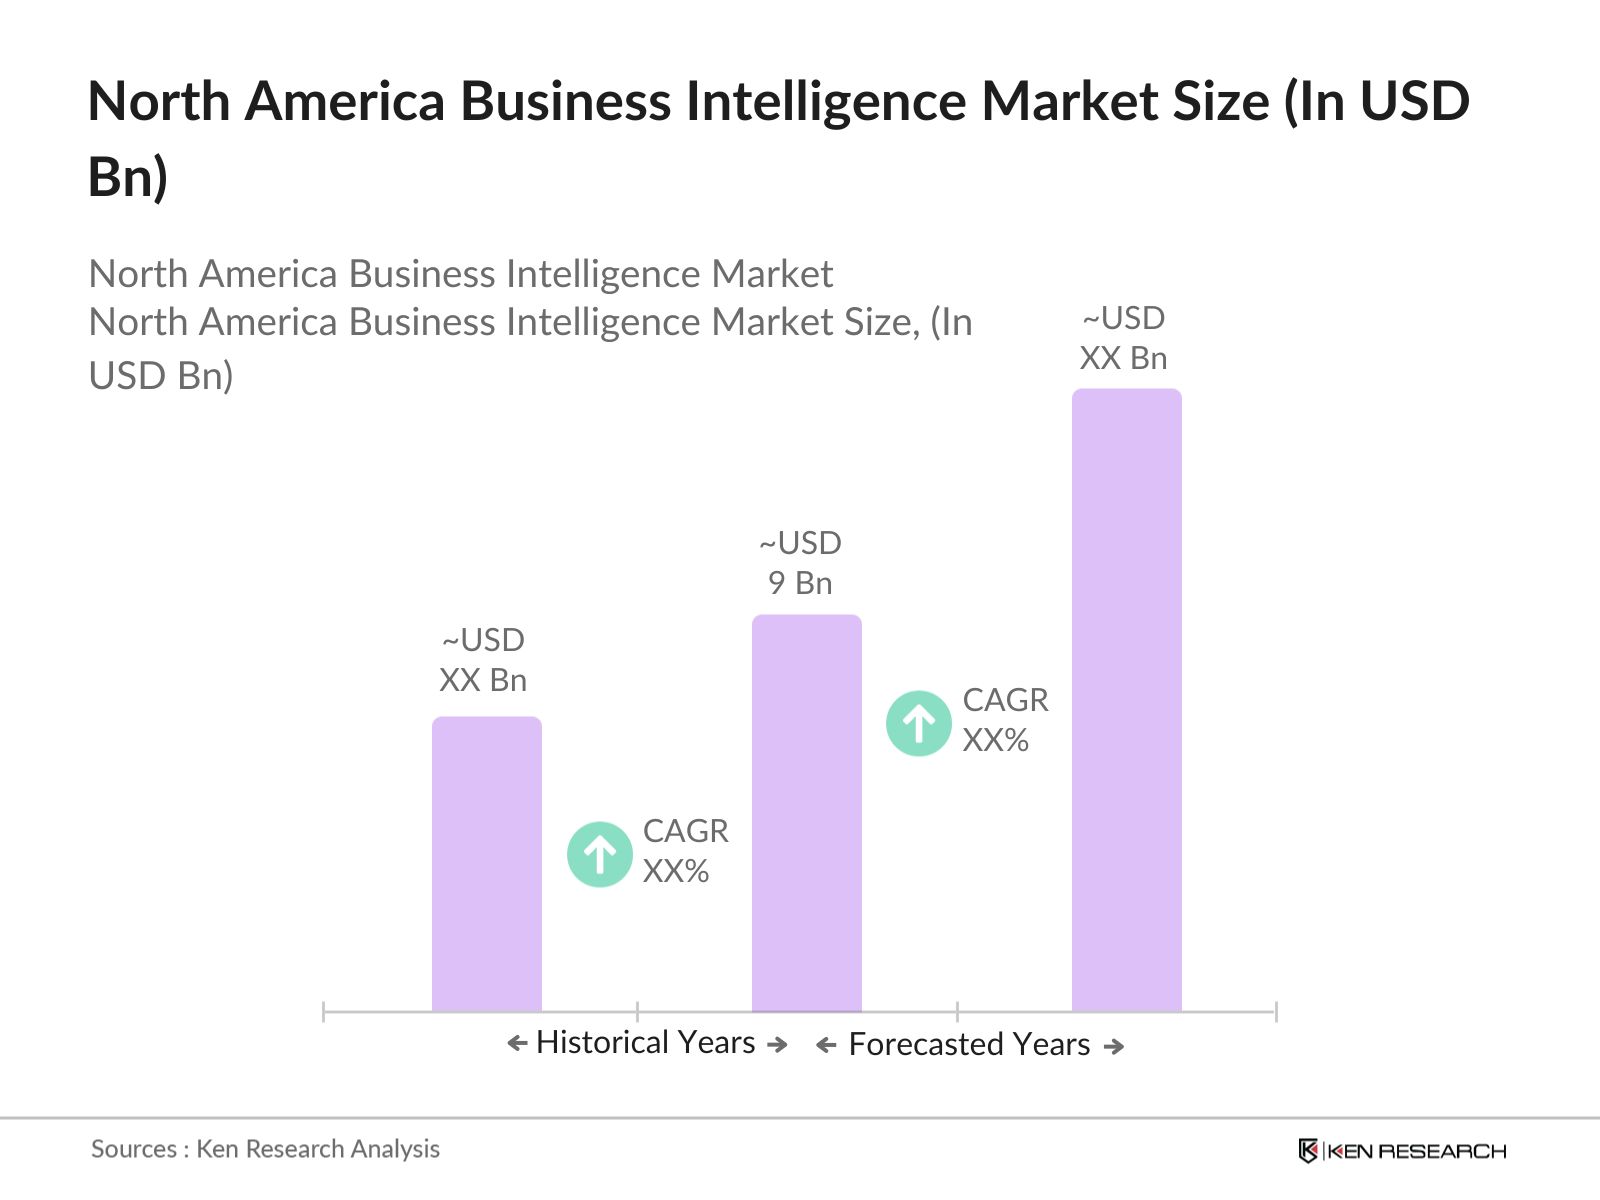
- The North America Business Intelligence (BI) Market is valued at USD 9 billion, based on a detailed five-year historical analysis. This growth is driven by the increasing adoption of data-driven decision-making across enterprises of all sizes. Cloud technology has significantly influenced the rise in demand for BI solutions, providing scalable and cost-effective tools for real-time analytics. The shift towards digital transformation, combined with the need for actionable insights from large datasets, continues to drive market expansion.
- In North America, the United States is the dominant player in the BI market, largely due to the presence of leading technology hubs such as Silicon Valley and the strong adoption of advanced data analytics tools by major corporations. Additionally, the region's well-established infrastructure for cloud computing and artificial intelligence (AI) has further cemented its dominance. Canada follows closely, with increasing investments in AI-driven analytics and big data technologies, making it a key contributor to the market’s growth.
- In 2024, several U.S. states introduced or expanded data privacy laws, with California's CPRA (California Privacy Rights Act) being one of the most comprehensive. The law enhances consumer rights by allowing individuals to access, correct, and delete their data, while restricting data retention and transfer practices. Additionally, the law establishes the California Privacy Protection Agency for enforcement, making it a key regulatory initiative in the North American Business Intelligence market. These laws reflect the growing focus on data privacy in business operations across multiple sectors.
North America Business Intelligence Market Segmentation
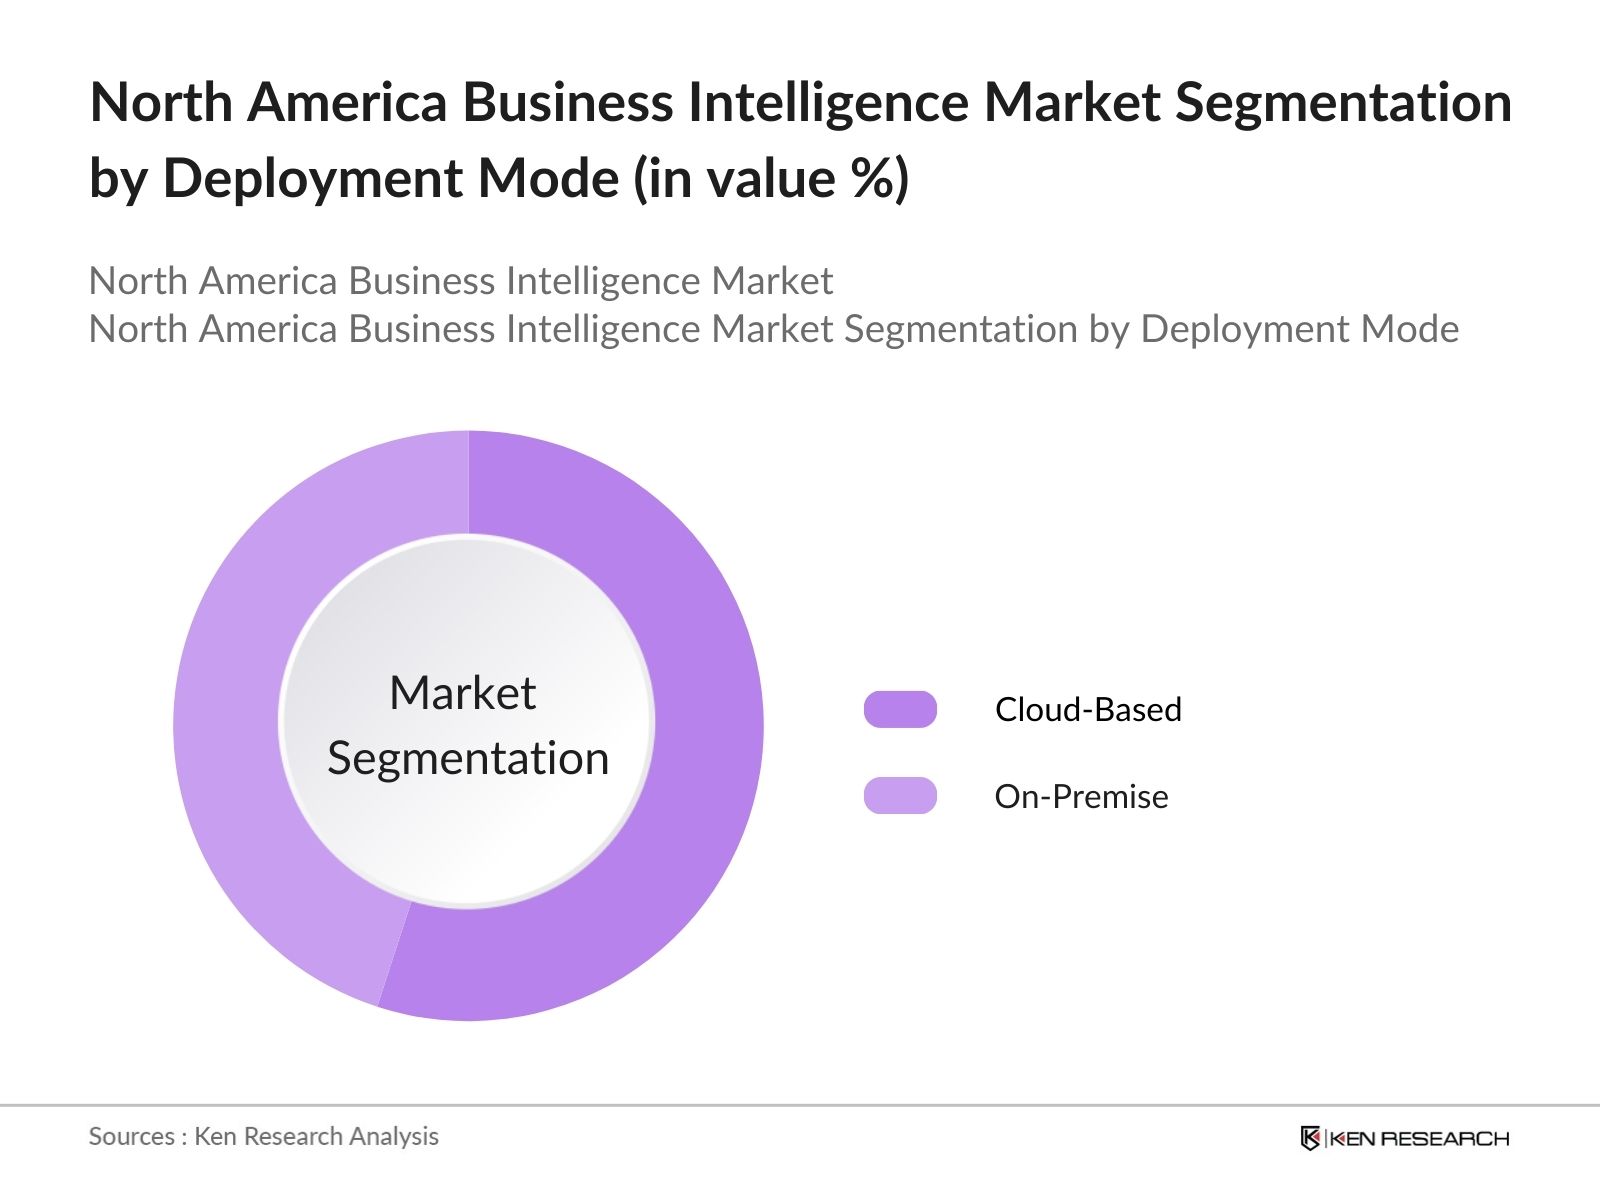
By Deployment Mode: The North America Business Intelligence market is segmented by deployment mode into on-premise and cloud-based solutions. Cloud-based BI solutions hold a dominant share in the market due to their flexibility, scalability, and reduced operational costs. The migration of data from on-premise systems to cloud infrastructure allows businesses to access real-time analytics and improve decision-making. Companies across various sectors prefer cloud-based solutions because they can seamlessly integrate with other technologies like AI and machine learning.
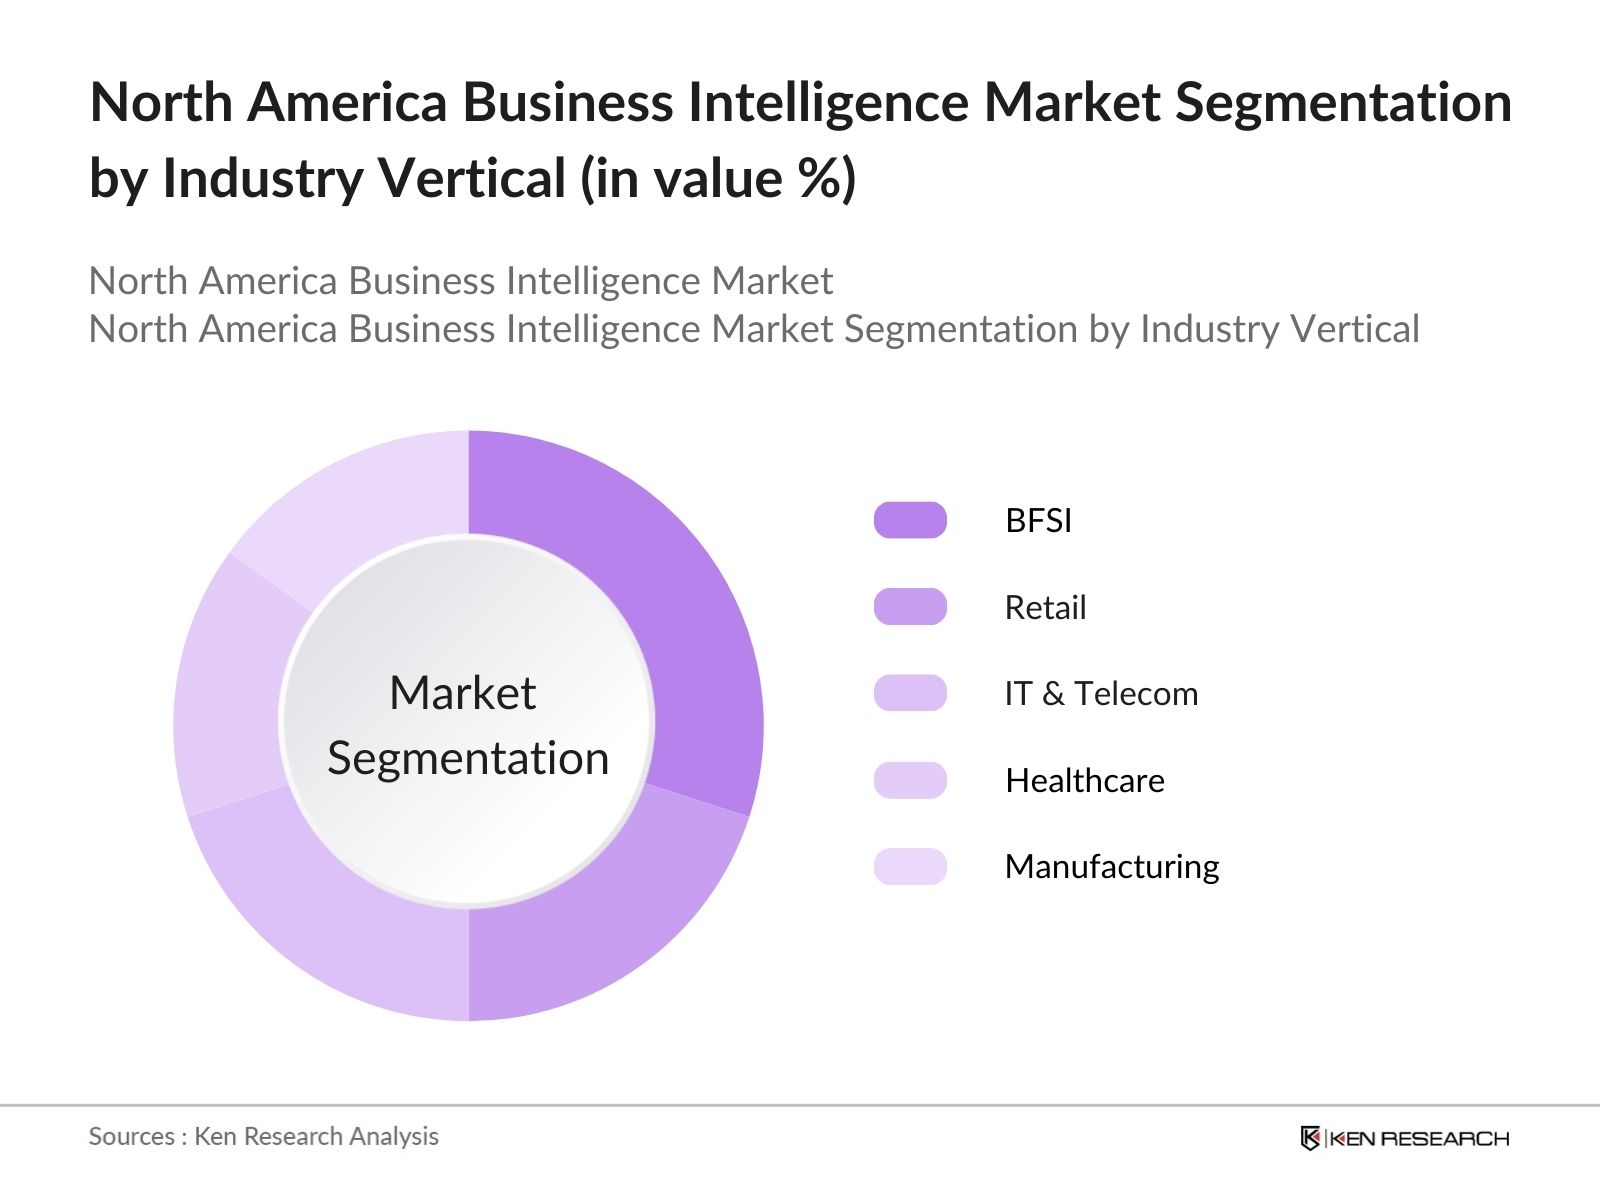
By Industry Vertical: The Business Intelligence market is also segmented by industry verticals, including BFSI (Banking, Financial Services, and Insurance), retail, healthcare, IT & telecom, and manufacturing. The BFSI sector currently dominates the market share due to the need for enhanced data-driven decision-making and risk management. Financial institutions leverage BI tools to monitor transactions, detect fraud, and gain insights into customer behavior. Moreover, the retail industry is rapidly adopting BI solutions to optimize supply chain management and improve customer engagement.
North America Business Intelligence Market Competitive Landscape
The North America Business Intelligence market is dominated by key players that leverage technological advancements to maintain their market position. The competition is consolidated among a few major companies that offer comprehensive BI solutions across various industries. Companies like Microsoft, IBM, and Oracle are leading the market due to their robust product portfolios, cloud capabilities, and strong customer bases.
|
Company Name |
Year of Establishment |
Headquarters |
Revenue (2023) |
No. of Employees |
Key Clients |
Technology Stack |
Patent Portfolio |
Strategic Partnerships |
Product Offerings |
|
Microsoft Corporation |
1975 |
Redmond, WA |
- | - | - | - | - | - | - |
|
IBM Corporation |
1911 |
Armonk, NY |
- | - | - | - | - | - | - |
|
Oracle Corporation |
1977 |
Austin, TX |
- | - | - | - | - | - | - |
|
SAP SE |
1972 |
Walldorf, GER |
- | - | - | - | - | - | - |
|
Tableau (Salesforce) |
2003 |
San Francisco, |
- | - | - | - | - | - | - |
North America Business Intelligence Industry Analysis
Growth Drivers
- Increased Data-Driven Decision-Making: In 2024, data-driven decision-making in North American enterprises has grown substantially due to the rise in digital transformation initiatives. The U.S. GDP was valued at approximately $27360.94 billion in 2023. The increasing complexity of operations across these industries is necessitating the use of Business Intelligence (BI) tools to harness the vast amounts of data being generated daily. The ability to analyze, interpret, and use data has become crucial for competitive advantage and operational efficiency.
- Cloud Adoption in Enterprises: In 2024, the adoption of cloud technologies in North American businesses is surging, with more of the enterprises moving critical data to the cloud, according to the U.S. Census Bureau. This trend has contributed significantly to the increased demand for cloud-based BI solutions, enabling enterprises to leverage scalable and flexible analytics tools. Cloud infrastructure spending, supported by initiatives like the Worldwide spending on cloud infrastructure is expected to reach $138.3 billion in 2024, growing 26.1% compared to 2023, further accelerating the growth of BI systems integrated with cloud platforms.
- Growing Demand for Real-Time Analytics: The demand for real-time analytics has seen rapid growth in North America, driven by industries such as healthcare, finance, and logistics. Businesses are increasingly adopting BI systems that provide real-time insights to enhance decision-making and operational efficiency. The ability to process large volumes of data in real time is crucial for sectors like financial services, where high-frequency trading and instant transaction processing are essential. Additionally, industries with complex supply chains are leveraging real-time analytics to optimize operations, reduce downtime, and improve responsiveness to market fluctuations. This trend is expected to continue as real-time analytics become a core business requirement.
Market Restraints
- Data Security Concerns: Despite the advantages offered by BI solutions, data security remains a significant concern for many enterprises. Businesses are often hesitant to fully implement BI systems due to fears of data breaches and privacy issues. The rising trend of cloud-based BI tools adds to these concerns, as companies worry about the safety of sensitive information in the cloud. Although there are stringent guidelines in place for data handling and security, concerns around compliance and potential vulnerabilities still persist, making it a key challenge for widespread adoption of BI technologies.
- High Implementation Costs: The high cost of implementing advanced BI solutions poses a significant challenge, particularly for small and medium-sized enterprises (SMBs). Many companies find the initial expenses associated with BI systems, including infrastructure and integration costs, to be prohibitive. This financial burden limits the adoption of BI solutions, especially among smaller businesses, despite the long-term benefits of improved decision-making and operational efficiency. For many organizations, balancing the upfront costs with the expected return on investment remains a major barrier to embracing these technologies fully.
North America Business Intelligence Market Future Outlook
Over the next five years, the North America Business Intelligence market is expected to experience significant growth, driven by advancements in AI and machine learning, along with the growing adoption of self-service BI tools. The shift towards data democratization, where businesses of all sizes can access and analyze data independently, will further fuel the demand for BI solutions. As more organizations move their operations to the cloud, BI tools will evolve to offer predictive and prescriptive analytics, making real-time decision-making more efficient and accurate. Additionally, the growing importance of data security and compliance with regulations such as GDPR and CCPA will encourage more investments in BI security features.
Market Opportunities
- AI Integration with BI Solutions: Artificial Intelligence (AI) is transforming the Business Intelligence (BI) market in North America by significantly enhancing data analysis capabilities. AI-powered BI systems enable faster data processing, predictive analytics, and automated reporting. These advancements are creating substantial growth opportunities for businesses aiming to optimize their data usage. AI integration is helping companies across various sectors make more informed decisions by providing advanced insights and improving operational efficiency. As AI continues to evolve, its role in BI solutions will likely become even more pivotal for businesses looking to stay competitive in data-driven industries.
- Growth in Self-Service BI Tools: The self-service BI market is experiencing rapid growth as organizations increasingly seek solutions that empower employees to analyze data without requiring deep technical expertise. This trend allows non-technical users across different departments to access and interpret business data quickly and effectively. The rise of self-service BI tools is driven by the need for real-time decision-making, particularly in fast-paced sectors like e-commerce and logistics, where timely insights are critical. By enabling employees to perform their own data analysis, businesses can enhance efficiency and improve agility in responding to market changes.
Scope of the Report
|
Deployment Mode |
On-Premise Cloud-Based |
|
Organization Size |
Large Enterprises Small and Medium Enterprises (SMEs) |
|
Industry Vertical |
BFSI Retail Healthcare IT & Telecom Manufacturing |
|
Technology |
Artificial Intelligence (AI) Machine Learning (ML) Natural Language Processing (NLP) Data Visualization |
|
Region |
United States Canada Mexico |
Products
Key Target Audience
- BI Solution Providers
- Cloud Service Providers Companies
- AI & ML Software Developers
- Data Analytics Companies
- IT & Telecom Enterprises
- Government and Regulatory Bodies (e.g., Federal Trade Commission, U.S. Securities and Exchange Commission)
- Venture Capital and Private Equity Firms
- Financial Institutions and Banks
Companies
Major Players in North America BI Market
- Microsoft Corporation
- IBM Corporation
- Tableau Software
- Qlik Technologies
- Oracle Corporation
- MicroStrategy
- SAS Institute
- SAP SE
- TIBCO Software
- Domo, Inc.
- Looker (Google LLC)
- Zoho Corporation
- Sisense Inc.
- Birst, Inc.
- Dundas Data Visualization
Table of Contents
1. North America Business Intelligence Market Overview
1.1. Definition and Scope
1.2. Market Taxonomy
1.3. Market Growth Rate (Annual Revenue Growth, YoY)
1.4. Market Segmentation Overview
2. North America Business Intelligence Market Size (In USD Bn)
2.1. Historical Market Size
2.2. Year-On-Year Growth Analysis
2.3. Key Market Developments and Milestones (New Launches, Strategic Partnerships)
3. North America Business Intelligence Market Analysis
3.1. Growth Drivers
3.1.1. Increased Data-Driven Decision-Making
3.1.2. Cloud Adoption in Enterprises
3.1.3. Rise in Big Data Analytics
3.1.4. Growing Demand for Real-Time Analytics
3.2. Market Restraints
3.2.1. Data Security Concerns
3.2.2. High Implementation Costs
3.2.3. Lack of Skilled Workforce in BI
3.3. Opportunities
3.3.1. AI Integration with BI Solutions
3.3.2. Growth in Self-Service BI Tools
3.3.3. Expansion of BI into SMBs
3.4. Trends
3.4.1. Embedded BI Solutions
3.4.2. Predictive and Prescriptive Analytics Adoption
3.4.3. Adoption of Augmented Analytics
3.5. Government Regulations
3.5.1. Data Privacy Laws (CCPA, GDPR Compliance)
3.5.2. Cybersecurity Frameworks
3.5.3. Cloud Security Guidelines
3.6. SWOT Analysis
3.7. Stakeholder Ecosystem
3.8. Porter’s Five Forces Analysis
3.9. Competition Ecosystem
4. North America Business Intelligence Market Segmentation
4.1. By Deployment Mode (In Value %)
4.1.1. On-Premise
4.1.2. Cloud-Based
4.2. By Organization Size (In Value %)
4.2.1. Large Enterprises
4.2.2. Small and Medium Enterprises (SMEs)
4.3. By Industry Vertical (In Value %)
4.3.1. BFSI
4.3.2. Retail
4.3.3. Healthcare
4.3.4. IT & Telecom
4.3.5. Manufacturing
4.4. By Technology (In Value %)
4.4.1. Artificial Intelligence (AI)
4.4.2. Machine Learning (ML)
4.4.3. Natural Language Processing (NLP)
4.4.4. Data Visualization
4.5. By Region (In Value %)
4.5.1. United States
4.5.2. Canada
4.5.3. Mexico
5. North America Business Intelligence Market Competitive Analysis
5.1. Detailed Profiles of Major Companies
5.1.1. Microsoft Corporation
5.1.2. Tableau Software
5.1.3. IBM Corporation
5.1.4. Oracle Corporation
5.1.5. Qlik Technologies
5.1.6. MicroStrategy
5.1.7. SAP SE
5.1.8. SAS Institute
5.1.9. Looker (Google LLC)
5.1.10. TIBCO Software
5.1.11. Domo, Inc.
5.1.12. Zoho Corporation
5.1.13. Sisense Inc.
5.1.14. Birst, Inc.
5.1.15. Dundas Data Visualization
5.2. Cross Comparison Parameters (Revenue, Market Presence, Technology Stack, Employee Strength, Key Clients, R&D Expenditure, Patent Portfolio, Growth Strategies)
5.3. Market Share Analysis
5.4. Strategic Initiatives
5.5. Mergers and Acquisitions
5.6. Investment Analysis
5.7. Venture Capital Funding
5.8. Government Grants and Incentives
6. North America Business Intelligence Market Regulatory Framework
6.1. Compliance with Data Privacy Regulations (CCPA, GDPR)
6.2. Data Governance Standards
6.3. Certification Processes (ISO Certifications for BI Solutions)
7. North America Business Intelligence Future Market Size (In USD Bn)
7.1. Future Market Size Projections
7.2. Key Factors Driving Future Market Growth
8. North America Business Intelligence Future Market Segmentation
8.1. By Deployment Mode (In Value %)
8.2. By Organization Size (In Value %)
8.3. By Industry Vertical (In Value %)
8.4. By Technology (In Value %)
8.5. By Region (In Value %)
9. North America Business Intelligence Market Analysts’ Recommendations
9.1. TAM/SAM/SOM Analysis
9.2. Customer Segmentation and Persona Analysis
9.3. Marketing Initiatives
9.4. White Space Opportunity Analysis
Disclaimer
Contact Us
Research Methodology
Step 1: Identification of Key Variables
The initial stage involves constructing a comprehensive ecosystem map that includes all significant stakeholders within the North America Business Intelligence market. Secondary research using credible databases is conducted to identify the critical variables influencing the market, such as technological advancements and regulatory frameworks.
Step 2: Market Analysis and Construction
Historical data from the past five years is gathered to analyze market penetration rates and revenue generation in the BI market. This step includes an evaluation of key segments such as cloud-based BI solutions and their growth trajectory.
Step 3: Hypothesis Validation and Expert Consultation
We engage in interviews with BI industry experts to validate market hypotheses. This consultation helps refine and corroborate the market data gathered through desk research, offering insights into real-world trends and market dynamics.
Step 4: Research Synthesis and Final Output
The final phase includes direct engagement with BI solution providers and end-users to validate the market data collected. This process ensures that the final report offers a comprehensive, accurate, and validated overview of the North America Business Intelligence market.
Frequently Asked Questions
01. How big is the North America Business Intelligence Market?
The North America Business Intelligence Market is valued at USD 9 billion, driven by a surge in demand for real-time data analytics and cloud-based solutions across industries such as BFSI and retail.
02. What are the key challenges in the North America Business Intelligence Market?
The North America Business Intelligence Market faces challenges such as data security concerns, high implementation costs, and the lack of skilled personnel in advanced analytics, all of which hinder the widespread adoption of BI tools.
03. Who are the major players in the North America Business Intelligence Market?
Key players in North America Business Intelligence Market include Microsoft Corporation, IBM Corporation, Tableau Software, Oracle Corporation, and Qlik Technologies. These companies dominate the market due to their advanced BI solutions and extensive customer bases.
04. What are the growth drivers of the North America Business Intelligence Market?
Growth drivers in North America Business Intelligence Market include the increasing demand for data-driven decision-making, the rise in cloud adoption, and advancements in AI and ML technologies that are improving the capabilities of BI solutions.
Why Buy From Us?
 Framework")
What makes us stand out is that our consultants follows Robust, Refine and Result (RRR) methodology. i.e. Robust for clear definitions, approaches and sanity checking, Refine for differentiating respondents facts and opinions and Result for presenting data with story

We have set a benchmark in the industry by offering our clients with syndicated and customized market research reports featuring coverage of entire market as well as meticulous research and analyst insights.

While we don't replace traditional research, we flip the method upside down. Our dual approach of Top Bottom & Bottom Top ensures quality deliverable by not just verifying company fundamentals but also looking at the sector and macroeconomic factors.

With one step in the future, our research team constantly tries to show you the bigger picture. We help with some of the tough questions you may encounter along the way: How is the industry positioned? Best marketing channel? KPI's of competitors? By aligning every element, we help maximize success.

Our report gives you instant access to the answers and sources that other companies might choose to hide. We elaborate each steps of research methodology we have used and showcase you the sample size to earn your trust.

If you need any support, we are here! We pride ourselves on universe strength, data quality, and quick, friendly, and professional service.