
North America Frac Sand Market Outlook to 2030
Region:North America
Author(s):Sanjna
Product Code:KROD10174
December 2024
96
About the Report
North America Frac Sand Market Overview
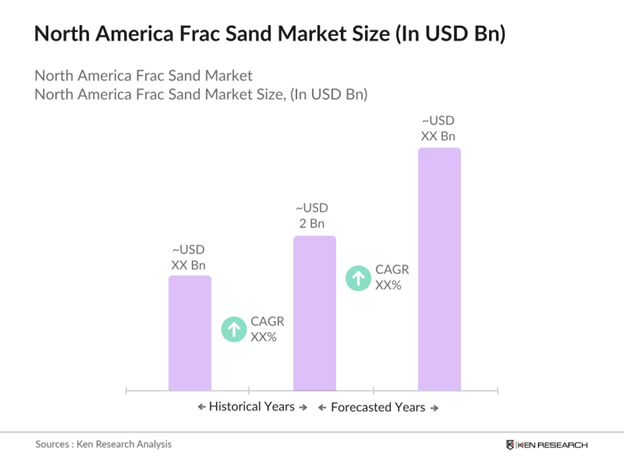
- The North America Frac Sand Market, valued at USD 2 billion in 2023, is primarily driven by the growing demand for shale gas exploration and production. The hydraulic fracturing (fracking) process, which relies heavily on frac sand as a proppant, continues to fuel the growth of this market. The need to maintain well productivity, along with the increasing number of horizontal wells drilled in regions like the Permian Basin, further accelerates this demand.
- Dominant regions in the North America frac sand market include the U.S., particularly Texas, Wisconsin, and Oklahoma, due to their proximity to major shale basins and abundant natural reserves. Texas leads the market due to its significant in-basin sand supply, especially from the Permian and Eagle Ford Basins, which are major shale-producing regions. Wisconsin also plays a critical role as a supplier of Northern White sand, a high-quality proppant preferred for deep wells.
- The U.S. Environmental Protection Agency (EPA) enforces strict standards on air and water quality related to frac sand mining and fracking operations. In 2023, new regulations were introduced requiring frac sand mines to install advanced air filtration systems to control dust emissions. These standards aim to reduce the environmental impact of hydraulic fracturing and protect surrounding communities from air pollution
North America Frac Sand Market Segmentation
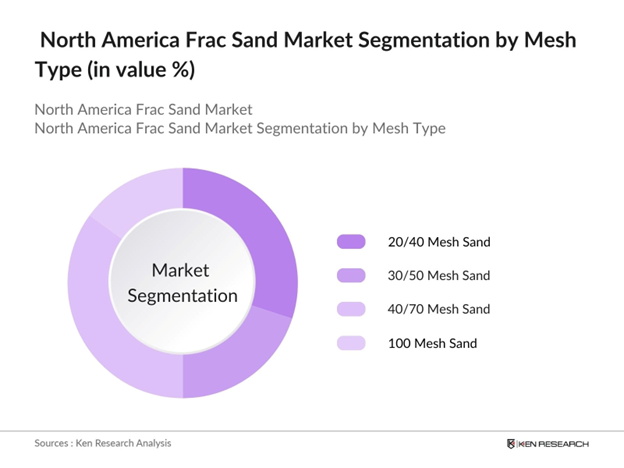
By Mesh Type: The North America frac sand market is segmented by mesh type into 20/40 mesh sand, 30/50 mesh sand, 40/70 mesh sand, and 100 mesh sand. Of these, 40/70 mesh sand dominates the market due to its versatility and effectiveness in hydraulic fracturing operations. This mesh size is preferred because it can withstand higher pressure and proppant flowback in unconventional wells, making it ideal for shale plays. The balance between grain strength and conductivity makes it a favored choice in oil and gas extraction.
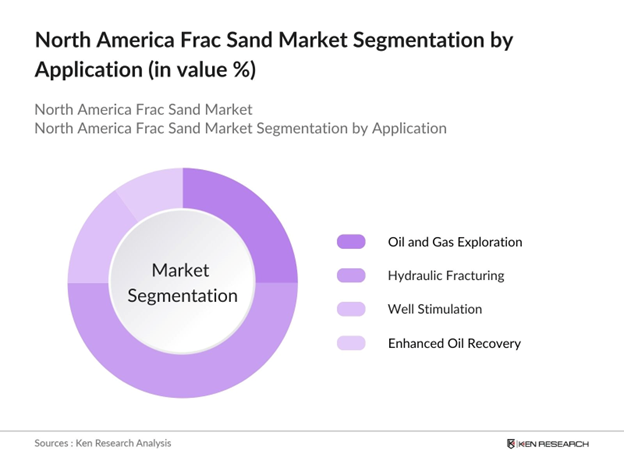
By Application: The market is also segmented by application into oil and gas exploration, hydraulic fracturing (fracking), well stimulation, and enhanced oil recovery. Hydraulic fracturing holds the dominant market share due to the widespread use of fracking technology in North American shale formations. The technique requires a significant amount of proppant, and frac sand has proven to be cost-effective and efficient in maintaining the conductivity of fractures, thus enhancing well performance.
North America Frac Sand Market Competitive Landscape
The North America frac sand market is dominated by a few key players that have established strong production and distribution networks across key regions. These companies benefit from proximity to major shale basins and have optimized their logistics and supply chain management to meet the rising demand. The presence of in-basin frac sand operations, particularly in Texas, has reduced transportation costs and increased operational efficiency.
|
Company Name |
Establishment Year |
Headquarters |
Annual Production (in tons) |
Key Markets Served |
Proximity to Shale Basins |
Mesh Size Specialization |
Innovation in Proppant Technology |
Environmental Initiatives |
|
U.S. Silica Holdings, Inc. |
1900 |
Katy, Texas |
- |
- |
- |
- |
- |
- |
|
Hi-Crush Partners LP |
2010 |
Houston, Texas |
- |
- |
- |
- |
- |
- |
|
Fairmount Santrol Holdings |
1986 |
Sugar Land, Texas |
- |
- |
- |
- |
- |
- |
|
Badger Mining Corporation |
1949 |
Berlin, Wisconsin |
- |
- |
- |
- |
- |
- |
|
Covia Holdings Corporation |
2018 |
Independence, Ohio |
- |
- |
- |
- |
- |
- |
North America Frac Sand Market Analysis
Growth Drivers
- Increased Shale Gas Exploration: The North American shale gas boom is driving the demand for frac sand. According to the U.S. Energy Information Administration (EIA), shale gas production in the United States reached approximately 27 trillion cubic feet in 2023, a significant rise from previous years, resulting in higher frac sand usage. This trend is mirrored in Canada, where shale formations such as the Montney and Duvernay are becoming major production sites. With more wells drilled and higher production rates, the demand for frac sand is forecasted to increase significantly.
- Adoption of Horizontal Drilling Technology: Horizontal drilling technology has revolutionized the oil and gas sector in North America, enabling operators to tap into vast reserves of hydrocarbons. This technique requires large amounts of frac sand for successful fracking. In 2023, over 90% of new wells in the United States employed horizontal drilling techniques, contributing to an estimated 150 million tons of frac sand usage annually. The cost-effectiveness and success of this technology in shale plays like the Permian Basin and Bakken have cemented the demand for frac sand in drilling operations.
- Rising Energy Demand in the U.S. and Canada: As energy demand grows in North America, the oil and gas industry has ramped up exploration and production activities. In 2023, total U.S. energy consumption reached 94 significantly driving the demand for frac sand. Additionally, Canada's oil production increased to 5.5 million barrels per day in 2023, further intensifying the need for hydraulic fracturing and associated frac sand.
Challenges
- Transportation and Logistics Costs: Transporting frac sand is a major challenge in North America, as it is typically sourced from regions like Wisconsin and Texas but used in distant shale formations. In 2023, transportation costs constituted up to 60% of the total frac sand cost, significantly impacting the profitability of fracking operations. Rising fuel prices, which averaged $4.5 per gallon in 2023, further exacerbated logistics expenses for companies in the oil and gas industry.
- Environmental Regulations on Sand Mining: Environmental regulations have tightened around frac sand mining due to concerns about land degradation and air pollution. Wisconsin, a leading supplier of frac sand, saw increased regulatory oversight in 2023, with the Wisconsin Department of Natural Resources introducing stricter air quality monitoring requirements. In Texas, similar measures were enacted, limiting mining operations near residential areas, impacting the supply chain and increasing compliance costs for companies.
North America Frac Sand Market Future Outlook
North America frac sand market is expected to continue its upward trajectory due to the sustained demand for hydraulic fracturing in unconventional oil and gas fields. Technological advancements in fracking operations, along with a focus on increasing well productivity, are anticipated to drive this growth. Moreover, the shift toward localized sand production, especially in Texas, is likely to reduce transportation costs and provide operational efficiencies.
Market Opportunities
- Development of In-Basin Frac Sand Supply: The development of in-basin frac sand supply has emerged as a cost-saving opportunity for North American operators. By sourcing sand locally, transportation costs can be reduced by as much as 50%. In 2023, Texas alone produced approximately 30 million tons of in-basin frac sand, meeting the majority of local demand for fracking operations in the Permian Basin. This shift toward localized supply chains enhances operational efficiency and lowers overall costs for energy companies.
- Technological Advancements in Proppant Coating: Technological innovations in proppant coating have opened new opportunities for enhancing well productivity. Coated frac sand, designed to reduce friction and enhance flowback, was widely adopted by energy companies in 2023. These coated proppants allow for improved well performance, reducing the amount of sand required per well. In Canada, advancements in coated sand technology have led to a 10% increase in well productivity, providing companies with a competitive advantage in shale exploration.
Scope of the Report
|
By Mesh Type |
20/40 Mesh Sand 30/50 Mesh Sand 40/70 Mesh Sand 100 Mesh Sand |
|
By Application |
Oil and Gas Exploration Hydraulic Fracturing (Fracking) Well Stimulation Enhanced Oil Recovery |
|
By Location of Production |
In-Basin Sand Northern White Sand Texas Brown Sand Canadian Sand Reserves |
|
By Transportation Mode |
Rail Trucking Barges |
|
By Region |
U.S. Canada Mexico |
Products
Key Target Audience
Oil and Gas Companies
Fracking Service Providers
Proppant Manufacturers
Sand Mining Companies
Transportation and Logistics Providers
Investors and Venture Capitalist Firms
Government and Regulatory Bodies (U.S. Department of Energy, Texas Railroad Commission)
Companies
Players Mentioned in the Report
U.S. Silica Holdings, Inc.
Hi-Crush Partners LP
Fairmount Santrol Holdings
Badger Mining Corporation
Covia Holdings Corporation
Smart Sand Inc.
Source Energy Services
Black Mountain Sand
Preferred Sands
Emerge Energy Services LP
Table of Contents
1. North America Frac Sand Market Overview
1.1. Definition and Scope
1.2. Market Taxonomy
1.3. Frac Sand Industry Dynamics
1.4. Market Growth Rate
1.5. Market Segmentation Overview
2. North America Frac Sand Market Size (In USD Bn)
2.1. Historical Market Size
2.2. Year-On-Year Growth Analysis
2.3. Key Market Developments and Milestones
2.4. Impact of U.S. Shale Oil Production
3. North America Frac Sand Market Analysis
3.1. Growth Drivers (Fracking Demand, Technological Advancements in Hydraulic Fracturing)
3.1.1. Increased Shale Gas Exploration
3.1.2. Adoption of Horizontal Drilling Technology
3.1.3. Rising Energy Demand in the U.S. and Canada
3.1.4. Cost Efficiency of Frac Sand Over Ceramic Proppants
3.2. Market Challenges (Supply Chain Disruptions, Environmental Restrictions)
3.2.1. Transportation and Logistics Costs
3.2.2. Environmental Regulations on Sand Mining
3.2.3. Water Usage in Hydraulic Fracturing
3.2.4. Fluctuations in Oil Prices
3.3. Opportunities (Increasing Well Efficiency, Export Potential to International Markets)
3.3.1. Development of In-Basin Frac Sand Supply
3.3.2. Technological Advancements in Proppant Coating
3.3.3. Opportunities in Deep-Well Drilling
3.3.4. Expansion of Export Opportunities to South America
3.4. Trends (Use of Fine Mesh Sand, Shift Towards Localized Sand Supply)
3.4.1. Increased Usage of 100-Mesh Sand
3.4.2. Growing Preference for In-Basin Sand
3.4.3. Reduction of Silica Dust Emissions During Transportation
3.4.4. Automation in Frac Sand Mining
3.5. Government Regulations (Environmental Policies, Fracking Permits, State-Level Restrictions)
3.5.1. U.S. Environmental Protection Agency (EPA) Standards
3.5.2. Frac Sand Mining Regulations in Wisconsin and Texas
3.5.3. Canadian Regulatory Framework for Oil and Gas Exploration
3.5.4. National Emission Standards for Hazardous Air Pollutants (NESHAP)
3.6. SWOT Analysis
3.7. Stakeholder Ecosystem
3.8. Porters Five Forces
3.9. Competition Ecosystem
4. North America Frac Sand Market Segmentation
4.1. By Mesh Size (In Value %)
4.1.1. 20/40 Mesh Sand
4.1.2. 30/50 Mesh Sand
4.1.3. 40/70 Mesh Sand
4.1.4. 100 Mesh Sand
4.2. By Application (In Value %)
4.2.1. Oil and Gas Exploration
4.2.2. Hydraulic Fracturing (Fracking)
4.2.3. Well Stimulation
4.2.4. Enhanced Oil Recovery
4.3. By Location of Production (In Value %)
4.3.1. In-Basin Sand
4.3.2. Northern White Sand
4.3.3. Texas Brown Sand
4.3.4. Canadian Sand Reserves
4.4. By Transportation Mode (In Value %)
4.4.1. Rail
4.4.2. Trucking
4.4.3. Barges
4.5. By Region (In Value %)
4.5.1. U.S.
4.5.2. Canada
4.5.3. Mexico
5. North America Frac Sand Market Competitive Analysis
5.1. Detailed Profiles of Major Companies
5.1.1. U.S. Silica Holdings, Inc.
5.1.2. Hi-Crush Partners LP
5.1.3. Fairmount Santrol Holdings Inc.
5.1.4. Emerge Energy Services LP
5.1.5. Badger Mining Corporation
5.1.6. Smart Sand Inc.
5.1.7. Covia Holdings Corporation
5.1.8. Preferred Sands
5.1.9. Source Energy Services
5.1.10. Black Mountain Sand
5.2. Cross Comparison Parameters
5.2.1 Mesh Size Specialization
5.2.2 Location of Operations
5.2.3 Transportation Infrastructure
5.2.4 In-Basin vs. Northern White Sand Usage
5.2.5 Proppant Technology Innovations
5.2.6 Key Markets Served (U.S. Shale Basins)
5.2.7 Production Capacity (in Tons)
5.2.8 Pricing Competitiveness
5.3. Market Share Analysis
5.4. Strategic Initiatives
5.5. Mergers and Acquisitions
5.6. Investment Analysis
5.7. Government Incentives
6. North America Frac Sand Market Regulatory Framework
6.1. U.S. Environmental Regulations on Sand Mining
6.2. Canadian Oil and Gas Regulatory Standards
6.3. Health and Safety Standards for Silica Exposure
6.4. Fracking Permit Requirements
7. North America Frac Sand Future Market Size (In USD Bn)
7.1. Key Factors Driving Future Market Growth
7.2. Projections for Future Market Expansion
8. North America Frac Sand Future Market Segmentation
8.1. By Mesh Size (In Value %)
8.2. By Application (In Value %)
8.3. By Location of Production (In Value %)
8.4. By Transportation Mode (In Value %)
8.5. By Region (In Value %)
9. North America Frac Sand Market Analysts Recommendations
9.1. TAM/SAM/SOM Analysis
9.2. Customer Acquisition Strategy
9.3. Growth Strategy and Strategic Partnerships
9.4. White Space Opportunity Analysis
Research Methodology
Step 1: Identification of Key Variables
The initial phase of the research involved mapping the North America frac sand market ecosystem by identifying key stakeholders such as proppant manufacturers, oil and gas companies, and regulatory bodies. Desk research utilizing government databases, market reports, and proprietary data was used to determine critical market variables such as mesh size demand and logistics challenges.
Step 2: Market Analysis and Construction
The second phase focused on compiling historical market data for the North America frac sand market, analyzing factors like market growth, mesh size distribution, and application areas such as hydraulic fracturing. The data was carefully reviewed to ensure accurate projections and reliability.
Step 3: Hypothesis Validation and Expert Consultation
During this phase, hypotheses regarding the growth of frac sand demand were validated through interviews with industry experts from major oil and gas companies, frac sand suppliers, and transportation providers. These consultations provided insights into future market trends and operational efficiencies.
Step 4: Research Synthesis and Final Output
The final step involved synthesizing the collected data and producing an in-depth market analysis. This stage also included direct consultations with frac sand producers to cross-verify production capacity, supply chain challenges, and market opportunities.
Frequently Asked Questions
01. How big is the North America Frac Sand Market?
The North America frac sand market was valued at USD 2 billion in 2023, driven by increased hydraulic fracturing activity in the U.S. shale plays, such as the Permian and Eagle Ford Basins.
02. What are the challenges in the North America Frac Sand Market?
Challenges in North America frac sand market include high transportation costs due to the location of frac sand mines relative to shale plays, environmental regulations on sand mining, and fluctuations in oil prices that impact drilling activities.
03. Who are the major players in the North America Frac Sand Market?
Major playersin North America frac sand market include U.S. Silica Holdings, Hi-Crush Partners LP, Fairmount Santrol Holdings, Badger Mining Corporation, and Covia Holdings Corporation. These companies dominate due to their strategic location near shale basins and strong distribution networks.
04. What are the growth drivers of the North America Frac Sand Market?
North America frac sand market is driven by increasing demand for shale gas exploration, advancements in fracking technology, and the rising adoption of in-basin frac sand, particularly in Texas.
Why Buy From Us?
 Framework")
What makes us stand out is that our consultants follows Robust, Refine and Result (RRR) methodology. i.e. Robust for clear definitions, approaches and sanity checking, Refine for differentiating respondents facts and opinions and Result for presenting data with story

We have set a benchmark in the industry by offering our clients with syndicated and customized market research reports featuring coverage of entire market as well as meticulous research and analyst insights.

While we don't replace traditional research, we flip the method upside down. Our dual approach of Top Bottom & Bottom Top ensures quality deliverable by not just verifying company fundamentals but also looking at the sector and macroeconomic factors.

With one step in the future, our research team constantly tries to show you the bigger picture. We help with some of the tough questions you may encounter along the way: How is the industry positioned? Best marketing channel? KPI's of competitors? By aligning every element, we help maximize success.

Our report gives you instant access to the answers and sources that other companies might choose to hide. We elaborate each steps of research methodology we have used and showcase you the sample size to earn your trust.

If you need any support, we are here! We pride ourselves on universe strength, data quality, and quick, friendly, and professional service.