
North America Smart TV Market Outlook to 2030
Region:North America
Author(s):Shreya
Product Code:KROD8528
November 2024
83
About the Report
North America Smart TV Market Overview
The North America Smart TV market is valued at USD 67.5 billion, driven by the integration of high-definition technology and smart functionality, enhancing the viewing experience and accessibility to streaming services. This growth has been fueled by increased consumer demand for on-demand content and immersive, high-quality displays. A historical analysis reveals that advancements in internet infrastructure and device compatibility have significantly impacted market size, positioning Smart TVs as central entertainment hubs within households. 
The United States and Canada lead the North America Smart TV market due to widespread broadband penetration and strong adoption rates of digital services. The dominance of the U.S. is further reinforced by its technology-forward consumer base, while Canadian market growth is attributed to high disposable income levels and increasing preference for streaming services. Both countries are home to large technology companies driving the innovation and adoption of Smart TVs.
The U.S. Department of Energy has implemented stringent energy efficiency standards for electronic devices, including Smart TVs. Models in 2024 must meet specific energy usage limits that reduce average consumption by 15 watts per unit compared to older models. These regulations encourage manufacturers to innovate more energy-efficient models, impacting production costs and aligning with consumer demand for sustainable products.
North America Smart TV Market Segmentation
By Display Type: The market is segmented by display type into LED, OLED, QLED, and other emerging display technologies. Recently, LED has dominated the market within this segment due to its affordability, durability, and energy efficiency. This dominance is influenced by high consumer preference for reasonably priced Smart TVs with dependable display technology that delivers high performance without frequent upgrades. LED TVs also offer wide availability and compatibility with various streaming and gaming platforms, making them a preferred choice for budget-conscious and value-focused consumers. 
By Screen Size: The market is segmented by screen size into below 32 inches, 3245 inches, 4655 inches, and above 55 inches. Among these, the 4655 inches segment leads the market due to its balance of immersive viewing and practicality for residential spaces. The 4655-inch TVs cater to a significant consumer segment who prioritize picture quality and a larger screen size for an enhanced experience without requiring extensive wall space, making this range a preferred option for family entertainment rooms. 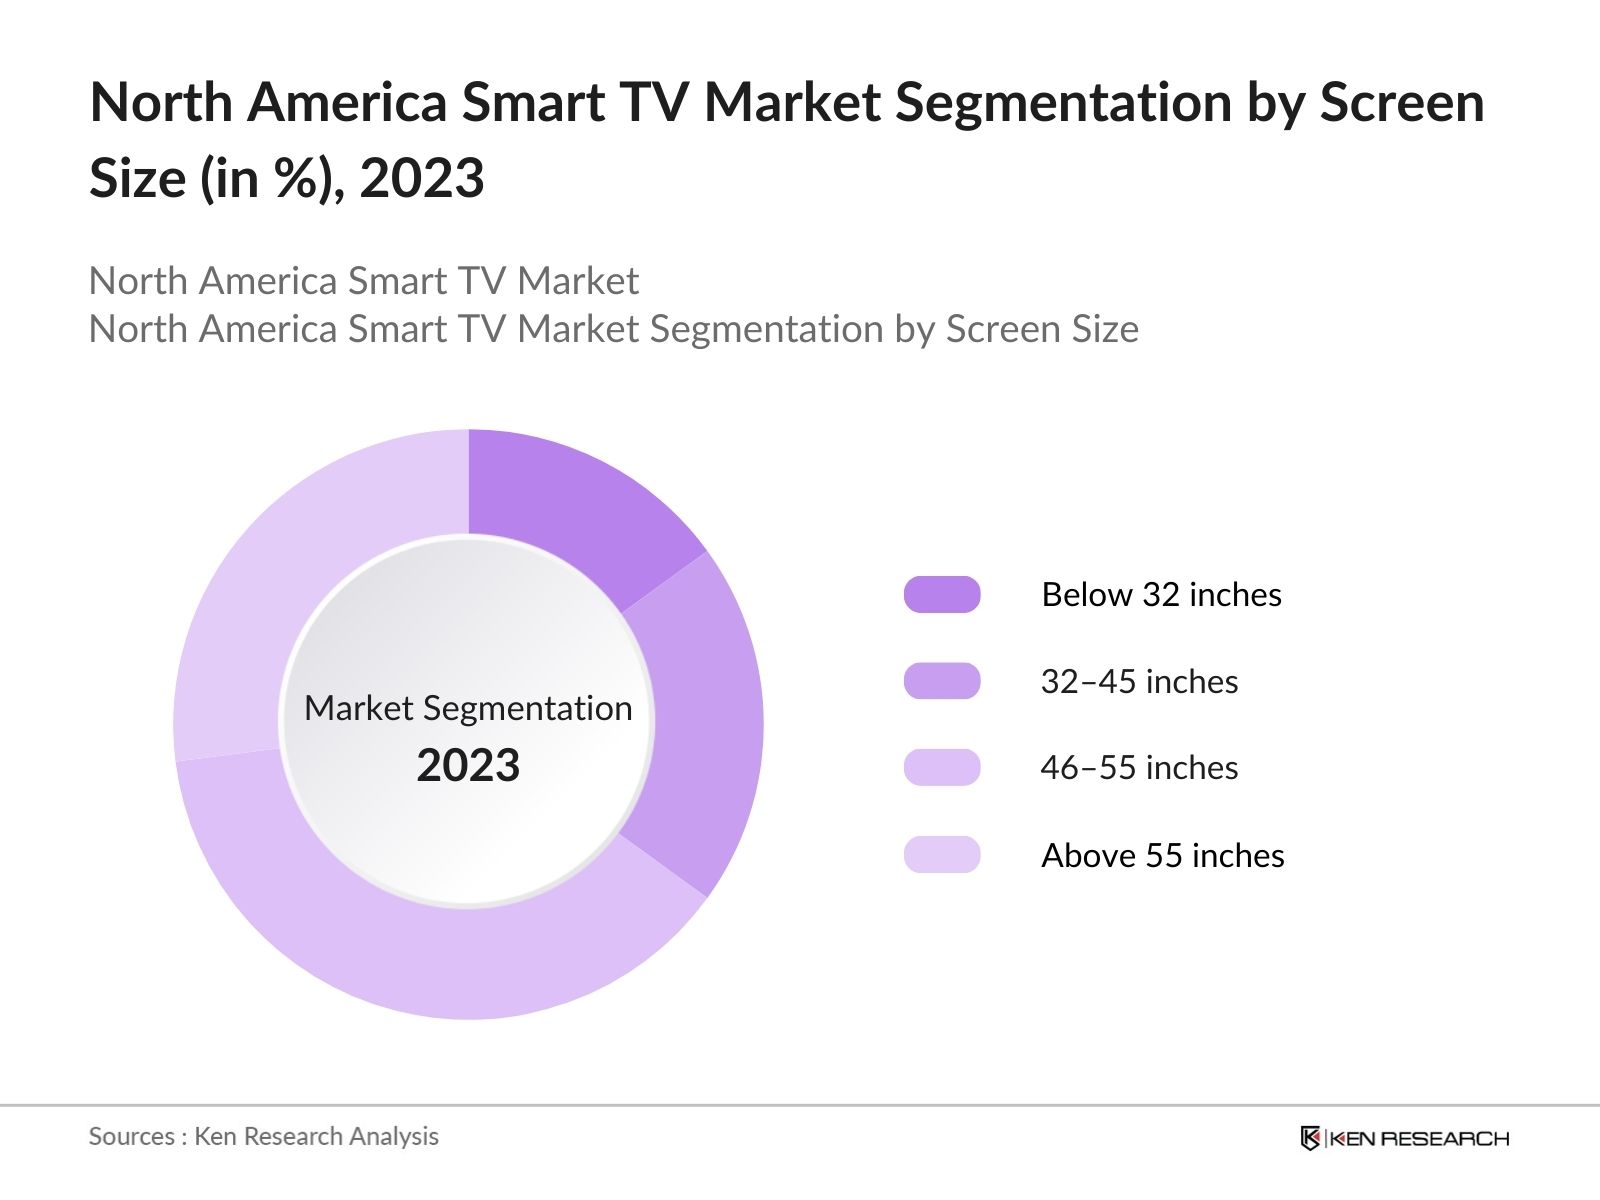
North America Smart TV Market Competitive Landscape
The North America Smart TV market is dominated by established players with strong R&D capabilities and broad distribution networks. Companies like Samsung, Sony, and LG hold significant market influence, benefiting from long-standing brand loyalty and extensive consumer outreach.
|
Company |
Establishment Year |
Headquarters |
Revenue (USD Mn) |
Employees |
Key Product Line |
Annual R&D Spending (USD Mn) |
Market Position |
Distribution Reach |
Brand Reputation |
|
Samsung Electronics |
1969 |
Suwon, South Korea |
- | - | - | - | - | - | - |
|
LG Electronics |
1958 |
Seoul, South Korea |
- | - | - | - | - | - | - |
|
Sony Corporation |
1946 |
Tokyo, Japan |
- | - | - | - | - | - | - |
|
TCL Corporation |
1981 |
Huizhou, China |
- | - | - | - | - | - | - |
|
Vizio Inc. |
2002 |
California, USA |
- | - | - | - | - | - | - |
North America Smart TV Industry Analysis
Growth Drivers
Internet Penetration Rates: Internet penetration is a key driver for the North American Smart TV market. With over 329 million people connected to the internet in North America in 2023, Smart TVs have become highly relevant as these devices rely on internet connectivity for streaming services and applications. Broadband subscriptions are now accessible to 85 out of every 100 individuals, according to the International Telecommunication Union (ITU), with the average speed exceeding 100 Mbps in most urban areas. This robust infrastructure has significantly boosted the demand for Smart TVs as consumers seek seamless access to digital content.
Shift to On-Demand Streaming; On-demand streaming through OTT platforms has experienced a major surge, with nearly 82 million North American households subscribing to at least one OTT service in 2023, according to the Federal Communications Commission (FCC). As these platforms rely heavily on Smart TVs for content delivery, the market has seen notable growth. OTT services now represent a significant portion of household entertainment spending, driven by consumer preferences for flexible and diverse content, propelling further Smart TV adoption in both the United States and Canada.
Technological Advancements in Display Quality: Innovations in display technologies such as OLED, QLED, and Mini-LED have been pivotal in Smart TV market growth. Reports from the U.S. Department of Energy (DOE) indicate that OLED displays now have a 30% higher energy efficiency than standard LED TVs. Additionally, the increased demand for 4K and 8K resolution among North American consumers reflects a preference for immersive viewing experiences, spurred by content providers enhancing video quality for streaming platforms.
Market Challenges
High Product Costs: High product costs remain a challenge for Smart TV penetration, particularly in lower-income households. According to the U.S. Census Bureau, the average cost of a Smart TV in North America is nearly three times that of a standard HD television. Although prices have gradually decreased with technological advancements, affordability remains a barrier for a broader consumer base, especially in economically disadvantaged areas.
Data Privacy Concerns: Data privacy has become a significant issue, with nearly 70% of North American consumers expressing concerns over data security on connected devices, including Smart TVs, according to the Office of the Privacy Commissioner of Canada. The market faces challenges as consumers become more aware of privacy issues and potential misuse of personal data. These concerns underscore the importance of stringent data protection practices, potentially impacting Smart TV sales if unaddressed.
North America Smart TV Market Future Outlook
The North America Smart TV market is set for substantial growth, driven by rapid advancements in screen technology and integration with IoT-enabled devices. Continued development in AI features, such as voice and gesture controls, is expected to enhance consumer experiences, while partnerships with streaming service providers will broaden content accessibility. Furthermore, an increase in consumer inclination toward larger screen sizes and high-resolution formats indicates a positive growth trajectory.
Future Market Opportunities
Voice and AI-Enabled Controls: Smart TVs are increasingly integrating AI-based voice assistants, with approximately 40% of new models offering this feature as of 2023, driven by consumer demand for convenient control options (FCC). AI functionality, such as personalized content suggestions and seamless integration with other devices, provides Smart TV manufacturers an opportunity to differentiate their products and enhance user experience.
Smart Home Integration: With North American households adopting smart home systems at record rates39 million homes by 2023 according to the U.S. Census BureauSmart TVs that connect to home systems provide notable growth opportunities. Smart TVs now function as control hubs for other connected devices, allowing consumers to manage everything from lighting to security systems, thus expanding the Smart TVs role beyond traditional entertainment and driving market growth.
Scope of the Report
|
Segments |
Sub-Segments |
|
Display Type |
LED |
|
Screen Size |
Below 32 inches |
|
Resolution |
HD |
|
Distribution Channel |
Offline Retail |
|
Application |
Residential |
Products
Key Target Audience
Investor and Venture Capitalist Firms
Government and Regulatory Bodies (FCC, FTC)
Telecommunications Providers
OTT Streaming Service Providers
Retail and E-commerce Chains
Home Entertainment System Integrators
Smart Home Technology Vendors
Technology and Media Industry Analysts
Companies
Major Players in North America Smart TV Market
Samsung Electronics
LG Electronics
Sony Corporation
TCL Corporation
Vizio Inc.
Hisense
Panasonic Corporation
Philips Electronics
Sharp Corporation
Skyworth
Haier Group
Sanyo
Amazon Fire TV
Apple TV
Toshiba Corporation
Table of Contents
1. North America Smart TV Market Overview
1.1 Definition and Scope
1.2 Market Taxonomy
1.3 Market Growth Rate
1.4 Market Segmentation Overview
2. North America Smart TV Market Size (in USD Mn)
2.1 Historical Market Size
2.2 Year-On-Year Growth Analysis
2.3 Key Market Developments and Milestones
3. North America Smart TV Market Analysis
3.1 Growth Drivers
3.1.1 Internet Penetration Rates
3.1.2 Shift to On-Demand Streaming (OTT platforms)
3.1.3 Technological Advancements in Display Quality
3.1.4 Rising Disposable Income and Living Standards
3.2 Market Challenges
3.2.1 High Product Costs
3.2.2 Data Privacy Concerns
3.2.3 Dependency on Broadband Infrastructure
3.3 Opportunities
3.3.1 Voice and AI-Enabled Controls
3.3.2 Smart Home Integration
3.3.3 Expanding Consumer Base in Rural Areas
3.4 Trends
3.4.1 4K and 8K Display Adoption
3.4.2 Partnerships with OTT Service Providers
3.4.3 Gamification and Interactive TV
3.5 Government Regulation
3.5.1 Energy Efficiency Standards
3.5.2 Data Protection and Privacy Laws
3.5.3 Standards for Display Technology
3.6 SWOT Analysis
3.7 Stakeholder Ecosystem
3.8 Porters Five Forces Analysis
3.9 Competition Ecosystem
4. North America Smart TV Market Segmentation
4.1 By Display Type (in Value %)
4.1.1 LED
4.1.2 OLED
4.1.3 QLED
4.1.4 Others
4.2 By Screen Size (in Value %)
4.2.1 Below 32 inches
4.2.2 3245 inches
4.2.3 4655 inches
4.2.4 Above 55 inches
4.3 By Resolution (in Value %)
4.3.1 HD
4.3.2 Full HD
4.3.3 4K
4.3.4 8K
4.4 By Distribution Channel (in Value %)
4.4.1 Offline Retail
4.4.2 Online Retail
4.5 By Application (in Value %)
4.5.1 Residential
4.5.2 Commercial (Hotels, Hospitals, Offices)
5. North America Smart TV Market Competitive Analysis
5.1 Detailed Profiles of Major Companies
5.1.1 Samsung Electronics
5.1.2 LG Electronics
5.1.3 Sony Corporation
5.1.4 TCL Corporation
5.1.5 Vizio Inc.
5.1.6 Panasonic Corporation
5.1.7 Hisense
5.1.8 Sharp Corporation
5.1.9 Toshiba Corporation
5.1.10 Philips Electronics
5.1.11 Skyworth
5.1.12 Haier Group
5.1.13 Sanyo
5.1.14 Amazon Fire TV
5.1.15 Apple TV
5.2 Cross Comparison Parameters (Product Offerings, Revenue, Market Share, Distribution Networks, Innovation Rate, Partnerships, Consumer Ratings, Product Quality)
5.3 Market Share Analysis
5.4 Strategic Initiatives
5.5 Mergers and Acquisitions
5.6 Investment Analysis
5.7 Venture Capital Funding
5.8 Government Grants
5.9 Private Equity Investments
6. North America Smart TV Market Regulatory Framework
6.1 Energy Efficiency Compliance
6.2 Privacy and Security Regulations
6.3 Import and Export Restrictions
7. North America Smart TV Future Market Size (in USD Mn)
7.1 Future Market Size Projections
7.2 Key Factors Driving Future Market Growth
8. North America Smart TV Future Market Segmentation
8.1 By Display Type (in Value %)
8.2 By Screen Size (in Value %)
8.3 By Resolution (in Value %)
8.4 By Distribution Channel (in Value %)
8.5 By Application (in Value %)
9. North America Smart TV Market Analysts Recommendations
9.1 TAM/SAM/SOM Analysis
9.2 Customer Cohort Analysis
9.3 Marketing Initiatives
9.4 White Space Opportunity Analysis
Disclaimer Contact UsResearch Methodology
Step 1: Identification of Key Variables
This initial phase focuses on mapping the Smart TV ecosystem, identifying primary stakeholders, and collecting data on market factors like consumer behavior and technological trends. Proprietary databases and secondary research sources help construct an in-depth understanding of the markets underlying dynamics.
Step 2: Market Analysis and Data Construction
In this stage, a detailed analysis of historical data is conducted to assess market size, screen size preferences, and adoption rates. Additionally, data on regional consumption patterns is compiled, providing insight into the distribution and segmentation trends in the North American Smart TV market.
Step 3: Hypothesis Validation and Expert Consultation
Research hypotheses are validated through expert interviews with key players and industry experts. These interviews provide qualitative insights into product trends and regulatory impacts on the Smart TV market, adding accuracy and depth to the analysis.
Step 4: Research Synthesis and Final Output
The final stage combines data synthesis from various resources, including insights from manufacturers and market participants. This process ensures a comprehensive, validated market report tailored to the specific trends and dynamics of the North American Smart TV industry.
Frequently Asked Questions
How big is the North America Smart TV Market?
The North America Smart TV market is valued at USD 67.5 billion, reflecting a strong consumer shift toward smart home integration and digital entertainment options.
What are the key growth drivers in the North America Smart TV Market?
Key drivers include increasing internet penetration, rising demand for high-quality displays, and a growing trend in on-demand content consumption.
Who are the leading players in the North America Smart TV Market?
Leading players in the market include Samsung Electronics, Sony Corporation, LG Electronics, TCL Corporation, and Vizio Inc., which dominate due to their innovation-driven portfolios and extensive distribution networks.
What challenges does the North America Smart TV Market face?
Challenges include data privacy concerns, high production costs, and the dependency on internet infrastructure to deliver optimal Smart TV functionalities.
Which screen size segment is most popular in North America?
The 4655 inches segment is the most popular due to its balance of immersive viewing experience and suitability for residential spaces, attracting a wide consumer base across the region.
Why Buy From Us?
 Framework")
What makes us stand out is that our consultants follows Robust, Refine and Result (RRR) methodology. i.e. Robust for clear definitions, approaches and sanity checking, Refine for differentiating respondents facts and opinions and Result for presenting data with story

We have set a benchmark in the industry by offering our clients with syndicated and customized market research reports featuring coverage of entire market as well as meticulous research and analyst insights.

While we don't replace traditional research, we flip the method upside down. Our dual approach of Top Bottom & Bottom Top ensures quality deliverable by not just verifying company fundamentals but also looking at the sector and macroeconomic factors.

With one step in the future, our research team constantly tries to show you the bigger picture. We help with some of the tough questions you may encounter along the way: How is the industry positioned? Best marketing channel? KPI's of competitors? By aligning every element, we help maximize success.

Our report gives you instant access to the answers and sources that other companies might choose to hide. We elaborate each steps of research methodology we have used and showcase you the sample size to earn your trust.

If you need any support, we are here! We pride ourselves on universe strength, data quality, and quick, friendly, and professional service.