Join Meeting Now

Your data is secure and never shared.

United States
July 2026

North America Soju Market Size, Share & Forecast, By Product Type, Price Tier & Distribution Channel, 2026-2031

2031

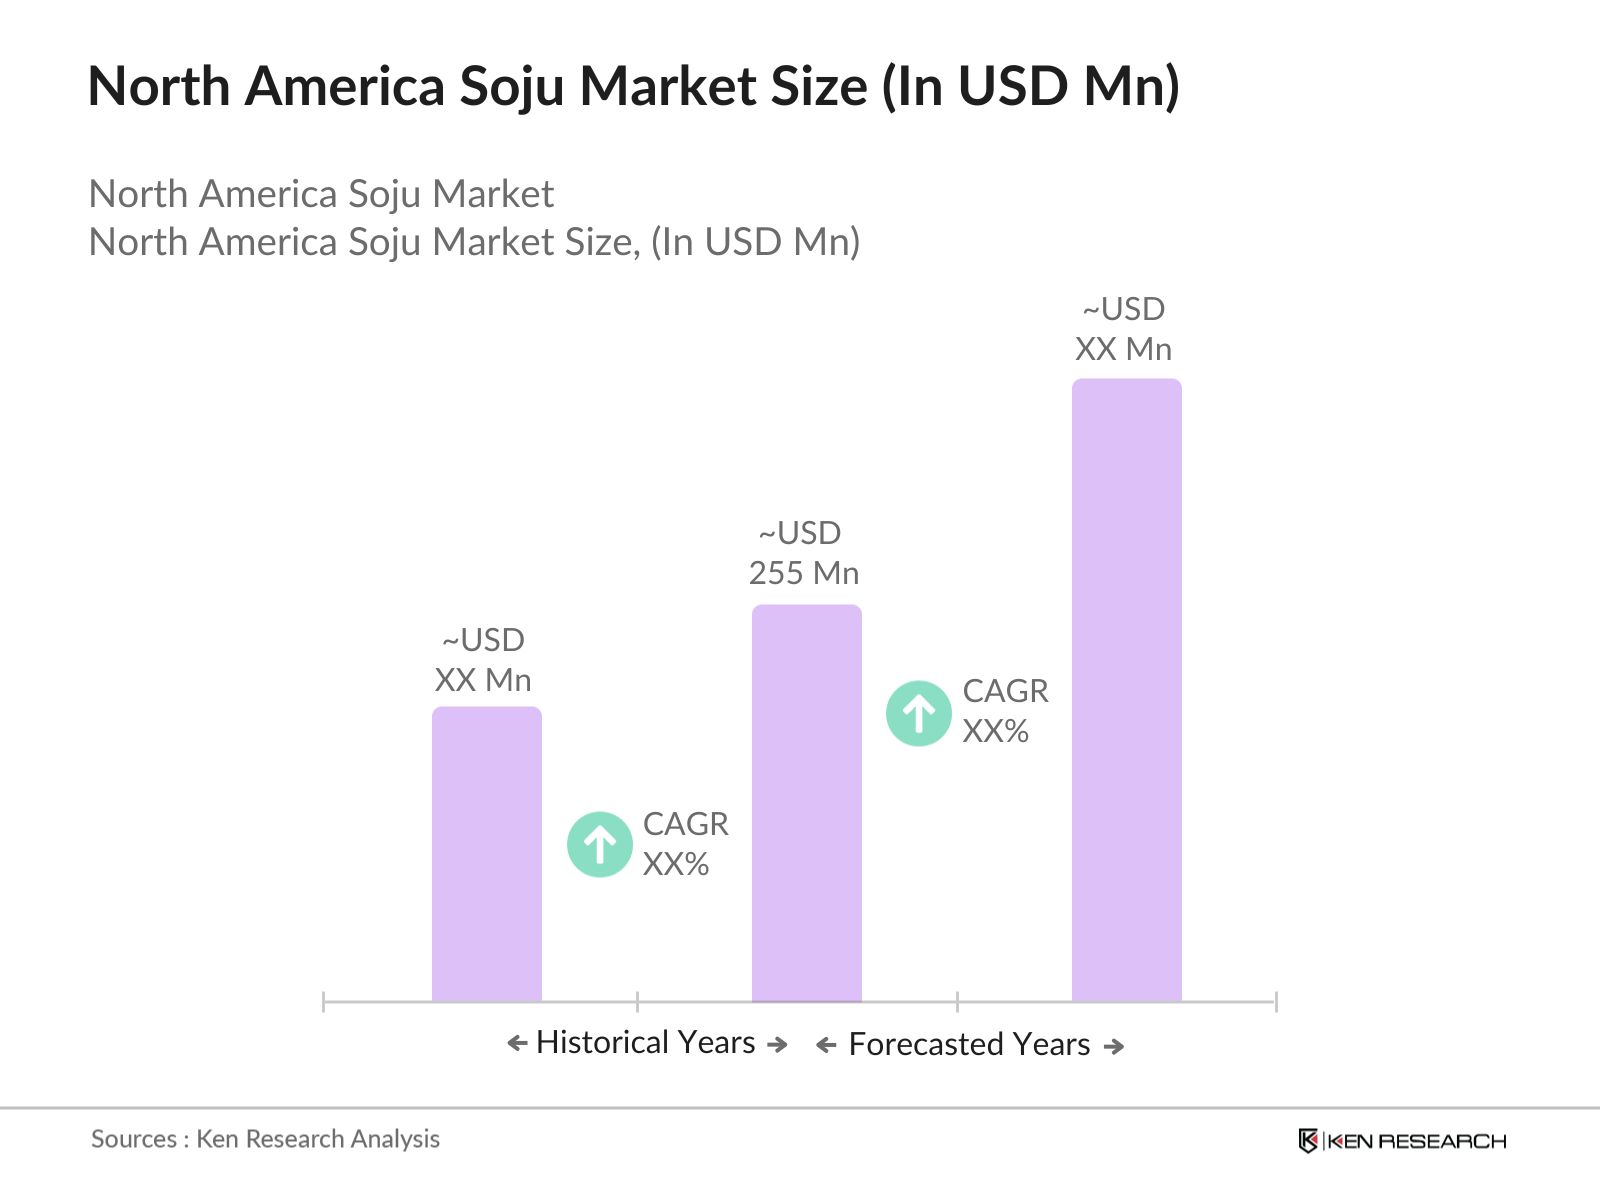
The North America Soju Market worth USD 566 million in 2025 is growing at a CAGR of 14.20% to reach USD 1.255 billion by 2031. HiteJinro, Lotte Chilsung Beverage, Muhak, Bohae Brewery and Hallasan are the major companies operating in this market.

Report Details

Base Year

2025

Pages

85

Region

United States

Author

Ken Research

Product Code
KR-RPT-V02-01525

CHAPTER 1 - MARKET SUMMARY

Market Overview

The North America Soju Market operates through importers, licensed distributors, ethnic grocery chains, liquor stores and restaurant accounts, with retail value concentrated in 360-375 mL bottles. In 2024, the United States absorbed 24.3% of Korea's record USD 200 million soju exports, demonstrating that demand has moved beyond diaspora-only consumption into broader Korean cuisine, nightlife and K-culture occasions.

The United States is the commercial hub, accounting for an estimated 84% of North American category value in 2025. California, New York, New Jersey, Texas and Illinois form the primary distribution corridor because they combine dense Korean restaurant clusters, large Asian populations and national alcohol wholesaler coverage. Canada contributes a smaller but more structured route through provincial liquor boards and concentrated metro demand.

Market Value

USD 566 million

2025

Dominant Region

United States

Dominant Segment

Flavored Soju

fastest growing

Total Number of Players

42

Future Outlook

The North America Soju Market is projected to expand from USD 566 Mn in 2025 to USD 1,255 Mn by 2031, representing a 14.20% forecast CAGR. Growth is expected to moderate from the 21.36% historical CAGR recorded during 2020-2025 as the category moves from early adoption toward broader retail normalization. Flavored soju will remain the volume acquisition engine, while premium traditional and craft labels will capture a larger share of gross profit through higher realized pricing, restaurant placements and cocktail applications.

By 2031, North American volume is projected to reach 71.6 million liters, compared with 36.5 million liters in 2025. Average realized value is expected to rise from USD 15.5 per liter to approximately USD 17.5 per liter as premium bottles, ready-to-serve formats and direct account activation increase. The United States will retain scale leadership, while Canada and Mexico offer attractive whitespace where provincial listings, distributor education and Korean foodservice density can support above-mainstream spirits growth.

14.20%

Forecast CAGR

$1,255 Mn

2030 Projection

Base Year

2025

Historical Period

2020-2025

Forecast Period

2026-2031

Historical CAGR

21.36%

CHAPTER 2 - SCOPE OF REPORT

Scope of the Market

Click to Explore Interactive Mind Map

CHAPTER 3 - Key Stakeholders

Key Target Audience

Key stakeholders who can leverage from this market analysis for investment, strategy, and operational planning.

Investors

CAGR, premiumization, distributor productivity, concentration, exit potential

Corporates

portfolio gaps, pricing ladders, channel velocity, brand economics

Government

excise revenue, licensing, responsible consumption, trade compliance

Operators

menu margins, flavor turns, inventory, account activation

Financial institutions

working capital, importer credit, cash conversion, demand stability

What You'll Gain

  • Market sizing and trajectory
  • Policy and compliance mapping
  • Trade exposure indicators
  • Segment structure and levers
  • Competitive landscape shortlist
  • CEO-grade risk priorities

80+

Pages of insights

CHAPTER 4 - Market Size & Growth

Market Size, Growth Forecast and Trends

This section evaluates the historical market size, analyzes year-over-year growth dynamics, and presents forecast projections supported by market performance indicators and demand-side drivers.

Historical & Projected Market Size ($ Million)

Year-over-Year Growth Rate (%)

Market Value vs Volume Growth (%)

Historical Market Performance (2020-2025)

Growth accelerated from 20.5% in 2021 to a peak 26.0% in 2023 as Korean foodservice reopened, flavored labels widened trial and importers expanded beyond core ethnic channels. The category's volume increased from 15.7 million liters in 2020 to 36.5 million liters in 2025. Growth moderated to 14.1% in 2025 as the comparison base normalized and major metros moved from launch-led distribution toward repeat purchase and account productivity.

Forecast Market Outlook (2026-2031)

The market is forecast to sustain 14.20% CAGR through 2031, with annual value growth holding near 14% as volume expansion of roughly 10-12% combines with gradual premiumization. Flavored soju is projected to reach 50% of category value by 2031, while average realized value rises to about USD 17.5 per liter. The terminal market value of USD 1,255 Mn assumes wider national retail coverage, stronger Canada and Mexico distribution and continued restaurant cocktail adoption.

CHAPTER 5 - Market Data

Market Breakdown

The market combines high-volume imported mainstream labels with a smaller but faster-margin premium craft pool. For CEOs and investors, volume growth, average realized value and flavored-product mix are the clearest indicators of distributor productivity and long-term category quality.

Market Breakdown

Historical Data (2020-2024) • Base Data (2025) • Forecast Data (2026-2031)

Year
Market Size (USD Mn)
YoY Growth (%)
Volume (Mn Liters)
Average Realized Value (USD/L)
Flavored Soju Share (%)
Period
2020$215 Mn+-15.713.7
$#%
Forecast
2021$259 Mn+20.5%18.514.0
$#%
Forecast
2022$323 Mn+24.7%22.814.2
$#%
Forecast
2023$407 Mn+26.0%28.414.3
$#%
Forecast
2024$496 Mn+21.9%33.015.0
$#%
Forecast
2025$566 Mn+14.1%36.515.5
$#%
Forecast
2026$646 Mn+14.1%40.915.8
$#%
Forecast
2027$737 Mn+14.1%45.716.1
$#%
Forecast
2028$842 Mn+14.2%51.116.5
$#%
Forecast
2029$962 Mn+14.3%57.216.8
$#%
Forecast
2030$1099 Mn+14.2%64.017.2
$#%
Forecast
2031$1255 Mn+14.2%71.617.5
$#%
Forecast

Volume

36.5 million liters, 2025, North America. Volume scale indicates that category economics now depend on replenishment velocity and national wholesaler execution rather than isolated novelty launches. Korea exported 124,000 metric tons of soju globally in 2024, up 4.2%.

Average Realized Value

USD 15.5 per liter, 2025, North America. Value per liter will determine whether premium craft and on-premise formats expand the profit pool faster than mainstream bottles. TTB added 350 mL and 355 mL among approved distilled-spirit standards of fill in 2025, supporting packaging flexibility.

Flavored Soju Share

38%, 2025, North America. Flavored variants are the main recruitment mechanism for consumers unfamiliar with traditional soju and support broader grocery placement. Jinro's portfolio includes grapefruit, green grape, plum, strawberry, peach and lemon expressions at 13% ABV.

CHAPTER 6 - Segmentation

Market Segmentation Framework

Comprehensive analysis across key dimensions providing insights into market structure, consumer preferences, and distribution patterns.

No of Segments

7

Dominant Segment

Product Type

Fastest Growing Segment

Distribution Channel

Product Type

Diluted Soju
$%
Flavored Soju
$%
Traditional Distilled Soju
$%
Premium Craft Soju
$%

Price Tier

Value
$%
Mainstream
$%
Premium
$%
Super-Premium
$%

Customer Type

Korean Diaspora Consumers
$%
Broader Asian Consumers
$%
Mainstream Legal-Age Consumers
$%
Hospitality Buyers
$%

Purchase Occasion

Korean Dining Pairing
$%
At-Home Socializing
$%
Nightlife and Cocktails
$%
Gifting and Collecting
$%

Distribution Channel

Korean and Asian Grocery
$%
Liquor Stores
$%
On-Premise Restaurants and Bars
$%
E-Commerce and Delivery
$%
Mass Retail Clubs
$%

Packaging Format

360-375 mL Glass Bottles
$%
700-750 mL Bottles
$%
Cans and Ready-to-Serve
$%
Multi-Pack Cases
$%

Geography

United States
$%
Canada
$%
Mexico
$%
Other North America
$%

Key Segmentation Takeaways

Comprehensive analysis across all extracted segmentation dimensions providing insights into market structure, consumer preferences, and distribution patterns.

Product Type

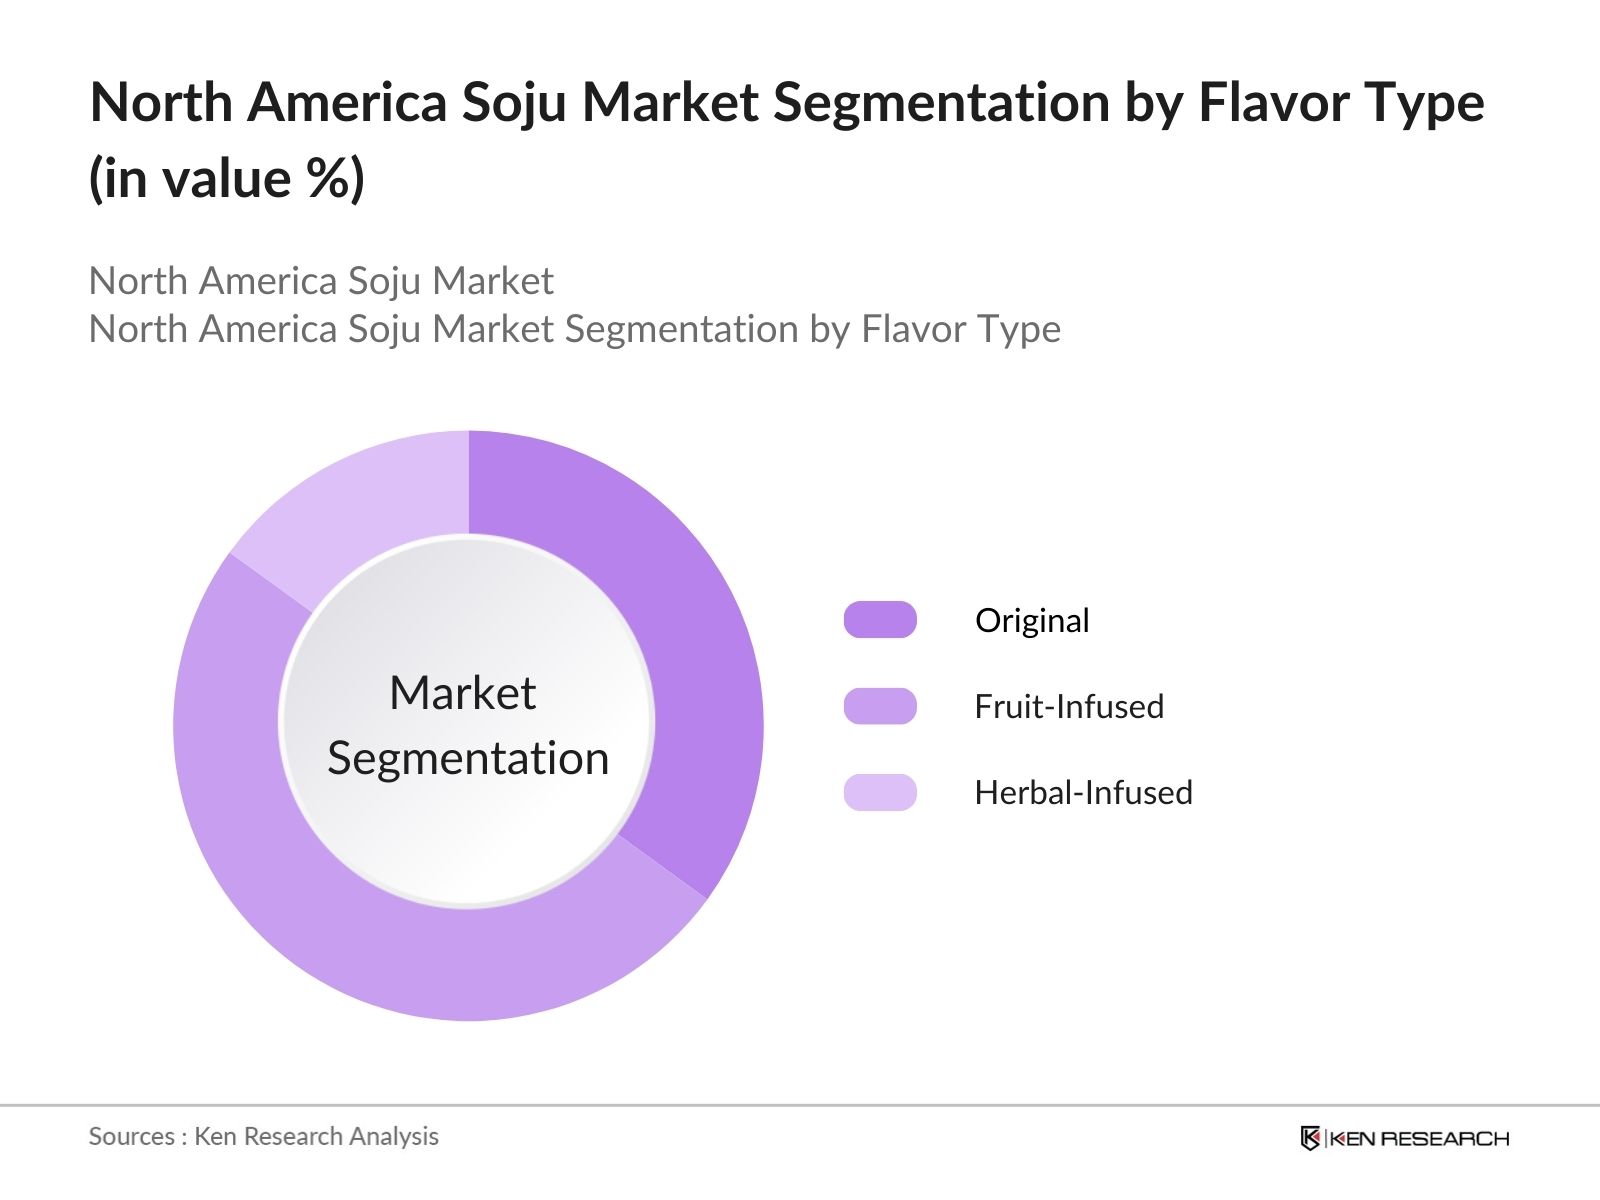
Diluted soju remains the revenue anchor because green-bottle formats deliver low unit prices, broad Korean restaurant recognition and efficient container economics. Flavored soju is narrowing the gap by recruiting first-time consumers, while traditional distilled and premium craft labels create disproportionate margin through higher ABV, provenance and cocktail credibility.

Distribution Channel

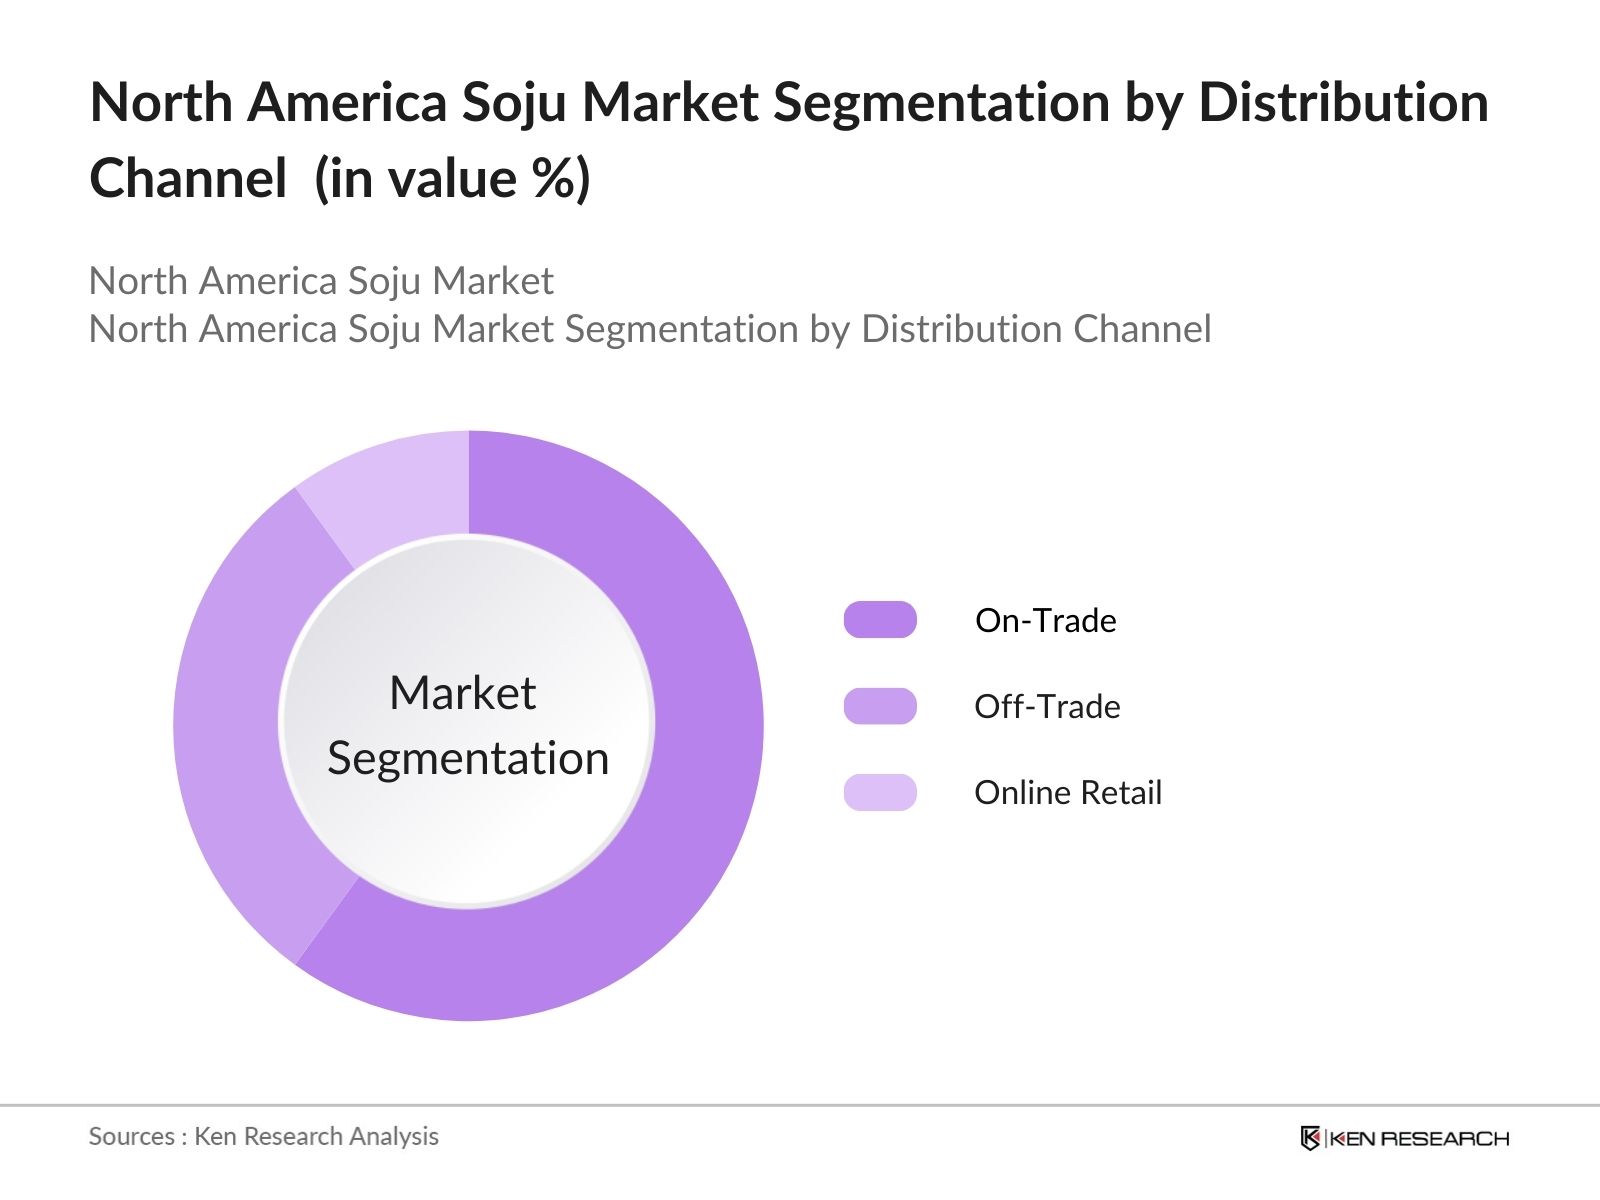
E-commerce and delivery are the fastest-growing routes because they improve flavor discovery, assortment visibility and repeat ordering outside Korean districts. On-premise restaurants remain essential for trial and cultural education, but mass retail programs and national liquor chains will determine whether soju converts from an ethnic specialty into a normalized low-ABV spirits category.

CHAPTER 7 - Regional Analysis

Regional Analysis

The United States is the scale center of the North American soju category, while Canada offers regulated retail depth and Mexico provides the strongest white-space growth profile. The peer comparison shows that market size follows Korean foodservice density, importer reach and alcohol retail accessibility rather than population alone.

Focus Country Ranking

1st

Focus Country Market Size

USD 474 Mn (2025)

Focus Country CAGR

14.3% (2026-2031)

Regional Analysis (Current Year)

Regional Analysis Comparison

MetricUnited StatesCanadaMexicoPanamaDominican Republic
Market SizeUSD 474 MnUSD 62 MnUSD 18 MnUSD 6 MnUSD 4 Mn
CAGR (%)14.3%13.5%15.2%12.0%11.4%
Korean-Origin Population (000)2,0002181221
Estimated National Soju Brand Listings3218954

Market Position

The United States ranks first with USD 474 Mn in 2025, supported by its 24.3% share of Korea's 2024 soju export value and national wholesaler coverage.

Growth Advantage

United States CAGR of 14.3% trails Mexico's 15.2% but exceeds Canada's 13.5%, positioning it as the region's largest growth engine rather than the fastest percentage-growth market.

Competitive Strengths

California and New York allow qualifying low-ABV soju through wine-licensed on-premise accounts, while a Korean-origin population above 2 million and dense Korean dining clusters strengthen trial economics.

CHAPTER 8 - INDUSTRY ANALYSIS

Growth Drivers, Challenges & Opportunities

Comprehensive analysis of key factors shaping the North America Soju Market, including growth catalysts, operational challenges, and emerging opportunities across production, distribution, and consumer segments.

Growth Drivers

Korean Cultural and Foodservice Spillover

  • 95 export markets (2024, Korea) indicate that global awareness is broad enough to support North American category education beyond Korean diaspora communities. Importers benefit through lower consumer-acquisition costs when K-food and K-content create initial product recognition.
  • 24.3% export share (2024, United States) makes the United States Korea's largest soju destination, improving negotiating leverage for national distributors and justifying dedicated brand teams, chain-account programs and local inventory.
  • 217,650 Korean-origin residents (2021, Canada) provide a durable core-consumer base while East and Southeast Asian communities expand adjacent demand. Retailers can use diaspora-heavy metros as launch markets before widening into mainstream channels.

Low-ABV and Flavor-Led Recruitment

  • Six major fruit flavors (2025, Jinro portfolio) allow retailers to create variety packs and repeat-purchase cycles, increasing shelf productivity compared with a single traditional SKU. Producers capture value through faster innovation and limited-edition launches.
  • 12-20% ABV (2024, commercial soju range) makes soju suitable for chilled shots, food pairing and lower-proof cocktails. Bars benefit from flexible menu engineering, while consumers gain a bridge between wine-strength beverages and 40% ABV spirits.
  • 50% projected flavored share (2031, North America) shifts the category toward flavor portfolio management, requiring producers to localize sweetness, citrus intensity and packaging rather than rely only on heritage positioning.

Distribution Normalization

  • Three Lotte soju brands (2024, United States) entered expanded distribution through Spirit of Gallo, strengthening wholesaler reach for Chum Churum, Soonhari and Saero and increasing competitive pressure on incumbent importers.
  • 350 mL and 355 mL formats approved (2025, United States) improve packaging flexibility for Asian bottle conventions and canned formats, reducing compliance friction for format innovation and co-packing.
  • 84% regional value share (2025, United States) gives suppliers a scale market for national account investment, but incremental growth increasingly depends on Canada, Mexico and secondary U.S. metros where listing density remains lower.

Market Challenges

Fragmented Alcohol Regulation

  • Three-tier distribution requirements (2025, United States) separate suppliers, wholesalers and retailers in most states, reducing direct control over price, inventory and account execution. Smaller brands face higher working-capital needs and slower geographic rollout.
  • 24% ABV threshold (2025, California) creates attractive wine-license access for qualifying soju but limits higher-proof premium products, forcing separate channel strategies and potentially different distributor economics by expression.
  • Provincial liquor control (2025, Canada) centralizes listings and markups, improving scale once approved but lengthening launch cycles and increasing dependence on tender timing, provincial assortment criteria and warehouse allocation.

Moderating Alcohol Category Consumption

  • USD 6.9 billion spirit sales (2023/2024, Canada) provide a large addressable base, but whisky, vodka and liqueurs dominate shelf space. Soju suppliers must demonstrate incremental category value to secure durable listings.
  • 23.0% vodka share (2023/2024, Canada) indicates direct competition from a familiar neutral spirit. Soju needs differentiated food pairing, lower-ABV occasions and flavor innovation to avoid being perceived as a substitute with limited pricing power.
  • 14.1% market growth (2025, North America) is below the 26.0% peak recorded in 2023, requiring investors to value distributor productivity and repeat rates more heavily than launch-driven top-line expansion.

Import and Brand Concentration Risk

  • 67.7% combined export share (2024, United States, China and Japan) concentrates Korean suppliers' global demand across three markets, creating allocation risk if one market experiences a sudden promotional or regulatory shift.
  • 67% estimated top-two supplier share (2025, North America) gives HiteJinro and Lotte significant bargaining power over importers and retailers, while smaller brands must compete through premium provenance, regional exclusivity or faster innovation.
  • 124,000 metric tons exported (2024, Korea) require reliable ocean freight, glass supply and bonded warehousing. Any logistics shock can create stock-outs because demand is concentrated in specific flavors and pack sizes rather than fully interchangeable SKUs.

Market Opportunities

Premium Craft and Local Production

  • USD 17.5 per liter projected value (2031, North America) creates a monetizable premiumization gap for barrel-aged, rice-specific and higher-ABV expressions sold through specialty retail and chef-led on-premise accounts.
  • Four visible U.S. craft producers (2025, United States), including Yobo, West 32, Minhwa and emerging regional distillers, indicate a still-open field where investors can fund capacity, tasting rooms and distributor-led geographic expansion.
  • 24% ABV limit (2025, California) now includes domestically produced qualifying soju for wine-licensed accounts, but producers must align formulation, labeling and channel strategy to use this access advantage.

Mainstream Retail Conversion

  • USD 3.50 per 375 mL bottle (2026, United States) demonstrates that private-label or value-positioned soju can reach mainstream shoppers at an accessible trial price. Retailers benefit from novelty traffic and summer flavor programs.
  • 50% flavored share (2031, North America) supports seasonal assortment, mixed cases and limited-time flavors, improving category turns and enabling retailers to treat soju as a portfolio rather than a single imported SKU.
  • 42 active market players (2025, North America) require stronger distributor scorecards, retail education and shared category data so that assortment expansion does not create fragmented low-velocity shelves.

On-Premise Cocktail and Food Pairing Expansion

  • 13-16% ABV flavored and mainstream labels (2025, supplier portfolios) allow operators to build sessionable cocktails with lower spirit cost per serve and differentiated Korean cues. Bars and casual dining chains capture the immediate margin opportunity.
  • 2.2 shots per week per legal-age consumer (2024/2025, Canada) across total spirits indicates a mature drinking occasion pool. Soju must win menu placement through pairings, flights and shareable formats rather than depend only on standalone shots.
  • 36% estimated on-premise share (2025, North America) can increase if restaurant staff training, cocktail recipes and menu descriptors reduce consumer uncertainty and standardize serving rituals outside Korean venues.

CHAPTER 9 - Competitive Landscape

Competitive Landscape Overview

The market is moderately concentrated, with two Korean suppliers controlling most imported mainstream volume while local craft producers compete through premium provenance, distinctive fermentation methods and selective on-premise distribution.

Market Share Distribution

HiteJinro Co., Ltd.
Lotte Chilsung Beverage Co., Ltd.
Muhak Co., Ltd.
Bohae Brewery Co., Ltd.

Top 5 Players

1
HiteJinro Co., Ltd.
!$*
2
Lotte Chilsung Beverage Co., Ltd.
^&
3
Muhak Co., Ltd.
#@
4
Bohae Brewery Co., Ltd.
$
5
Hallasan Co., Ltd.
&@$
Combined Share$%

Market Dynamics

Local Players70%
Regional/Int'l30%

8 new entrants in the past 5 years, indicating strong market attractiveness and growth potential.

Company Profiles (Top 10 Players)
Company Name
Market Share
Headquarters
Founding Year
Core Market Focus
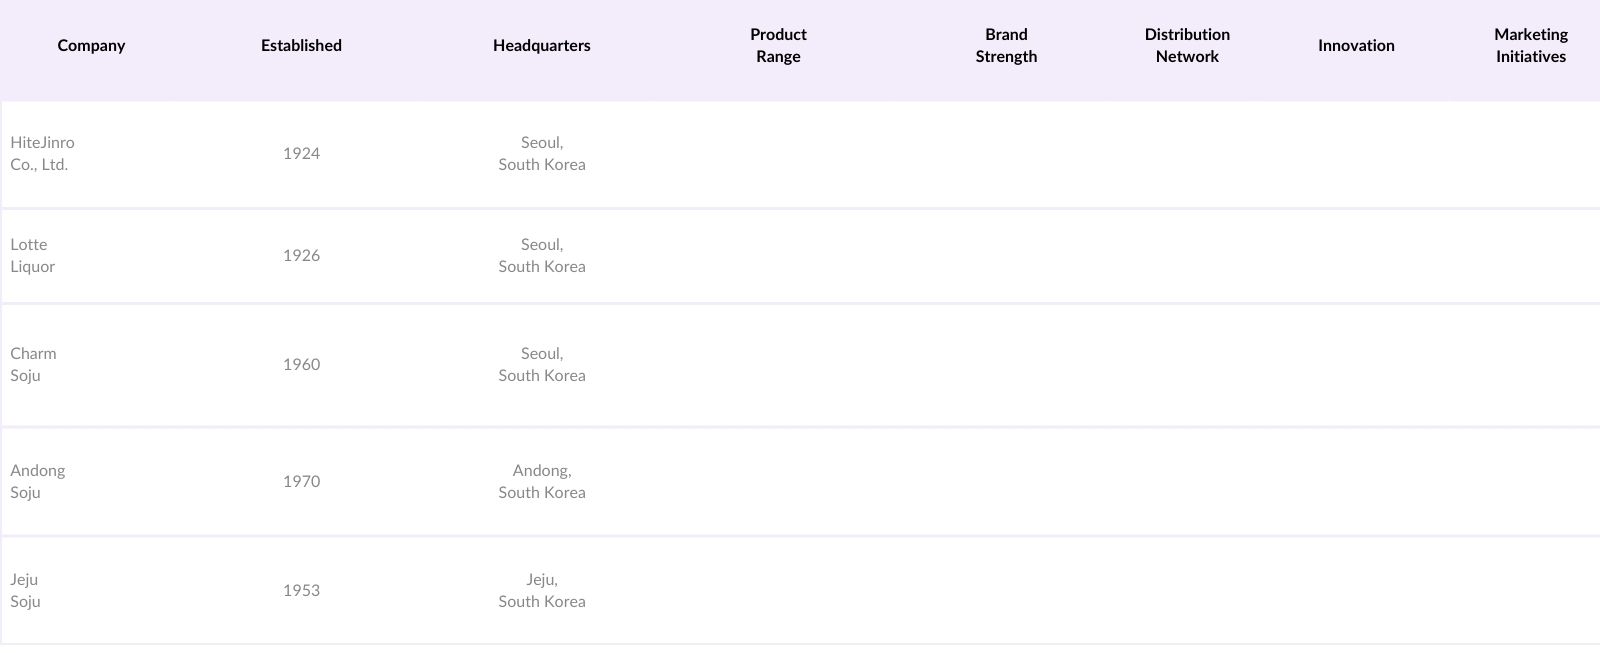
HiteJinro Co., Ltd.
48% (estimated)Seoul, South Korea1924Jinro, Chamisul and flavored soju
Lotte Chilsung Beverage Co., Ltd.
19% (estimated)Seoul, South Korea1950Chum Churum, Soonhari and Saero
Muhak Co., Ltd.
5% (estimated)Changwon, South Korea1929Good Day regional and flavored soju
Bohae Brewery Co., Ltd.
3% (estimated)Mokpo, South Korea1950Yipseju and flavored Korean spirits
Hallasan Co., Ltd.
3% (estimated)Jeju, South Korea1950Hallasan regional and premium soju
Kwangjuyo Group, Hwayo
2% (estimated)Yeoju, South Korea2003Premium rice-distilled soju
Yobo Soju
1% (estimated)New York, United States2015American craft and flavored soju
West 32 Soju
1% (estimated)New York, United States2016American craft and barrel-aged soju
Minhwa Spirits
1% (estimated)Doraville, United States2020Traditional rice and nuruk soju
Tokki Soju
1% (estimated)Chungju, South Korea2016Traditional premium rice soju

Cross Comparison Parameters

The report provides detailed cross-comparison of key players across 10 performance parameters to identify competitive strengths and weaknesses.

Analysis Covered

Market Share Analysis:

Compares supplier concentration across imported, craft and premium segments.

Cross Comparison Matrix:

Benchmarks reach, portfolio breadth, growth and margin economics.

SWOT Analysis:

Identifies brand advantages, channel gaps and execution risks.

Pricing Strategy Analysis:

Evaluates value ladders, pack architecture and channel margins.

Company Profiles:

Summarizes ownership, heritage, market focus and competitive positioning.

CHAPTER 10 - REPORT TOC

Market Report Structure

Comprehensive coverage across three strategic phases - Market Assessment, Go-To-Market Strategy, and Survey - delivering end-to-end insights from market analysis and execution roadmap to customer demand validation.

85Pages
34Chapters
10Companies Profiled
7Segmentation Types
Phase 1

Market Assessment Phase

11

Supply-side and competitive intelligence covering market sizing, segmentation, competitive dynamics, regulatory landscape, and future forecasts.

Phase 2

Go-To-Market Strategy Phase

15 chapters

Entry strategy evaluation, execution roadmap, partner recommendations, and profitability outlook.

Phase 3

Survey Phase

8 chapters

Demand-side primary research conducted through structured interviews and online surveys with end users across priority metros and Tier 2/3 cities to capture consumption behavior, unmet needs, and purchase drivers.

Complete Report Coverage

201+ detailed sections covering every aspect of the market

143

Assessment Sections

58

Strategy Sections

CHAPTER 11 - Our Approach

Research Methodology

Desk Research

  • Korean soju export flow analysis
  • North American alcohol regulation mapping
  • Retail assortment and pricing audits
  • Producer filings and portfolio review

Primary Research

  • Spirits import directors and buyers
  • Alcohol distributor category managers interviewed
  • Korean restaurant beverage directors interviewed
  • Craft distillery founders and operators

Validation and Triangulation

  • 368 respondents across value chain
  • Import value to retail reconciliation
  • Volume and price cross-checking
  • Country and channel sanity tests

CHAPTER 12 - FAQ

FAQs

Still have questions?

Our research team is here to help you find the right solution

Contact Research Team

CHAPTER 13 - Related Research

Explore Related Reports

Expand your market intelligence with complementary research across regions and adjacent markets.

Regional/Country Reports

Related market analysis across key regions

  • Indonesia Soju Market
  • Vietnam Soju Market
  • Thailand Soju Market
  • Malaysia Soju Market
  • Philippines Soju Market

500+

Market Research Reports

50+

Countries Covered

15+

Industry Verticals

Want the full report and an analyst walkthrough?

Unlock the complete dataset, segmentation cuts, and competitive analysis—plus a discovery call that maps insights to your go-to-market priorities.

;