CHAPTER 1 - MARKET SUMMARY
Market Overview
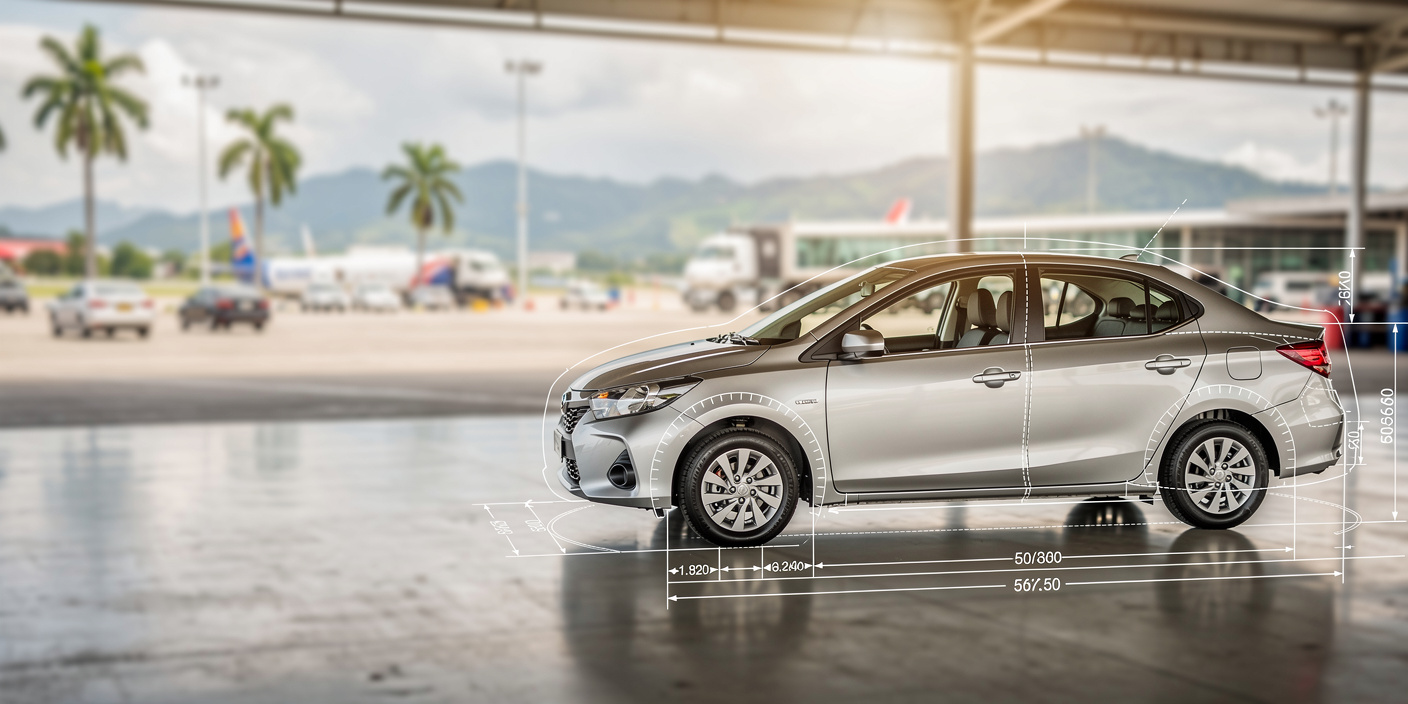
The Philippines Car Rental Market monetizes short-term self-drive, chauffeur-driven, airport-transfer, and flexible corporate fleet services. Demand is anchored by tourism and business mobility, with the country recording 6.48 million inbound arrivals in 2025. Rental operators capture value through daily tariffs, mileage packages, driver fees, vehicle-class upgrades, delivery charges, insurance waivers, and contracted corporate utilization.
Metro Manila and CALABARZON form the principal operating cluster because NAIA, Makati, Bonifacio Global City, major hotels, business-process outsourcing offices, and nearby industrial estates concentrate rental demand. NAIA handled more than 50 million passengers in 2024, supporting airport counters, advance reservations, chauffeur transfers, and intercity rentals. Cebu, Clark, and Davao provide the next-largest airport-linked demand pools.
Market Value
USD 393.1 million
2025
Dominant Region
Metro Manila and CALABARZON
2025
Dominant Segment
Self-Drive Rental
2025
Total Number of Players
1,650
2025 estimate
Future Outlook
The Philippines Car Rental Market is projected to increase from USD 393.1 million in 2025 to USD 596.6 million by 2031, representing a forecast CAGR of 7.2%. The historical CAGR of 17.4% during 2020-2025 reflects recovery from the pandemic-related 2020 trough and should not be interpreted as a steady-state rate. The 2027 market checkpoint is estimated at USD 451.7 million, supported by visitor recovery, airport capacity, corporate mobility outsourcing, and higher utilization among professionally managed fleets. Growth will increasingly depend on revenue per vehicle rather than fleet expansion alone.
Paid rental days are forecast to rise from 7.46 million in 2025 to 9.98 million in 2031, equivalent to a 5.0% volume CAGR. Average realized daily revenue is projected to increase from USD 52.7 to USD 59.8, supported by vehicle upgrades, insurance products, delivery services, and peak-period pricing. Online-originated bookings are expected to reach 78% by 2031, compared with 62% in 2025. Operators that combine digital acquisition, centralized fleet control, airport coverage, and corporate contracts should capture a disproportionate share of incremental profit.
7.2%
Forecast CAGR
$596.6 Mn
2030 Projection
Base Year
2025
Historical Period
2020-2025
Forecast Period
2026-2031
Historical CAGR
17.4%
CHAPTER 2 - SCOPE OF REPORT
Scope of the Market
CHAPTER 3 - Key Stakeholders
Key Target Audience
Key stakeholders who can leverage from this market analysis for investment, strategy, and operational planning.
Investors
market CAGR, utilization, fleet yield, residual value, consolidation
Corporates
mobility cost, SLA, uptime, safety, contract flexibility
Government
licensing, EV compliance, tourism access, safety, emissions
Operators
pricing, fleet mix, maintenance, utilization, branch productivity
Financial institutions
fleet finance, residual risk, covenants, cash coverage
CHAPTER 4 - Market Size & Growth
Market Size, Growth Forecast and Trends
This section evaluates the historical market size, analyzes year-over-year growth dynamics, and presents forecast projections supported by market performance indicators and demand-side drivers.
Historical & Projected Market Size ($ Million)
Year-over-Year Growth Rate (%)
Market Value vs Volume Growth (%)
Historical Market Performance (2020-2025)
The historical trajectory reflects a sharp pandemic disruption followed by rapid normalization. Market value reached its trough at USD 176.0 million in 2020, before the strongest annual expansion of 54.0% in 2022 as borders reopened. Growth moderated to 12.4% in 2023, 11.1% in 2024, and 7.5% in 2025. The more representative post-reopening CAGR for 2022-2025 was 10.3%. Revenue recovery outpaced paid rental-day growth as airport pricing, chauffeur services, SUVs, insurance waivers, and vehicle-delivery fees improved the realized revenue mix.
Forecast Market Outlook (2026-2031)
Forecast growth is expected to stabilize near 7.2% annually, raising market value to USD 596.6 million by 2031. Paid rental-day growth of approximately 5.0% should be supplemented by a 2.1% annual increase in realized daily revenue. Utilization is projected to reach 74.0% in 2031, compared with 68.0% in 2025, as centralized reservations and fleet rebalancing reduce idle days. Growth should gradually shift from post-pandemic recovery toward corporate outsourcing, secondary-airport expansion, digital conversion, electric and hybrid vehicle premiums, and improved ancillary-service attachment.
CHAPTER 5 - Market Data
Market Breakdown
The Philippines Car Rental Market is moving from post-pandemic volume recovery toward utilization-led and digitally enabled growth. For CEOs and investors, the key value drivers are paid rental days, realized revenue per day, and fleet utilization, which collectively determine asset productivity, cash conversion, and return on fleet capital.
Year | Market Size (USD Mn) | YoY Growth (%) | Paid Rental Days (Mn) | Average Realized Daily Rate (USD) | Fleet Utilization (%) | Period |
|---|---|---|---|---|---|---|
| 2020 | $176.0 Mn | +- | 4.39 | 40.1 | Forecast | |
| 2021 | $190.2 Mn | +8.1% | 4.58 | 41.5 | Forecast | |
| 2022 | $293.0 Mn | +54.0% | 6.65 | 44.1 | Forecast | |
| 2023 | $329.3 Mn | +12.4% | 7.11 | 46.3 | Forecast | |
| 2024 | $365.8 Mn | +11.1% | 7.31 | 50.0 | Forecast | |
| 2025 | $393.1 Mn | +7.5% | 7.46 | 52.7 | Forecast | |
| 2026F | $421.0 Mn | +7.1% | 7.80 | 54.0 | Forecast | |
| 2027F | $451.7 Mn | +7.3% | 8.18 | 55.2 | Forecast | |
| 2028F | $484.2 Mn | +7.2% | 8.60 | 56.3 | Forecast | |
| 2029F | $519.1 Mn | +7.2% | 9.03 | 57.5 | Forecast | |
| 2030F | $556.5 Mn | +7.2% | 9.49 | 58.6 | Forecast | |
| 2031F | $596.6 Mn | +7.2% | 9.98 | 59.8 | Forecast |
Paid Rental Days
7.46 million days, 2025, Philippines. Volume growth determines fleet scale and maintenance throughput. The country recorded 6.48 million inbound arrivals in 2025, strengthening airport and leisure demand.
Average Realized Daily Rate
USD 52.7, 2025, Philippines. Yield improvement depends on vehicle mix, insurance attachment, and peak pricing. Digital channels are increasingly viable because 57.4% of retail-payment volume was electronic in 2024.
Fleet Utilization
68.0%, 2025, Philippines. Higher utilization spreads depreciation, insurance, and branch costs across more paid days. NAIA handled more than 50 million passengers in 2024, providing a concentrated transaction base for airport-located and delivery-enabled fleets.
CHAPTER 6 - Segmentation
Market Segmentation Framework
Comprehensive analysis across key dimensions providing insights into market structure, consumer preferences, and distribution patterns.
No of Segments
7
Dominant Segment
Service Type
Fastest Growing Segment
Booking Channel
Service Type
Rental Duration
Vehicle Type
Customer Type
Booking Channel
Operating Model
Geography
Key Segmentation Takeaways
Comprehensive analysis across all extracted segmentation dimensions providing insights into market structure, consumer preferences, and distribution patterns.
Service Type
Service configuration is the principal revenue-allocation dimension because each format has different tariffs, utilization, driver costs, insurance exposure, and customer-acquisition economics. Self-Drive Rental generates the broadest transaction pool, while Corporate Fleet Rental provides longer contracts and steadier cash flows. Airport Transfer Rental is smaller but supports higher ancillary revenue and premium service positioning.
Booking Channel
Booking Channel is expected to record the fastest structural change as customers shift from telephone and walk-in reservations toward real-time availability, online identity verification, prepayment, and digital support. Operator Websites and Apps should gain strategic importance by lowering commission expense and preserving customer data, while aggregators remain useful for international discovery and off-peak inventory distribution.
CHAPTER 7 - Regional Analysis
Regional Analysis
The Philippines ranks fifth by estimated car-rental revenue among the selected Southeast Asian peer markets, behind Thailand, Indonesia, Vietnam, and Malaysia. Its current scale is constrained by lower international visitor arrivals, but rising airport throughput, domestic travel, digital payments, and corporate mobility create a credible medium-term expansion path.
Focus Country Ranking
5th
Focus Country Market Size
USD 393.1 Mn (2025)
Philippines CAGR (2026-2031)
7.2%
Focus Country Ranking
5th
Focus Country Market Size
USD 393.1 Mn (2025)
Philippines CAGR (2026-2031)
7.2%
Regional Analysis (Current Year)
Market Position
The Philippines ranks fifth within the peer set at USD 393.1 million, reflecting a smaller international visitor base but a sizable domestic travel economy and airport-centered urban demand.
Growth Advantage
The Philippines' 7.2% forecast CAGR trails Indonesia at 16.1% and Vietnam at 13.8%, positioning the market as a steady-growth opportunity rather than the region's highest-growth rental platform.
Competitive Strengths
More than 50 million NAIA passengers, 491,395 vehicle sales, and 57.4% digital-payment penetration support fleet renewal, online conversion, and concentrated airport economics despite lower visitor volumes.
CHAPTER 8 - INDUSTRY ANALYSIS
Growth Drivers, Market Challenges & Market Opportunities
Comprehensive analysis of key factors shaping the Philippines Car Rental Market, including growth catalysts, operational challenges, and emerging opportunities across rental operations, distribution, and customer segments.
Growth Drivers
Tourism and Airport Mobility Recovery
- Inbound arrivals included 5.94 million foreign visitors (2025, Philippines), expanding the addressable base for airport self-drive, chauffeur, and intercity rental products. Operators with airport counters and hotel-delivery capability capture the highest immediate conversion potential.
- NAIA processed more than 50 million passengers (2024, Philippines), concentrating demand within a manageable geographic cluster and improving branch-level utilization for operators serving Makati, Pasay, Parañaque, and Bonifacio Global City.
- Tourism supported 6.75 million jobs (2024, Philippines), equivalent to 13.8% of employment, reinforcing travel, hospitality, meetings, and project-related mobility that creates both retail and contracted rental demand.
Digital Booking and Payment Adoption
- Digital payments accounted for 59.0% of retail-payment value (2024, Philippines), allowing operators to collect deposits, pre-authorize charges, sell insurance waivers, and reduce cash-handling risk before vehicle release.
- Approximately 67.3% of individuals aged ten and above used the internet (2024, Philippines), increasing the addressable audience for mobile reservations, electronic agreements, digital identity checks, and automated customer communication.
- E-commerce represented 32.2% of digital-economy value added (2025, Philippines), supporting customer familiarity with real-time availability, price comparison, online checkout, and platform-mediated service procurement.
Corporate Asset-Light Mobility
- The service sector's 5.9% growth (2025, Philippines) expands employee travel, client transport, field-service, and project-mobility requirements while encouraging companies to avoid vehicle ownership and residual-value exposure.
- The digital economy generated USD-equivalent value representing 9.8% of GDP (2025, Philippines), supporting technology, outsourcing, e-commerce, and shared-service employers that require accountable, invoice-based mobility solutions.
- Long-term rental periods of 1 to 36 months (2025, operator offering) enable clients to match vehicle commitments to projects and headcount, while operators gain predictable utilization and lower customer-acquisition expense.
Market Challenges
Fragmentation and Weak Pricing Discipline
- The modeled top ten operators represent only about 33.6% of revenue (2025, Philippines estimate), limiting coordinated pricing and increasing discounting during low-demand periods. Scaled operators must differentiate through reliability, airport access, fleet quality, and contractual service levels.
- Small and micro operators contribute an estimated USD 130.5 million (2025, Philippines), but many lack integrated reservation, telematics, damage recovery, and yield-management systems, creating uneven customer experiences and higher transaction risk.
- Publicly disclosed operator-level Philippine revenue remains limited for most private companies (2025, Philippines), increasing diligence costs for investors, lenders, and acquisition candidates assessing fleet quality, utilization, and contingent liabilities.
Fleet Capital, Compliance, and Residual-Value Exposure
- A modeled active fleet of 30,100 vehicles (2025, Philippines) exposes operators to financing costs, insurance premiums, maintenance inflation, accident downtime, and used-vehicle residual values. Profitability therefore depends on disciplined procurement and disposal cycles.
- Covered fleets face a minimum 5% EV share requirement (implementation period, Philippines), but charging access, acquisition cost, vehicle downtime, and resale liquidity remain uneven across provincial locations.
- Zero tariffs on electric vehicles and selected parts were extended through 2028 (Philippines), reducing procurement friction but potentially accelerating technological obsolescence for recently acquired internal-combustion fleets.
Demand Volatility and Geographic Concentration
- The 6.48 million arrivals recorded in 2025 remained approximately 21.5% below the 2019 peak, limiting full recovery for international-airport rental counters and premium chauffeur demand.
- Metro Manila and CALABARZON account for an estimated 43% of rental revenue (2025, Philippines), increasing exposure to airport disruptions, congestion, flooding, and intense branch-level competition in the country's largest demand cluster.
- Fleet utilization is estimated at 68.0% in 2025, meaning approximately one-third of available fleet days remain non-revenue-generating because of maintenance, repositioning, seasonality, and unbooked capacity.
Market Opportunities
Secondary-Airport and Island-Gateway Networks
- Cebu, Clark, and Davao account for an estimated 41% of market revenue (2025, Philippines), supporting branch-light models based on airport delivery, hotel partnerships, and centrally managed regional fleets.
- Operators, automotive dealers, hotels, and local fleet owners benefit from shared inventory and referral economics, reducing the fixed cost of opening full branches across more than three principal secondary gateways (2025, Philippines).
- Opportunity realization requires standardized vehicle inspection, one-way rental processes, roadside assistance, and digital check-in across locations, targeting online booking penetration of 78% by 2031.
Corporate Mobility and Dealer-Backed Rental
- Multi-month contracts create predictable recurring revenue, lower booking-acquisition expense, and reduce idle days, supporting the modeled increase from 68.0% utilization in 2025 to 74.0% in 2031.
- Automotive manufacturers, dealers, leasing companies, banks, and rental operators benefit through vehicle sales, financing, maintenance, insurance, replacement mobility, and used-vehicle remarketing across a 491,395-unit new-vehicle market in 2025.
- Scaled adoption requires unified corporate billing, driver eligibility controls, guaranteed replacement vehicles, telematics, and service-level reporting for contracts lasting between 1 and 36 months.
Electric and Hybrid Rental Fleets
- Operators can monetize electric and hybrid fleets through corporate sustainability contracts, premium airport packages, lower-energy operating costs, and differentiated monthly subscriptions as covered fleets move toward the 5% statutory threshold.
- Vehicle manufacturers, charging providers, banks, fleet managers, and hotels benefit from integrated packages, while tariff relief through 2028 improves acquisition economics for selected electric models and components.
- Commercial viability requires depot charging, route-based vehicle allocation, battery-health monitoring, trained maintenance personnel, and residual-value guarantees before EVs can represent materially more than 5% of covered fleets.
CHAPTER 9 - Competitive Landscape
Competitive Landscape Overview
The market is fragmented, with international licensees, domestic fleet operators, leasing companies, dealer-backed mobility providers, and independent regional firms competing on availability, vehicle condition, airport access, contract reliability, and pricing.
Market Share Distribution
Top 5 Players
Market Dynamics
8 new entrants in the past 5 years, indicating strong market attractiveness and growth potential.
Company Name | Market Share | Headquarters | Founding Year | Core Market Focus |
|---|---|---|---|---|
Avis Philippines | - | Metro Manila, Philippines | - | Airport, city, self-drive, chauffeur, and corporate rental |
Diamond Rent-a-Car | - | Parañaque, Philippines | 1980 | Corporate fleet rental, chauffeur service, and long-term mobility |
Hertz Philippines | - | Metro Manila, Philippines | - | International-brand airport, city, and business-travel rental |
Europcar Philippines | - | Pasig, Philippines | - | Self-drive, chauffeur, airport, and multinational-account rental |
ORIX Auto Leasing Philippines | - | Makati, Philippines | - | Corporate vehicle rental, fleet management, maintenance, and leasing |
Toyota Rent a Car | - | Makati, Philippines | 2023 | Dealer-backed daily, monthly, and flexible Toyota vehicle rental |
Enterprise Rent-A-Car Philippines | - | - | - | International-network leisure, business, and replacement rental |
Budget Rent a Car Philippines | - | Metro Manila, Philippines | - | Airport, city, economy, leisure, and business rental |
Viajero Rent-A-Car | - | Makati, Philippines | 2008 | Corporate, airport, chauffeur-driven, and executive mobility |
Anis Transport | - | Mandaluyong, Philippines | 2000 | Self-drive, chauffeur, shuttle, airport, and corporate transport |
Cross Comparison Parameters
The report provides detailed cross-comparison of key players across 10 performance parameters to identify competitive strengths and weaknesses.
Fleet Utilization Rate
Average Revenue per Vehicle Day
Revenue Growth
EBITDA Margin
Analysis Covered
Market Share Analysis:
Estimates operator scale across fragmented branded and domestic rental supply.
Cross Comparison Matrix:
Benchmarks fleet productivity, pricing, growth, and operating profitability indicators.
SWOT Analysis:
Assesses network, capital, technology, brand, and execution advantages systematically.
Pricing Strategy Analysis:
Compares base tariffs, discounts, ancillaries, and contract pricing structures.
Company Profiles:
Reviews ownership, service scope, locations, customers, and strategic positioning.
CHAPTER 10 - REPORT TOC
Market Report Structure
Comprehensive coverage across three strategic phases — Market Assessment, Go-To-Market Strategy, and Survey — delivering end-to-end insights from market analysis and execution roadmap to customer demand validation.
Market Assessment Phase
Supply-side and competitive intelligence covering market sizing, segmentation, competitive dynamics, regulatory landscape, and future forecasts.
Go-To-Market Strategy Phase
15 chapters
Entry strategy evaluation, execution roadmap, partner recommendations, and profitability outlook.
Survey Phase
8 chapters
Demand-side primary research conducted through structured interviews and online surveys with end users across priority metros and Tier 2/3 cities to capture consumption behavior, unmet needs, and purchase drivers.
Complete Report Coverage
201+ detailed sections covering every aspect of the market
143
Assessment Sections
58
Strategy Sections
CHAPTER 11 - Our Approach
Research Methodology
Desk Research
- Reviewed tourism and airport statistics
- Mapped rental branches and services
- Assessed vehicle-registration and sales data
- Benchmarked tariffs and booking channels
Primary Research
- Interviewed rental-company general managers
- Consulted fleet and maintenance directors
- Engaged corporate mobility procurement heads
- Surveyed airport travel-distribution managers
Validation and Triangulation
- Triangulated findings across 317 respondents
- Reconciled fleet and revenue estimates
- Tested utilization against airport demand
- Validated rates across vehicle classes
CHAPTER 12 - FAQ
FAQs
Still have questions?
Our research team is here to help you find the right solution
CHAPTER 13 - Related Research
Explore Related Reports
Expand your market intelligence with complementary research across regions and adjacent markets.
Regional/Country ReportsRelated market analysis across key regions
Related market analysis across key regions
- Indonesia Car Rental Market Outlook
- Vietnam Car Rental Market Outlook
- Thailand Car Rental Market Outlook
- Malaysia Car Rental Market Outlook
- Philippines Car Rental Market Outlook
Adjacent ReportsRelated markets and complementary research
Related markets and complementary research
- Mexico Airport Concierge Services Market
- Bahrain Corporate Mobility Solutions Market
- Belgium Vehicle Insurance Services Market
- Belgium Digital Payment Integration Market
- South Africa Electric Vehicle Charging Infrastructure Market Size, Share & Forecast, 2025-2032
500+
Market Research Reports
50+
Countries Covered
15+
Industry Verticals