
Singapore Real Estate Market Outlook to 2028
Driven by Singapore’s status as a global financial hub, attracting significant foreign investment and the strategic development of infrastructure projects
Region:Asia
Author(s):Rajat and Deepakshi
Product Code:KR1451
October 2024
42
About the Report
Singapore Real Estate Market Overview:
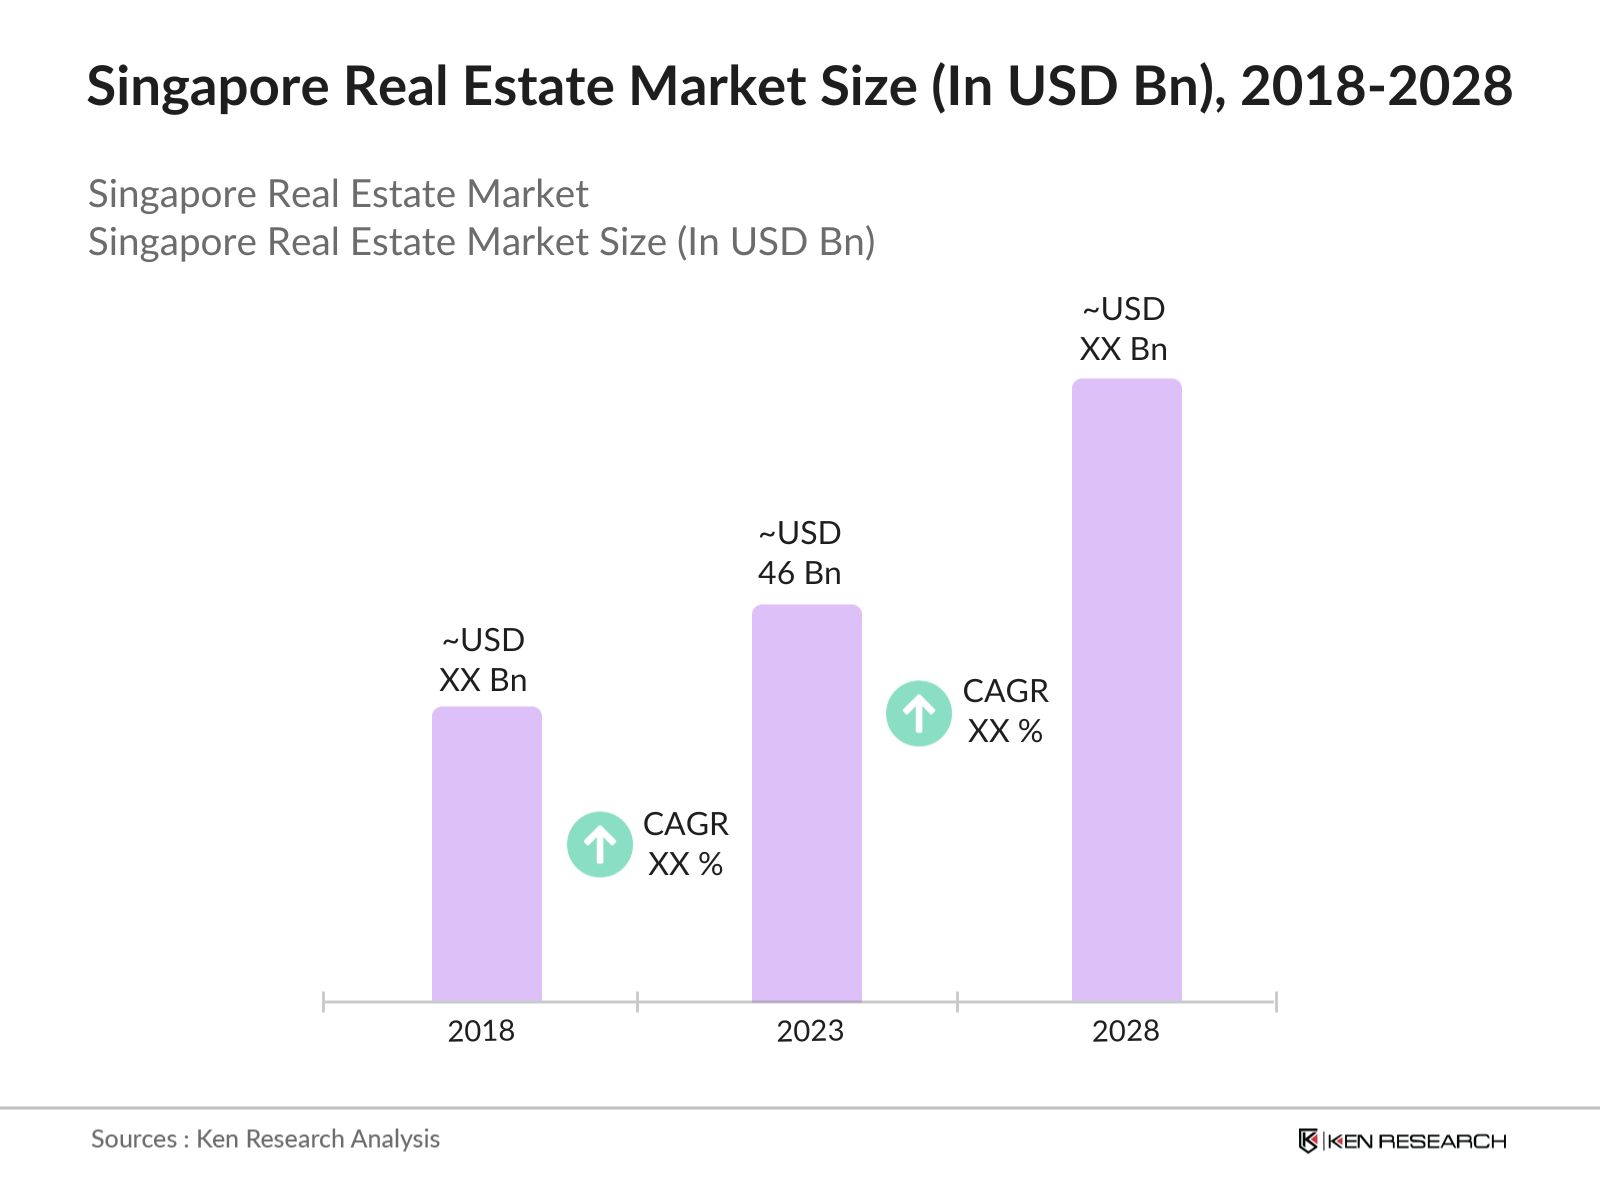
- In 2023, the Singapore Real Estate Market was valued at USD 46 billion, fueled by sustained demand across the residential, commercial, and industrial sectors. The markets growth is driven by Singapores status as a global financial hub, attracting significant foreign investment and the strategic development of infrastructure projects.
- The Singapore Real Estate Market is dominated by key players such as CapitaLand, City Developments Limited (CDL), Frasers Property, UOL Group, and Mapletree Investments. These companies have established strong market positions through their extensive portfolios across residential, commercial, and industrial properties.
- On February 7, 2024, CapitaLand Investment (CLI) announced the acquisition of three properties in Southeast Asia, including two industrial sites in Singapore through Extra Space Asia and a 20-hectare freehold site in Bangkok, Thailand. The total investment for these acquisitions is approximately SGD 700 million, which will increase CLI's funds under management in the region to SGD 1.2 billion.
- The real estate market in Singapore is predominantly dominated by the Central Region, especially areas like Marina Bay, Orchard Road, and Sentosa Cove. These locations are highly coveted due to their strategic proximity to business districts, luxury amenities, and top-tier educational institutions.
Singapore Real Estate Market Segmentation:
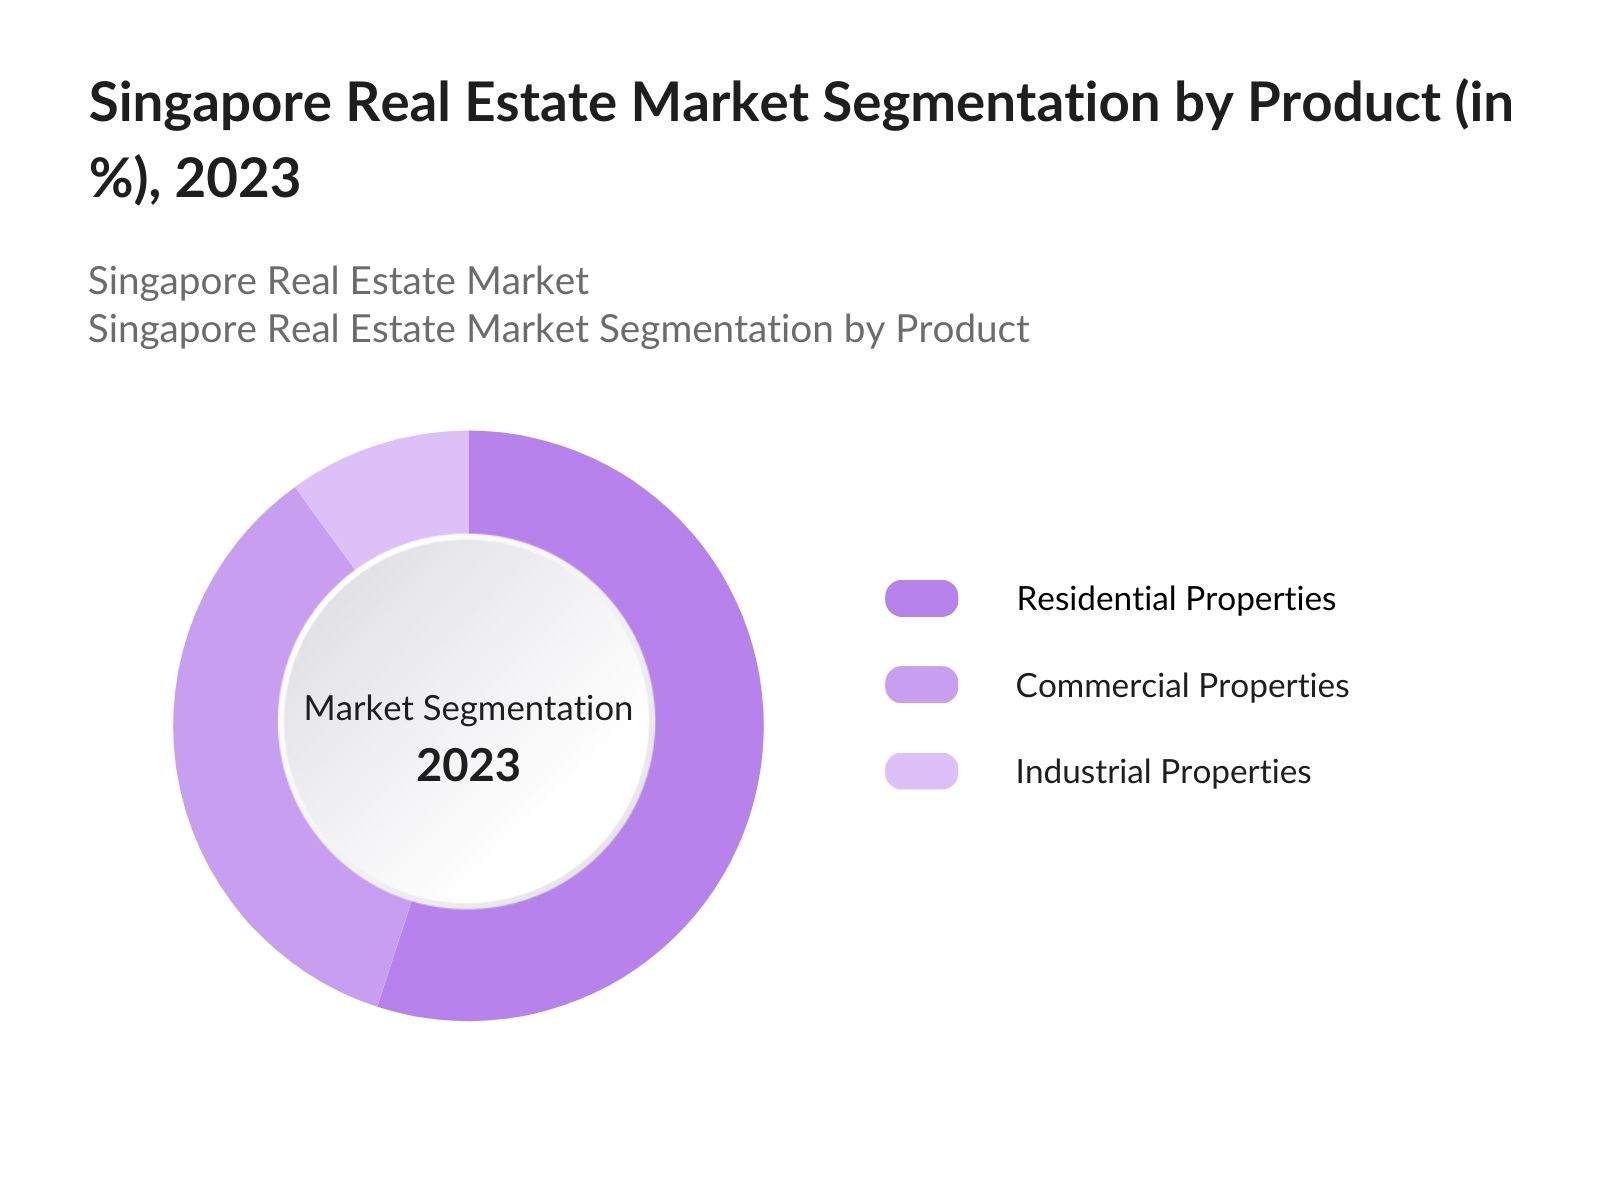
- By Property Type: The Singapore Real Estate Market is segmented by property type into residential, commercial, and industrial properties. In 2023, the residential segment held a dominant market share due to the strong demand for luxury housing. The rise in expatriate populations, coupled with the limited land availability in prime locations, has led to high demand and prices in this segment. Key areas like Orchard Road and Sentosa Cove are popular for high-end residential developments, contributing significantly to the residential sector's dominance.
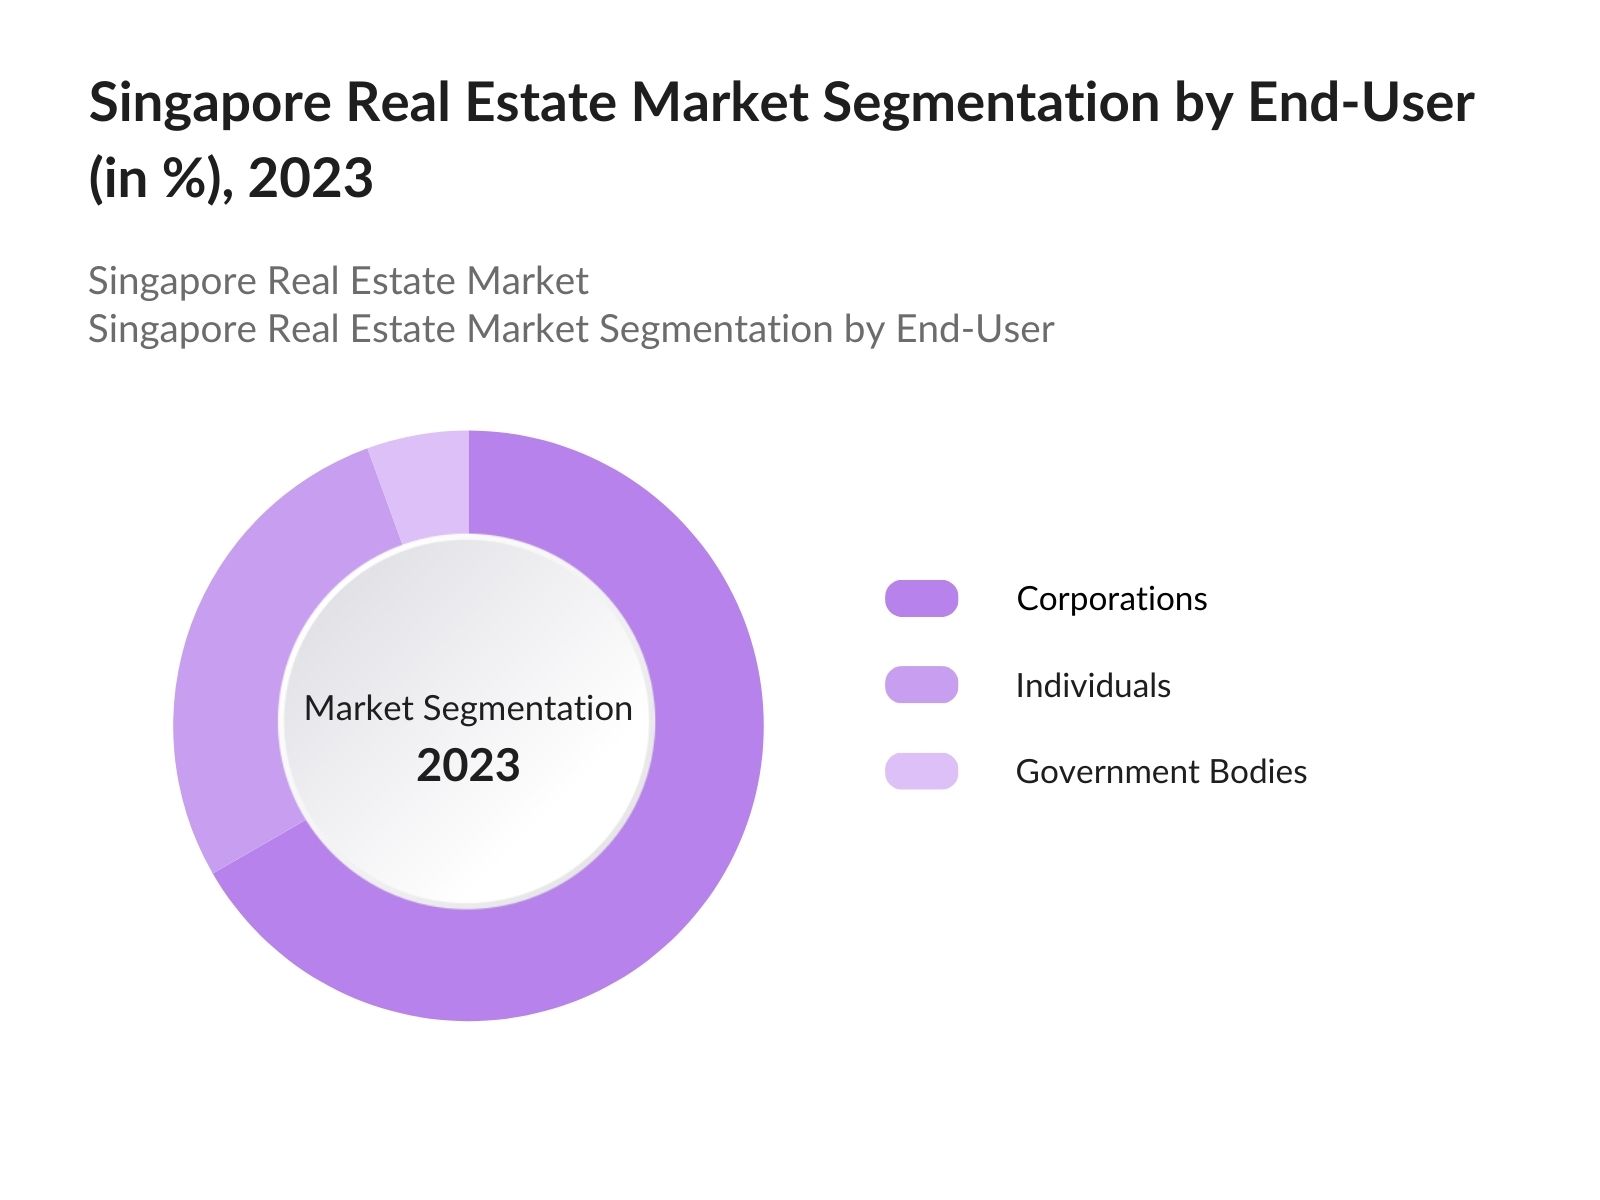
- By End-User: The Singapore Real Estate Market is segmented by end-user into individuals, corporations, and government bodies. In 2023, corporations held the largest market share, driven by the high demand for commercial office spaces in prime areas. Singapores reputation as a global business hub attracts multinational corporations, particularly in the finance and technology sectors, leading to increased demand for Grade A office spaces. The growing e-commerce and tech industries also contribute to this segment's dominance.
- By Region: The Singapore Real Estate Market is segmented by region into North, South, East, and West. In 2023, the South region, particularly the Central Business District (CBD) and Marina Bay, dominated the market share. The South regions dominance is driven by its status as the core of Singapore's business and financial activities. With a concentration of high-end commercial and residential properties, this region remains the most sought-after for real estate investments. The South regions strategic location, coupled with its advanced infrastructure, makes it the leading market in Singapore.
Singapore Real Estate Market Competitive Landscape:
|
Company Name |
Establishment Year |
Headquarters |
|
CapitaLand |
2000 |
Singapore |
|
City Developments Limited |
1963 |
Singapore |
|
Frasers Property |
1963 |
Singapore |
|
UOL Group |
1963 |
Singapore |
|
Mapletree Investments |
2000 |
Singapore |
- CapitaLand: In FY2023, Frasers Property made a strategic acquisition by purchasing a significant stake in NEX, one of Singapores largest suburban shopping malls. This acquisition played a pivotal role in enhancing Frasers Propertys financial performance for the year. The company reported a 5.1% year-on-year growth in Profit Before Interest and Tax (PBIT), driven largely by the increased income generated from its expanded retail assets.
- City Developments Limited (CDL): In 2024, CDL's subsidiary Cityview Place Holdings marketed 58 unsold units at The Residences at W Singapore Sentosa Cove, a luxury development completed in 2011. Prices were discounted by around 40% compared to the 2010 launch, starting from SGD 1,648 per square foot. The move aimed to capitalize on increased interest in Sentosa Cove properties.
Singapore Real Estate Market Analysis:
Growth Drivers:
- Sustainability Initiatives: The Singapore Real Estate Market is significantly driven by the governments focus on sustainability. The Green Mark certification and the Green Plan 2030 are pushing developers towards creating energy-efficient, sustainable buildings. In 2023, the government mandated that all new developments must meet higher Green Mark standards, driving demand for green technologies and sustainable building materials.
- Enhancing Foreign Investment: Singapores status as a global financial hub continues to attract significant foreign investment. In 2023, foreign investors accounted for approximately SGD 120 billion in real estate investments, particularly in the luxury residential and commercial segments. This influx of capital is expected to continue, driven by Singapores stable economy and transparent legal framework.
- Increasing Infrastructure Development: The governments ongoing infrastructure projects, such as the expansion of the MRT network and the development of new business districts, are key growth drivers. These projects enhance connectivity and accessibility, making new regions attractive for real estate development. The URA Master Plan 2024 outlines significant infrastructure investments that are expected to boost real estate demand in newly developed areas.
Challenges:
- Land Scarcity: One of the significant challenges in the Singapore Real Estate Market is the limited availability of land. As a small city-state, Singapore faces constraints in land supply, leading to high property prices. Developers are increasingly looking at innovative solutions such as underground and vertical developments to overcome this challenge.
- Economic Uncertainty: Global economic uncertainties, including fluctuating interest rates and geopolitical tensions, pose a risk to the Singapore Real Estate Market. While Singapore remains a safe haven for investors, these external factors can impact investment flows and market stability.
Government Initiatives:
- Green Mark Incentives: The Green Mark Incentive Scheme (GMIS) is a program initiated by the Building and Construction Authority (BCA) of Singapore to promote energy efficiency and sustainable building practices. The latest iteration, GMIS-EB 2.0, offers SGD 63 million in grants to building owners for retrofitting existing buildings to achieve higher energy performance standards, such as Super Low Energy or Zero Energy.
- Affordable Housing Projects: In response to rising property prices, the government has launched several affordable housing projects under the Housing and Development Board (HDB). In 2023, HDB completed about 21,400 flats across 23 housing projects, which is the highest number of projects and flats completed annually in the last few years.
Singapore Real Estate Market Future Outlook:
The Singapore real estate market is poised for substantial growth, driven by sustainability initiatives, foreign investment, and infrastructure development.
Future Trends:
- Rise in Sustainable Developments: By 2028, sustainable developments are expected to dominate the market as developers increasingly adopt green building practices. The governments focus on the Green Plan 2030 will push for higher standards in sustainability, making green buildings a norm in Singapores real estate market. Developers who fail to adopt these practices may find it challenging to remain competitive.
- Expansion of Business Districts: The expansion of existing business districts and the development of new ones, such as the Jurong Lake District, are expected to drive demand for commercial real estate. These districts are being developed with a focus on connectivity and sustainability, making them attractive to multinational corporations and investors.
Scope of the Report
|
By Property |
Residential Commercial Industrial |
|
By End-User |
Corporations Individuals Government |
|
By Region |
North South East West |
Products
Key Target Audience:
Real Estate Developers
Property Management Firms
Real Estate Investment Trusts (REITs)
Construction Companies
Multinational Corporations
Banks and Financial Institutions
Investors and VC Firms
Government Agencies and Regulatory Bodies (Urban Redevelopment Authority)
Time Period Captured in the Report:
Historical Period: 2018-2023
Base Year: 2023
Forecast Period: 2023-2028
Companies
Major Players Mentioned in the Report:
CapitaLand
City Developments Limited (CDL)
Frasers Property
UOL Group
Mapletree Investments
Keppel Land
GuocoLand
Far East Organization
Bukit Sembawang Estates Limited
Oxley Holdings
Wing Tai Holdings
Hong Leong Holdings
Ho Bee Land
Roxy-Pacific Holdings
Sim Lian Group
Table of Contents
1. General Overview
1.1 GDP Overview of Singapore
1.2 Industry Specific Overview (Financial Services, Manufacturing and R&D, Trade & Export, and Tourism & Hospitality)
1.3 Government Plans and Policies supporting Growth
1.4 Effect on Real Estate Industry
2. Demographic Analysis
2.1 Demographics Overview
2.2 Household Sizing and Ageing
2.3 Birthrate and Immigration Overview
2.4 Labor Force and Employment Overview
2.5 Labor Market Laws and Ease of Doing Business
2.6 New Townships in Singapore
3. Key Government Policies
3.1 Central Business District Incentive by Singapore
3.2 Ban on Strata Sale
3.3 ESG, Electric Vehicles, and Net-Zero target of Singapore
3.4 New District Developments in Singapore
4. Infrastructure Development Roadmap
4.1 Port Terminals in Singapore
4.2 Airports in Singapore
4.3 Energy infrastructure and carbon taxation framework in Singapore
4.4 Transport in Singapore (Rails, Expressways, COE)
4.5 Digital infrastructure
5. Industrial Landscape
5.1 Key Industries Overview
5.2 Specific Business Zones
6. Analyst Recommendations
Disclaimer
Contact Us
Research Methodology
Step 1: Comprehensive Market Understanding:
The research methodology adopted for the Singapore Real Estate Market analysis ensures a robust and comprehensive understanding of the market by integrating top-down and bottom-up approaches, providing a holistic view of the market's current size and future potential.
Step 2: Data Accuracy and Validation:
Through a combination of primary and secondary research, including in-depth industry interviews and consolidated data analysis, the report achieves high data accuracy and validation, ensuring that the findings are reliable and reflective of actual market conditions.
Step 3: Expert Insights and Market Dynamics:
The incorporation of expert insights through interviews with key industry stakeholders enhances the reports depth, providing valuable perspectives on market dynamics, growth drivers, challenges, and future trends, which are critical for strategic decision-making.
Step 4: Acknowledgment of Limitations and Future Outlook:
The methodology acknowledges potential limitations and emphasizes the importance of continuous monitoring of market conditions, offering a future outlook that guides stakeholders in navigating the evolving real estate landscape in Singapore.
Frequently Asked Questions
01. How big is the Singapore Real Estate Market?
The Singapore Real Estate Market was valued at USD 46 billion in 2023, driven by strong demand across the residential, commercial, and industrial sectors, supported by Singapores strategic location and its status as a global financial hub.
02. What are the challenges in the Singapore Real Estate Market?
Challenges in the Singapore Real Estate Market include limited land availability, high property prices, and economic uncertainties that may impact investment flows. Additionally, the market faces regulatory pressures related to sustainability and building standards.
03. Who are the major players in the Singapore Real Estate Market?
Key players in the Singapore Real Estate Market include CapitaLand, City Developments Limited (CDL), Frasers Property, UOL Group, and Mapletree Investments. These companies lead the market with extensive portfolios in residential, commercial, and industrial properties.
04. What are the growth drivers of the Singapore Real Estate Market?
The market is propelled by Singapores strategic infrastructure development, the governments sustainability initiatives like the Green Plan 2030, and continued foreign investment attracted by the countrys stable economy and robust legal framework.
Why Buy From Us?

What makes us stand out is that our consultants follows Robust, Refine and Result (RRR) methodology. i.e. Robust for clear definitions, approaches and sanity checking, Refine for differentiating respondents facts and opinions and Result for presenting data with story

We have set a benchmark in the industry by offering our clients with syndicated and customized market research reports featuring coverage of entire market as well as meticulous research and analyst insights.

While we don't replace traditional research, we flip the method upside down. Our dual approach of Top Bottom & Bottom Top ensures quality deliverable by not just verifying company fundamentals but also looking at the sector and macroeconomic factors.

With one step in the future, our research team constantly tries to show you the bigger picture. We help with some of the tough questions you may encounter along the way: How is the industry positioned? Best marketing channel? KPI's of competitors? By aligning every element, we help maximize success.

Our report gives you instant access to the answers and sources that other companies might choose to hide. We elaborate each steps of research methodology we have used and showcase you the sample size to earn your trust.

If you need any support, we are here! We pride ourselves on universe strength, data quality, and quick, friendly, and professional service.