About the Report
Base Year 2025UAE Logistics Market Overview
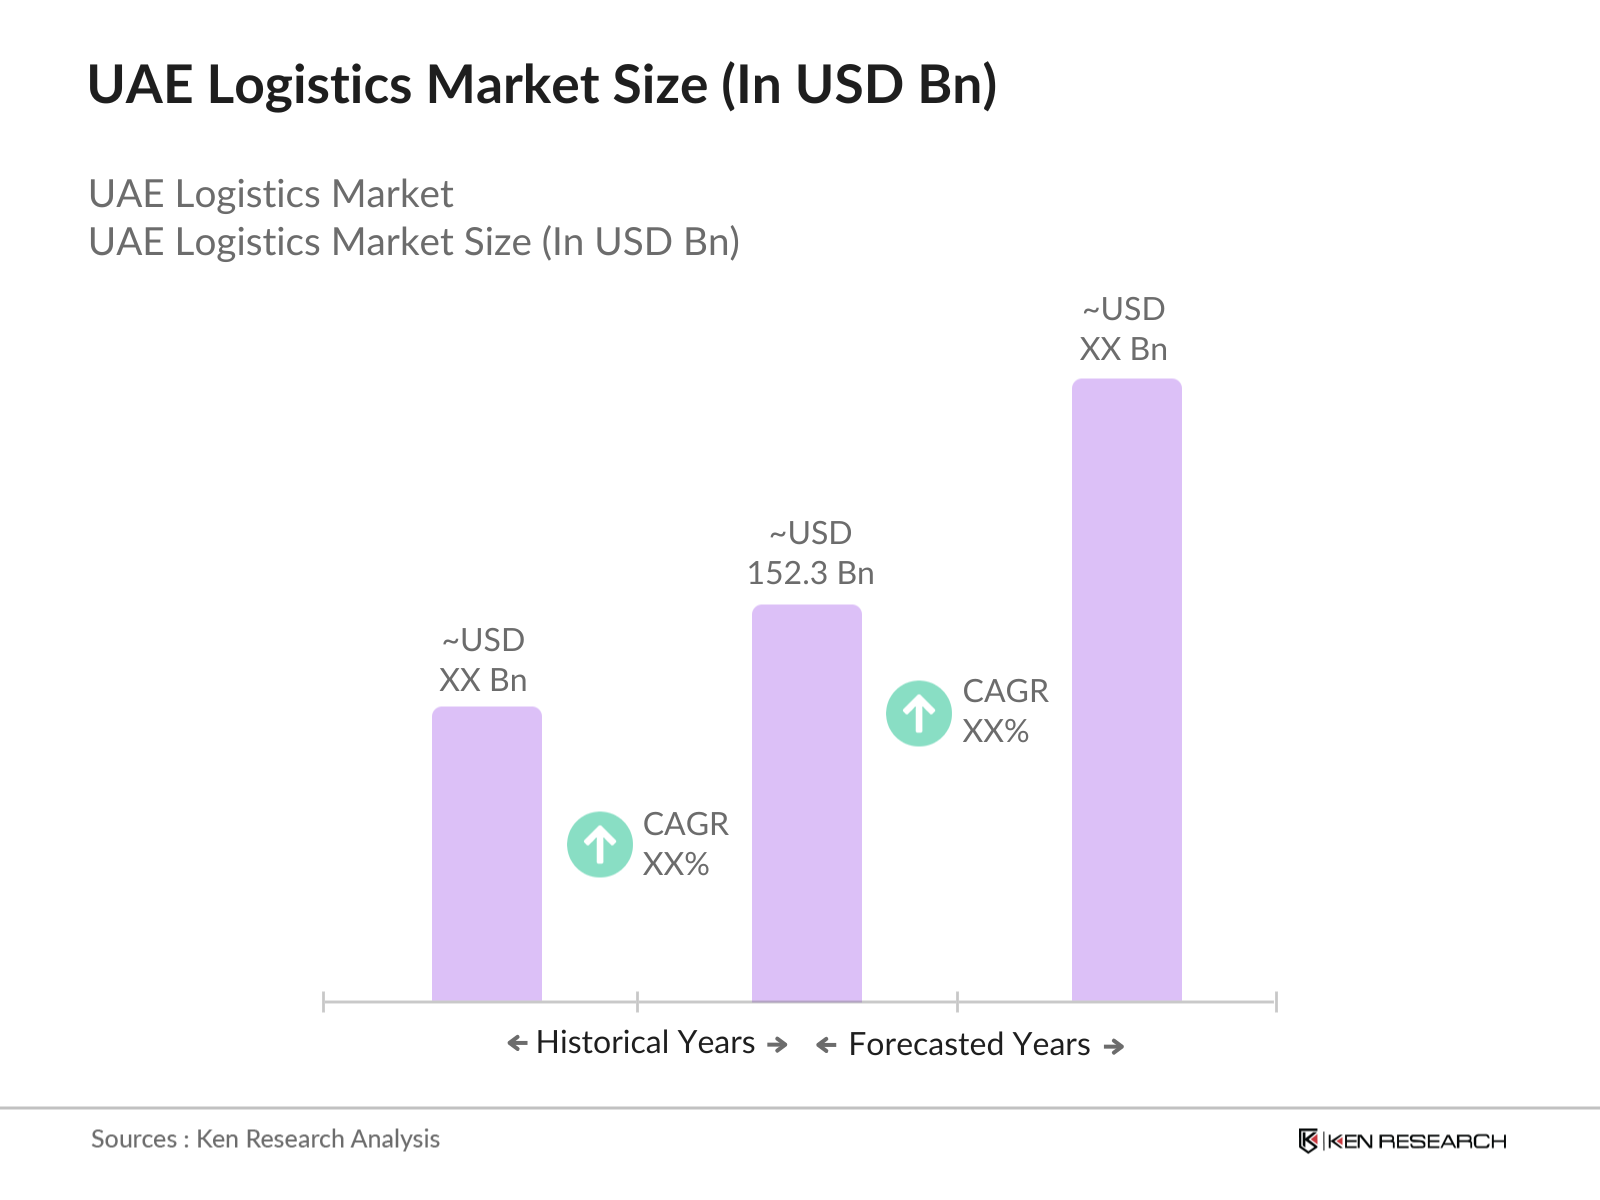
- The UAE Logistics Market is valued at approximately USD 152.3 billion, equivalent to AED 136.7 billion, based on a five-year historical analysis. Market activity is supported by ports, freight forwarding, warehousing, express delivery, customs clearance, road distribution and integrated contract logistics. Jebel Ali Port handles 15.5 million TEUs and 5.4 million tonnes of breakbulk cargo, demonstrating the scale of trade flows supporting logistics, re-export and regional distribution operations.
- Dubai and Abu Dhabi dominate logistics activity because they combine ports, airports, free zones, warehouses and extensive road connectivity. Dubai benefits from Jebel Ali Port and Dubai International Airport, which handles approximately 2.2 million tonnes of cargo, together with JAFZA and Dubai South. Abu Dhabi is supported by Khalifa Port, KEZAD, Zayed International Airport and industrial clusters, while Sharjah provides complementary warehousing, air cargo and Northern Emirates distribution connectivity.
- Federal Law No. 9 of 2011 on Land Transport establishes the legal framework for paid transport of passengers and goods within the UAE, between emirates and across international borders. Operators engaged in regulated land transportation require appropriate licensing and vehicle operating permits, while vehicles must meet applicable technical and safety requirements. Customs-related logistics is additionally governed by the GCC Common Customs Law and emirate-level customs procedures covering warehousing, transit, clearance and bonded goods.
UAE Logistics Market Segmentation
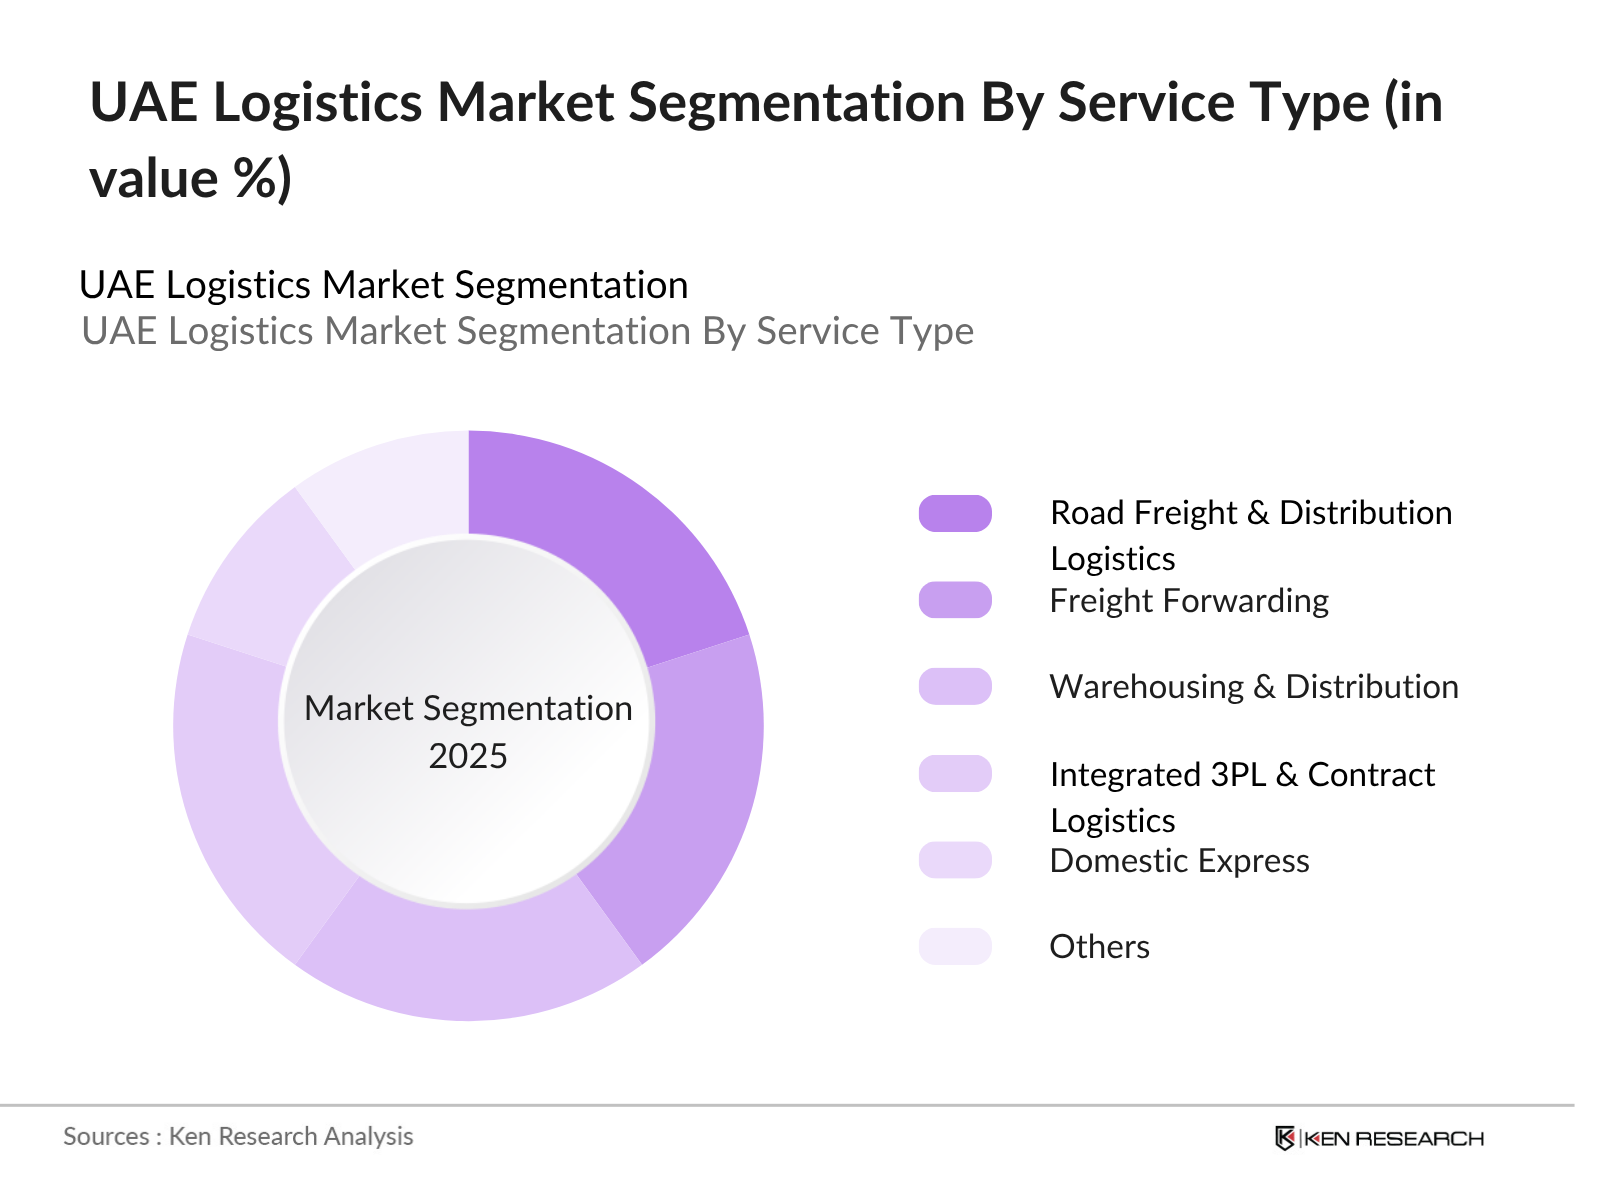
By Service Type:Road freight and distribution logistics form the leading service segment because the UAE’s ports, airports, free zones, industrial areas, retail networks and regional trade corridors require intensive inland movement. Freight forwarding is another major segment due to the country’s position as a maritime and aviation gateway linking Asia, Europe, Africa and the GCC. Warehousing and distribution benefit from strong demand for industrial and logistics space, while integrated 3PL providers increasingly combine transport, inventory management and value-added services. Domestic express demand is supported by online retail and urban delivery density, whereas international express serves high-value and time-sensitive shipments. Customs clearance remains essential for import, transit and re-export flows. Other specialized activities include project logistics, reverse logistics and niche vertical solutions. The following shares represent an indicative modeled distribution of total logistics activity.
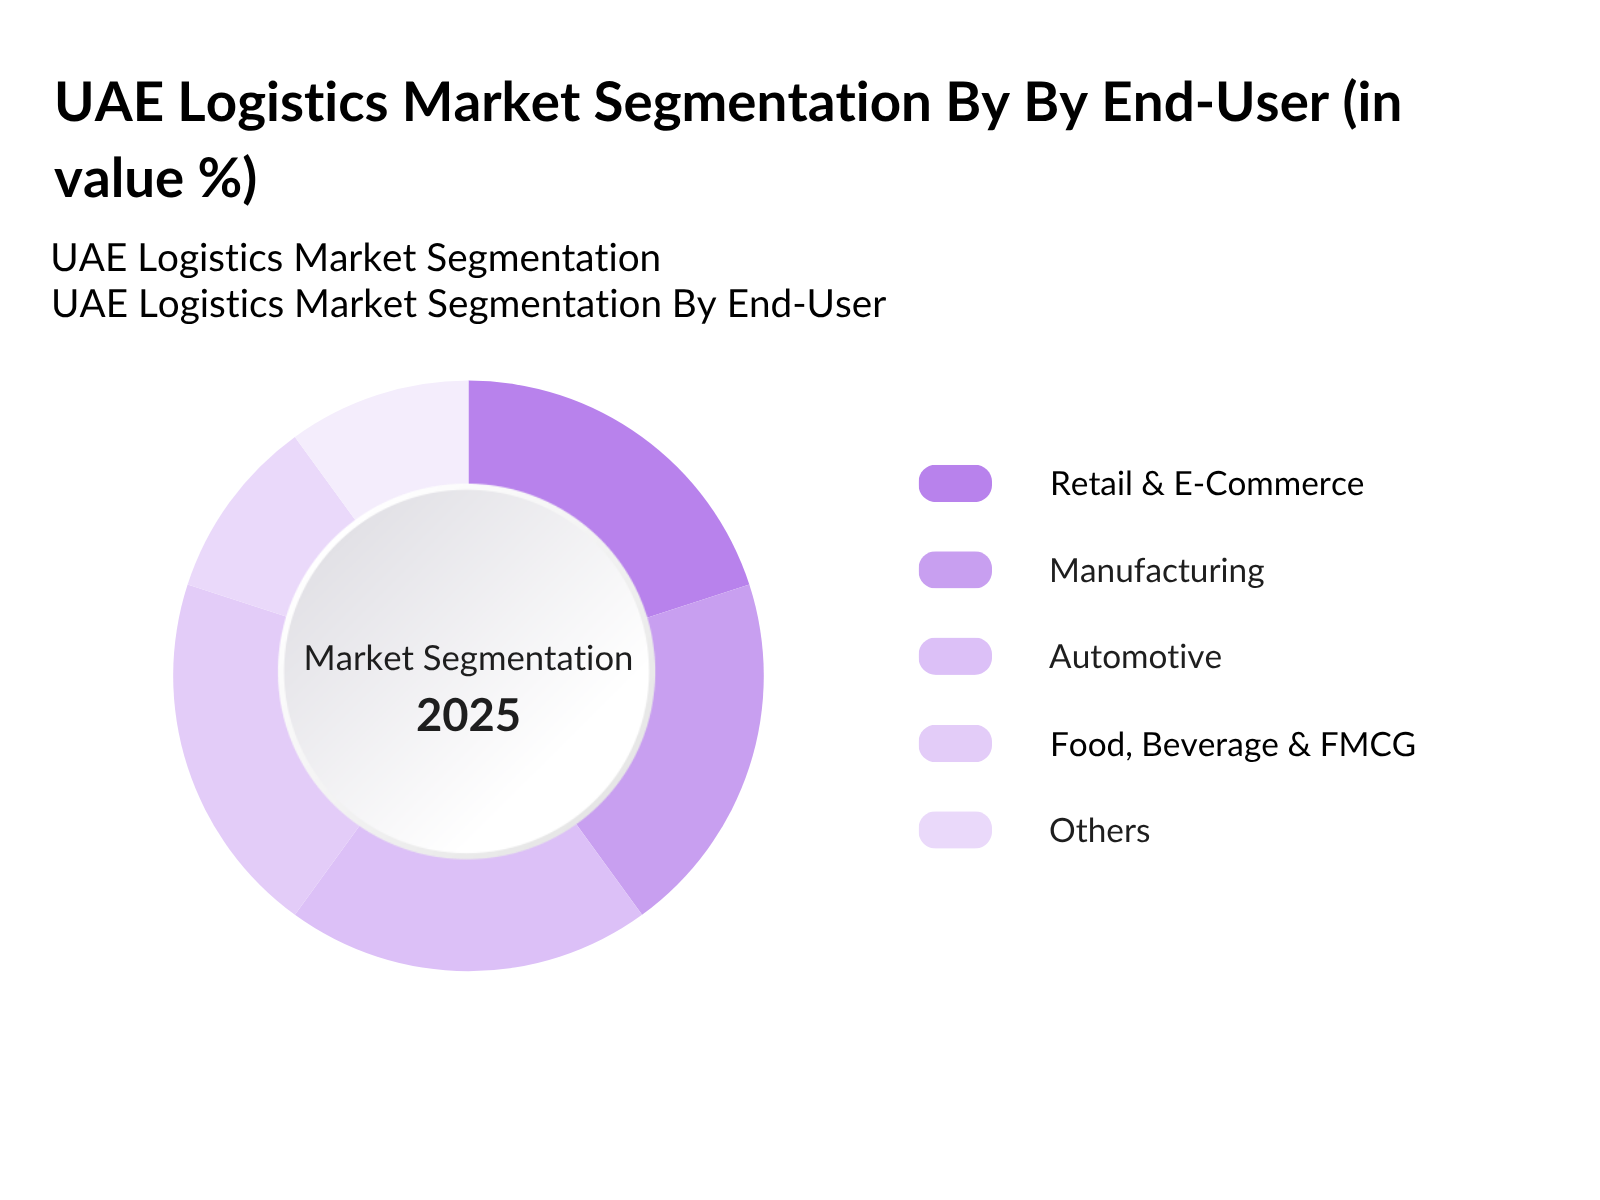
By End-User:Retail and e-commerce represent the leading end-user segment because online sales, omnichannel retail and dense urban consumption generate demand for fulfillment, parcel delivery, returns processing and inventory distribution. Manufacturing follows through inbound raw materials, industrial warehousing and finished-goods transportation. Automotive logistics is significant because the UAE operates as a major vehicle and spare-parts import and re-export hub. Food, beverage and FMCG customers require high-frequency distribution and temperature-controlled services, while oil, gas and chemicals depend on industrial and project logistics. Healthcare and pharmaceuticals require compliance-sensitive storage and delivery, and construction creates project cargo and material-movement demand. Aerospace, electronics and other high-value sectors support specialized freight services. Other demand comes from hospitality, government and professional-service supply chains.
UAE Logistics Market Competitive Landscape
The UAE Logistics Market is characterized by a diverse mix of port operators, express companies, international freight forwarders, contract logistics providers, warehouse operators and technology-enabled logistics businesses. Leading participants such as DP World Limited, Aramex PJSC, DHL, Kuehne+Nagel and DSV compete through multimodal connectivity, shipment volumes, warehouse capacity, global trade lanes, customs expertise, technology integration and value-added logistics services.
UAE Logistics Market Industry Analysis
Growth Drivers
- International Trade and Re-Export Infrastructure:The UAE logistics sector contributes approximately AED 136.7 billion to the national economy, supported by dense trade flows and multimodal infrastructure. Jebel Ali Port handled 15.5 million TEUs and 5.4 million tonnes of breakbulk cargo, demonstrating the scale available to freight forwarders, customs brokers, hauliers and warehouse operators. High container throughput creates recurring demand for port drayage, consolidation, bonded storage, inventory handling and regional re-export services linking Dubai with Gulf, Asian, African and European trade corridors.
- E-Commerce and Express Fulfillment Expansion:Digital retail is accelerating parcel, fulfillment and last-mile activity across the UAE. E-commerce sales reached AED 32.3 billion, creating substantial demand for automated warehouses, parcel sortation, delivery fleets and returns management. Growth is reinforced by high-density consumer markets in Dubai, Abu Dhabi and Sharjah, where retailers increasingly require same-day and next-day service. This demand supports domestic express operators, fulfillment specialists and technology-enabled 3PL providers that can integrate inventory visibility, order management and route optimization across multiple sales channels.
- Air Cargo and Advanced Logistics Infrastructure:Air cargo and advanced logistics infrastructure strengthen the UAE's role in time-sensitive and high-value supply chains. Dubai International Airport handled 2.2 million tonnes of cargo, while dnata processed more than 1 million tonnes across its Dubai cargo operations over a twelve-month period. New facilities, including a 57,000 square metre dnata logistics warehouse with capacity for 400,000 tonnes annually, expand handling capability for pharmaceuticals, perishables, electronics, automotive parts and other categories requiring rapid, secure and specialized logistics services.
Market Challenges
- Limited Grade-A Warehousing Supply:Warehouse supply constraints are increasing operating pressure in key logistics clusters. Dubai recorded 40.6 million square feet of new industrial and logistics space requirements, while vacancy in established areas remained around 3%. Strong demand pushes occupiers toward pre-leasing, secondary locations and higher-cost facilities, complicating network planning for 3PLs and distributors. Logistics companies must balance proximity to ports, airports and customers against rent, labor access and facility specifications, particularly for temperature-controlled, automated and high-throughput operations requiring specialized buildings.
- Customs and Cross-Border Compliance Complexity:Cross-border logistics requires strict coordination across customs, free-zone, warehouse and transport procedures. The UAE's Common Customs Law permits customs warehouses where goods can remain under supervision without immediate duty payment, while Dubai Customs requires financial guarantees of AED 50,000 for private customs warehouses and AED 1.5 million for public facilities. Documentation, customs declarations, origin evidence and transit controls can increase administrative complexity, making compliance capability and system integration essential for freight forwarders, customs brokers and regional distribution operators.
UAE Logistics Market Future Outlook
The UAE Logistics Market is moving toward a more integrated model combining ports, airports, rail, road freight, bonded warehousing and technology-enabled fulfillment. Competitive advantage will increasingly depend on multimodal connectivity, automation, customs expertise, real-time visibility and sector-specific solutions rather than standalone transport capacity. Dubai will remain the principal international gateway, while Abu Dhabi should gain from Khalifa Port, industrial zones and new logistics developments. Etihad Rail can strengthen domestic and regional cargo connectivity, and rising e-commerce activity will support fulfillment and last-mile services. Warehousing scarcity will also encourage larger, automated facilities and expansion into emerging logistics corridors.
Market Opportunities
- Bonded Warehousing and Regional Distribution:Bonded and regional distribution models offer a major opportunity because the UAE's logistics sector already contributes AED 136.7 billion to the economy. Operators can combine customs warehousing, freight forwarding, re-export management and value-added services to serve Gulf, African and Asian markets. Integrated facilities near Jebel Ali, Khalifa Port and airport free zones can improve inventory flexibility and shorten regional replenishment cycles.
- Automated E-Commerce Fulfillment:E-commerce fulfillment and advanced warehousing provide another attractive opportunity. UAE online retail sales reached AED 32.3 billion, while Dubai recorded 40.6 million square feet of industrial and logistics space requirements. Providers that invest in automated storage, sortation, temperature-controlled capacity and integrated delivery management can capture demand from retailers, marketplaces, healthcare companies and consumer brands seeking faster fulfillment and reliable inventory visibility.
Scope of the Report
| Segment | Sub-Segments |
|---|---|
| By Service Type | Road Freight & Distribution Logistics Freight Forwarding Warehousing & Distribution Integrated 3PL & Contract Logistics Domestic Express International Express Customs Clearance & Brokerage Others |
| By Express Delivery Model | B2B Express B2C Express C2C Express Captive Express |
| By Delivery Period | Same-Day Delivery Next-Day Delivery Two-to-Three-Day Delivery Standard & Deferred Delivery |
| By Shipment Weight | Documents & Small Parcels Below 2 Kg 2-5 Kg 5-20 Kg Above 20 Kg |
| By Mode of Transport | Road Freight Sea Freight Air Freight Rail Freight Multimodal Freight |
| By Warehouse Type | General & Dry Warehousing Temperature-Controlled & Cold Chain Warehousing Bonded & Customs Warehousing E-Commerce & Fulfillment Centers Industrial & Specialized Warehousing Automated Grade-A Warehousing Others |
| By End-User | Retail & E-Commerce Manufacturing Automotive Food, Beverage & FMCG Oil, Gas & Chemicals Healthcare & Pharmaceuticals Construction & Infrastructure Aerospace, Electronics & High-Value Goods Others |
| By Emirate | Dubai Abu Dhabi Sharjah Ras Al Khaimah Ajman Fujairah Umm Al Quwain |
Key Target Audience
Domestic and International Logistics Service Providers
Freight Forwarders and Customs Clearance Operators
Warehousing, Fulfillment and Contract Logistics Companies
Retail, E-Commerce and FMCG Supply Chain Operators
Manufacturing, Automotive and Industrial Companies
Investors and Venture Capitalist Firms
Government and Regulatory Bodies including Ministry of Energy and Infrastructure, Federal Authority for Identity, Citizenship, Customs & Port Security and Local Customs Authorities
Banks, Infrastructure Funds and Logistics Real Estate Investors
Major Players Mentioned
DP World Limited
Aramex PJSC
7X - Emirates Post Group
DHL Express UAE
FedEx Express UAE
UPS UAE
Kuehne+Nagel UAE
DSV UAE
CEVA Logistics UAE
Maersk Logistics UAE
Table of Contents
Market Assessment Phase
1. Executive Summary and Approach
2. UAE Logistics Market Overview
2.1 Key Insights and Strategic Recommendations
2.2 UAE Logistics Market Overview
2.3 Definition and Scope
2.4 Evolution of Market Ecosystem
2.5 Timeline of Key Regulatory Milestones
2.6 Value Chain & Stakeholder Mapping
2.7 Business Cycle Analysis
2.8 Policy & Incentive Landscape
3. UAE Logistics Market Analysis
3.1 Growth Drivers
3.1.1 Expansion of International Trade, Ports and Re-Export Activity
3.1.2 Rapid Growth of E-Commerce, Express Delivery and Fulfillment
3.1.3 Expansion of Grade-A Warehousing and Free-Zone Logistics Infrastructure
3.1.4 Multimodal Integration Across Ports, Airports, Roads and Rail
3.2 Market Challenges
3.2.1 Shortage and Rising Cost of Grade-A Warehousing Space
3.2.2 High Operating and Last-Mile Fulfillment Costs
3.2.3 Complex Cross-Emirate and Cross-Border Compliance Requirements
3.2.4 Talent Requirements for Automated and Technology-Enabled Logistics
3.3 Market Opportunities
3.3.1 Bonded Warehousing and Regional Re-Export Distribution
3.3.2 Automated E-Commerce and Omnichannel Fulfillment Centers
3.3.3 Cold Chain and Pharmaceutical Logistics
3.3.4 Rail-Integrated and Multimodal Freight Solutions
3.4 Market Trends
3.4.1 Increasing Adoption of Warehouse Automation and Robotics
3.4.2 Expansion of Smart Customs and Paperless Trade Processes
3.4.3 Shift Toward Asset-Light and Integrated 3PL Models
3.4.4 Growing Demand for Green and Low-Emission Logistics
3.5 Government Regulation
3.5.1 Federal Law No. 9 of 2011 on Land Transport
3.5.2 GCC Common Customs Law and UAE Customs Procedures
3.5.3 Customs Warehouse and Bonded Storage Licensing Requirements
3.5.4 Free-Zone, Transit and Customs Broker Compliance Requirements
4. SWOT Analysis
5. Stakeholder Analysis
6. Porter's Five Forces Analysis
7. UAE Logistics Market Size, 2019-2024
7.1 By Value
7.2 By Shipment & Freight Volume
7.3 By Average Revenue per Shipment / Logistics Transaction
8. UAE Logistics Market Segmentation
8.1 By Service Type
8.1.1 Road Freight & Distribution Logistics
8.1.2 Freight Forwarding
8.1.3 Warehousing & Distribution
8.1.4 Integrated 3PL & Contract Logistics
8.1.5 Domestic Express
8.1.6 International Express
8.1.7 Customs Clearance & Brokerage
8.1.8 Others
8.2 By Express Delivery Model
8.2.1 B2B Express
8.2.2 B2C Express
8.2.3 C2C Express
8.2.4 Captive Express
8.3 By Delivery Period
8.3.1 Same-Day Delivery
8.3.2 Next-Day Delivery
8.3.3 Two-to-Three-Day Delivery
8.3.4 Standard & Deferred Delivery
8.4 By Shipment Weight
8.4.1 Documents & Small Parcels
8.4.2 Below 2 Kg
8.4.3 2-5 Kg
8.4.4 5-20 Kg
8.4.5 Above 20 Kg
8.5 By Mode of Transport
8.5.1 Road Freight
8.5.2 Sea Freight
8.5.3 Air Freight
8.5.4 Rail Freight
8.5.5 Multimodal Freight
8.6 By Warehouse Type
8.6.1 General & Dry Warehousing
8.6.2 Temperature-Controlled & Cold Chain Warehousing
8.6.3 Bonded & Customs Warehousing
8.6.4 E-Commerce & Fulfillment Centers
8.6.5 Industrial & Specialized Warehousing
8.6.6 Automated Grade-A Warehousing
8.6.7 Others
8.7 By End-User
8.7.1 Retail & E-Commerce
8.7.2 Manufacturing
8.7.3 Automotive
8.7.4 Food, Beverage & FMCG
8.7.5 Oil, Gas & Chemicals
8.7.6 Healthcare & Pharmaceuticals
8.7.7 Construction & Infrastructure
8.7.8 Aerospace, Electronics & High-Value Goods
8.7.9 Others
8.8 By Emirate
8.8.1 Dubai
8.8.2 Abu Dhabi
8.8.3 Sharjah
8.8.4 Ras Al Khaimah
8.8.5 Ajman
8.8.6 Fujairah
8.8.7 Umm Al Quwain
9. UAE Logistics Market Competitive Analysis
9.1 Market Share of Key Players (Micro, Small, Medium, Large Enterprises)
9.2 Cross Comparison of Key Players
9.2.1 Company Name
9.2.2 Group Size (Large, Medium, or Small as per industry convention)
9.2.3 Annual Shipment & Freight Handling Volume
9.2.4 Warehousing & Fulfillment Capacity
9.2.5 UAE Distribution Network Coverage
9.2.6 International Trade Lane Connectivity
9.2.7 Port, Airport & Free-Zone Integration
9.2.8 Automation & Digital Tracking Capability
9.2.9 Contract Logistics & Value-Added Service Portfolio
9.2.10 Pricing Strategy
9.3 SWOT Analysis of Top Players
9.4 Pricing Analysis by Logistics Service, Shipment Type and Delivery Model
9.5 Detailed Profile of Major Companies
9.5.1 DP World Limited
9.5.2 Aramex PJSC
9.5.3 7X - Emirates Post Group
9.5.4 DHL Express UAE
9.5.5 FedEx Express UAE
9.5.6 UPS UAE
9.5.7 Kuehne+Nagel UAE
9.5.8 DSV UAE
9.5.9 CEVA Logistics UAE
9.5.10 Maersk Logistics UAE
9.5.11 AD Ports Group
9.5.12 Noatum Logistics
9.5.13 dnata Logistics
9.5.14 Emirates Logistics LLC
9.5.15 RSA Global
10. UAE Logistics Market End-User Analysis
10.1 Procurement Behavior of Key Government and Free-Zone Entities
10.1.1 Port and Customs-Linked Logistics Procurement
10.1.2 Government Infrastructure Freight Contracts
10.1.3 Free-Zone Warehousing and Distribution Requirements
10.1.4 Technology, Sustainability and Service-Level Requirements
10.2 Corporate Spend on Logistics & Supply Chain Infrastructure
10.2.1 Retail & E-Commerce Fulfillment Spend
10.2.2 Manufacturing and Industrial Logistics Spend
10.2.3 Automotive and Spare Parts Logistics Spend
10.2.4 Healthcare and Cold Chain Logistics Spend
10.3 Pain Point Analysis by End-User Category
10.3.1 Grade-A Warehouse Availability
10.3.2 Last-Mile Cost and Delivery Density
10.3.3 Cross-Border Customs Documentation
10.3.4 Inventory Visibility and System Integration
10.4 User Readiness for Adoption
10.4.1 Adoption of Automated Warehousing
10.4.2 Adoption of Real-Time Shipment Visibility
10.4.3 Adoption of Multimodal Rail Freight
10.4.4 Adoption of Green Logistics Solutions
10.5 Post-Deployment ROI and Use Case Expansion
10.5.1 Inventory Reduction and Faster Fulfillment
10.5.2 Transport Cost Optimization
10.5.3 Reduction in Customs and Border Dwell Time
10.5.4 Expansion from Transportation to Integrated 3PL Contracts
11. UAE Logistics Market Future Size, 2025-2030
11.1 By Value
11.2 By Shipment & Freight Volume
11.3 By Average Revenue per Shipment / Logistics Transaction
Go-To-Market Strategy Phase
1. Whitespace Analysis + Business Model Canvas
1.1 Automated Grade-A Warehousing
1.2 Bonded Regional Distribution Centers
1.3 E-Commerce and Omnichannel Fulfillment
1.4 Cold Chain and Pharmaceutical Logistics
2. Marketing and Positioning Recommendations (Branding Strategies, Product USPs)
2.1 Position Around UAE-GCC Connectivity
2.2 Promote Customs, Free-Zone and Re-Export Expertise
2.3 Position Real-Time Visibility and Automation as Core USPs
2.4 Build Sector-Specific Logistics Proposition
3. Distribution Plan (Ports, Airports, Free Zones and Urban Fulfillment)
3.1 Jebel Ali and Dubai South Logistics Hub
3.2 Abu Dhabi and KEZAD Logistics Hub
3.3 Sharjah and Northern Emirates Distribution Network
3.4 Urban Fulfillment Network Across Dubai and Abu Dhabi
4. Channel & Pricing Gaps (Underserved Routes, Pricing Bands)
4.1 Grade-A Mid-Sized Warehouse Gap
4.2 Same-Day Fulfillment Pricing Gap
4.3 Northern Emirates Distribution Coverage Gap
4.4 Cross-Border GCC Consolidation Gap
5. Unmet Demand & Latent Needs (Category Gaps, Customer Segments)
5.1 Automated SME Fulfillment Solutions
5.2 Pharmaceutical and Healthcare Cold Chain
5.3 Rail-Integrated Freight Distribution
5.4 Sustainable Last-Mile Delivery
6. Customer Relationship (Loyalty Programs, After-Sales Service)
7.1 Dedicated Enterprise Account Management
7.2 Service-Level Agreements and Performance Dashboards
7.3 Volume-Based Logistics Contracts
7.4 Integrated Returns and Reverse Logistics Support
7. Value Proposition (Sustainability, Integrated Supply Chains)
8.1 Multimodal UAE and GCC Connectivity
8.2 End-to-End Customs and Fulfillment Capability
8.3 Real-Time Shipment and Inventory Visibility
8.4 Scalable Warehousing and Distribution Capacity
8. Key Activities (Regulatory Compliance, Branding, Distribution Setup)
9.1 Land Transport and Customs Licensing
9.2 Warehouse and Free-Zone Facility Setup
9.3 Technology and Automation Integration
9.4 Transport, Fulfillment and Customs Partner Development
9. Entry Strategy Evaluation
9.1 Domestic Market Entry Strategy (Service Mix, Pricing Band, Coverage)
10.1.1 Launch Warehousing, Freight Forwarding and Last-Mile Services
10.1.2 Establish Dubai Hub with Abu Dhabi and Sharjah Coverage
10.1.3 Offer Tiered Standard, Express and Integrated Logistics Solutions
10.1.4 Develop Industry-Specific Logistics Packages
9.2 Export Entry Strategy (GCC Trade Lanes, Compliance Roadmap)
10.2.1 Use UAE as GCC and Regional Re-Export Hub
10.2.2 Establish Saudi Arabia and Oman Road Freight Corridors
10.2.3 Build Sea-Air and Air-Sea Multimodal Solutions
10.2.4 Develop GCC Customs and Transit Compliance Framework
10. Entry Mode Assessment (JV, Greenfield, M&A, Distributor Model)
11.1 Local Logistics Partnership Model
11.2 Joint Venture with UAE Warehousing or Transport Operator
11.3 Greenfield Grade-A Logistics Facility
11.4 Acquisition of Specialized Logistics Operator
11. Capital and Timeline Estimation (Capital Requirements, Timelines)
12.1 Warehouse Lease and Fit-Out Requirements
12.2 Fleet and Material-Handling Equipment Investment
12.3 Automation and Technology Investment
12.4 Working Capital and Customer Acquisition Requirements
12. Control vs Risk Trade-Off (Ownership vs Partnerships)
13.1 Asset Ownership versus Asset-Light Logistics Model
13.2 Direct Fleet Control versus Subcontracted Transportation
13.3 Warehouse Capacity versus Occupancy Risk
13.4 Premium Service Positioning versus Price Competition
13. Profitability Outlook (Breakeven Analysis, Long-Term Sustainability)
14.1 Gross Margin by Logistics Service
14.2 Warehouse Occupancy and Utilization Economics
14.3 Fleet Utilization and Delivery Density
14.4 Value-Added and Contract Logistics Revenue Potential
14. Potential Partner List (Distributors, JVs, Acquisition Targets)
15.1 Dubai South - Logistics Infrastructure Partnership Assessment
15.2 Jebel Ali Free Zone - Regional Distribution Assessment
15.3 KEZAD Group - Abu Dhabi Industrial Logistics Assessment
15.4 UAE Transport and Customs Brokerage Operators - Partnership Assessment
15. Execution Roadmap
15.1 Phased Plan for Market Entry (Market Setup → Market Entry → Growth Acceleration → Scale & Stabilize)
16.1.1 Market Setup: Licensing, Facility Selection and Customer Mapping
16.1.2 Market Entry: Dubai Operations and Anchor Customer Acquisition
16.1.3 Growth Acceleration: Abu Dhabi, Sharjah and GCC Trade Lane Expansion
16.1.4 Scale & Stabilize: Automation, Multimodal Integration and Contract Logistics Growth
15.2 Key Activities and Milestones
16.2.1 Secure Required Transport, Customs and Warehousing Licenses
16.2.2 Establish Primary UAE Logistics Facility
16.2.3 Launch Freight Forwarding and Fulfillment Operations
16.2.4 Onboard Priority Enterprise Customers
16.2.5 Integrate Warehouse, Transport and Customer Visibility Platforms
16.2.6 Expand into GCC Cross-Border and Multimodal Logistics
Research Methodology
Phase 1: Approach1
Desk Research
- Analysis of UAE port throughput, air cargo, e-commerce, warehousing, customs and transportation activity
- Review of federal land transport regulations, GCC customs requirements, customs warehouse procedures and free-zone frameworks
- Assessment of logistics-provider service portfolios, trade lanes, fulfillment networks, warehouse projects and multimodal infrastructure
Primary Research
- Interviews with freight-forwarding companies, 3PL operators, express-delivery providers and warehouse operators
- Discussions with supply-chain directors, procurement managers and logistics heads across retail, manufacturing and industrial companies
- Interviews with customs brokers, free-zone operators, fleet managers and e-commerce fulfillment professionals
Validation & Triangulation
- Cross-validation of freight, parcel, warehousing and customs activity through multiple secondary and primary inputs
- Triangulation of company-level operations with customer procurement behavior, trade flows and facility utilization
- Sanity checks across domestic express, international express, warehousing, freight forwarding and customs-clearance segments
Phase 2: Market Size Estimation1
Top-down Assessment
- Assessment of national logistics-sector activity across transportation, storage, forwarding, fulfillment and customs services
- Allocation of market activity across domestic express, international express, warehousing, freight forwarding and customs clearance
- Adjustment for captive logistics, outsourced logistics penetration, re-export activity and integrated 3PL services
Bottom-up Modeling
- Company-level shipment, freight, warehouse and fulfillment activity benchmarks
- Service-value estimates based on shipment flows, storage utilization, cargo movement and contract logistics activity
- Aggregation of logistics expenditure across retail, manufacturing, automotive, FMCG, healthcare and industrial end users
Forecasting & Scenario Analysis
- Assessment of e-commerce growth, international trade, industrial development and new logistics infrastructure
- Scenarios based on automation adoption, warehousing supply, rail integration and logistics outsourcing
- Baseline, accelerated-integration and constrained-capacity scenarios through the outlook period
Phase 3: CATI Sample Composition1
| Scope Item/Segment | Sample Size | Target Respondent Profiles |
|---|---|---|
| Domestic & International Express Logistics | 120 | Operations Heads, Network Managers, Commercial Directors, Hub Managers |
| Warehousing & Fulfillment | 110 | Warehouse Managers, Distribution Heads, Fulfillment Managers, 3PL Directors |
| Freight Forwarding | 90 | Freight Forwarding Managers, Trade Lane Heads, Key Account Managers |
| Customs Clearance & Cross-Border Logistics | 65 | Customs Brokers, Clearance Managers, Import-Export Managers |
| Enterprise Logistics Users | 55 | Supply Chain Directors, Procurement Heads, Logistics Managers, Distribution Managers |
Frequently Asked Questions
What is the size of the UAE Logistics Market?
The UAE Logistics Market contributes approximately AED 136.7 billion, equivalent to about USD 37.2 billion, to the national economy. It includes freight forwarding, road distribution, warehousing, express delivery, customs clearance and integrated logistics supporting domestic trade, imports, exports and regional re-export activity.
What is driving growth in the UAE Logistics Market?
Which emirates dominate the UAE Logistics Market?
Why Buy From Us?

What makes us stand out is that our consultants follow Robust, Refine and Result (RRR) methodology. Robust for clear definitions, approaches and sanity checking, Refine for differentiating respondents' facts and opinions, and Result for presenting data with story.

We have set a benchmark in the industry by offering our clients with syndicated and customized market research reports featuring coverage of entire market as well as meticulous research and analyst insights.

While we don't replace traditional research, we flip the method upside down. Our dual approach of Top Bottom & Bottom Top ensures quality deliverable by not just verifying company fundamentals but also looking at the sector and macroeconomic factors.

With one step in the future, our research team constantly tries to show you the bigger picture. We help with some of the tough questions you may encounter along the way: How is the industry positioned? Best marketing channel? KPI's of competitors? By aligning every element, we help maximize success.

Our report gives you instant access to the answers and sources that other companies might choose to hide. We elaborate each steps of research methodology we have used and showcase you the sample size to earn your trust.

If you need any support, we are here! We pride ourselves on universe strength, data quality, and quick, friendly, and professional service.