
United States Gaming Market Outlook to 2030
Region:North America
Author(s):Sanjeev
Product Code:KROD10210
October 2024
85
About the Report
United States Gaming Market Overview
The United States Gaming Market is valued at USD 54 billion, driven by strong consumer demand for mobile, console, and PC gaming, as well as the rapid expansion of cloud gaming services. The markets consistent growth is fueled by technological advancements such as 5G and the widespread availability of high-speed internet, providing smoother online gameplay experiences and driving higher consumer spending on games and related in-game content.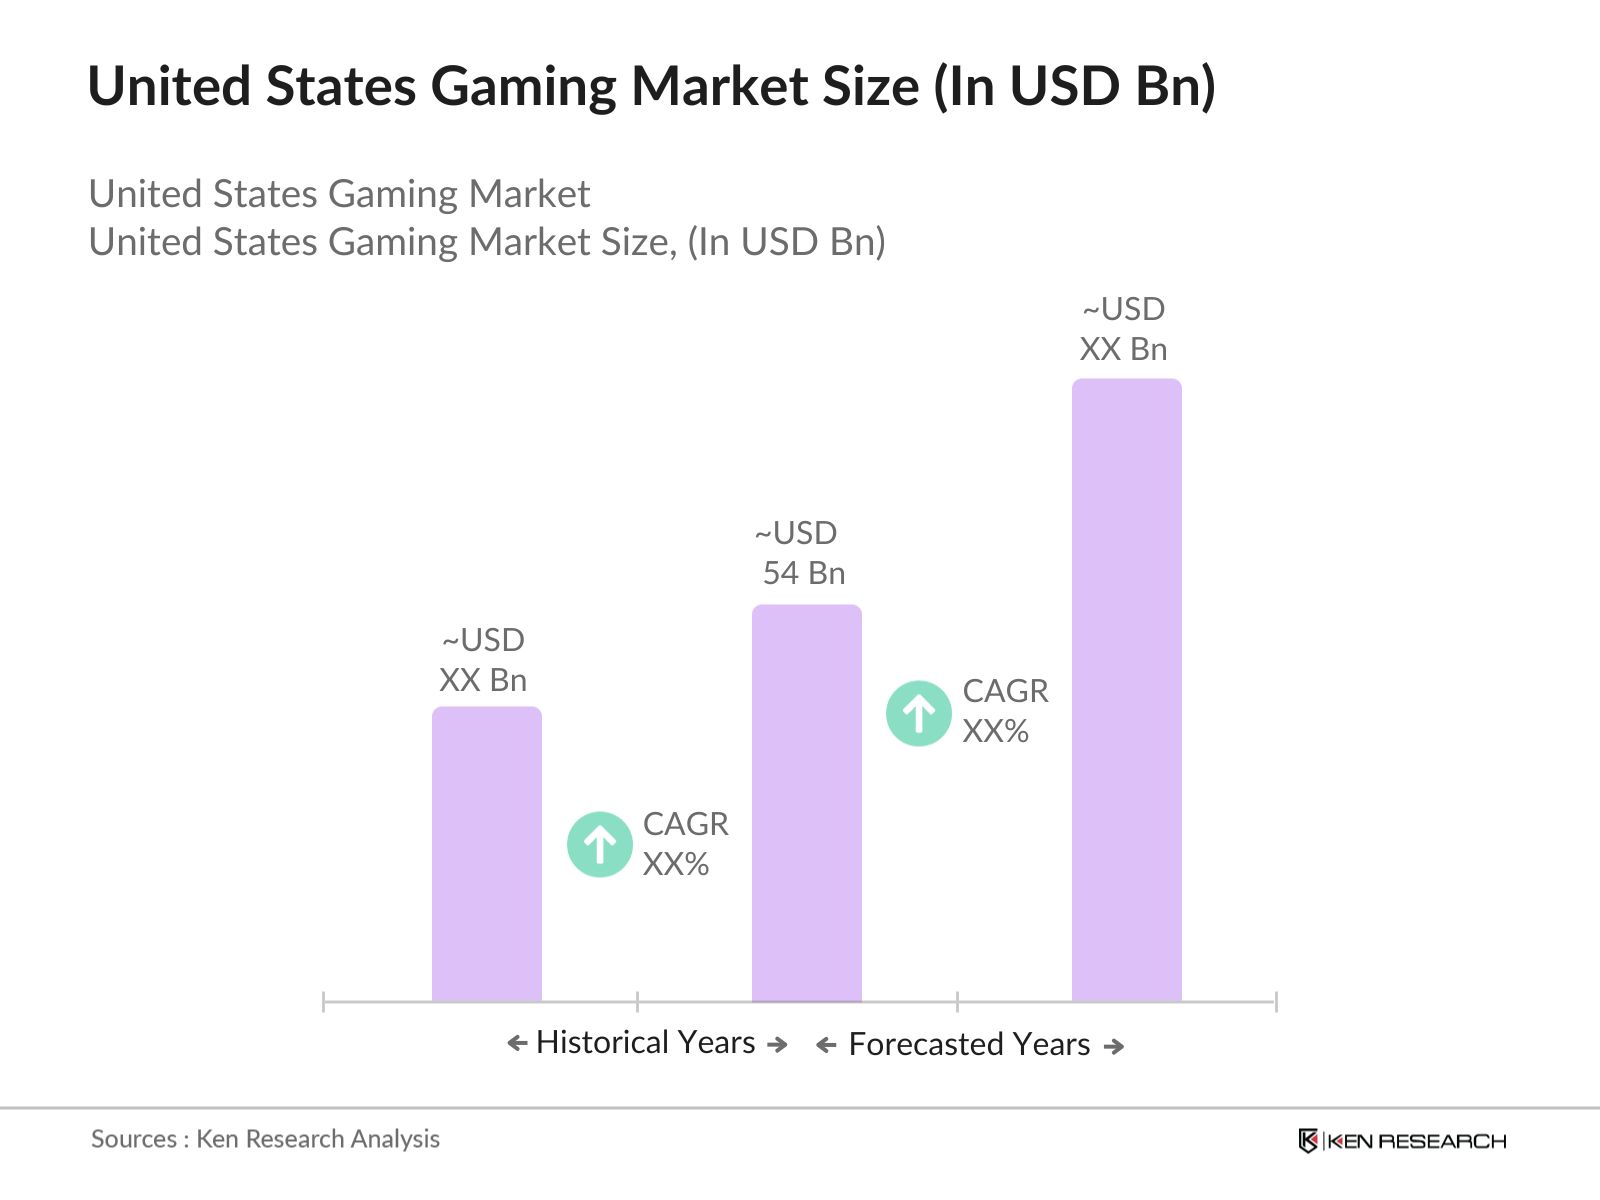
The dominant regions in the U.S. gaming market include cities like San Francisco, Los Angeles, and New York, which benefit from being home to major gaming developers, esports organizations, and technology hubs. These cities provide an environment rich in talent and resources, contributing to their leadership in gaming innovation and content production. The presence of major gaming companies such as Electronic Arts, Activision Blizzard, and Riot Games further consolidates their dominance in the industry. The Entertainment Software Rating Board (ESRB) is the primary body responsible for content rating standards in the U.S., ensuring that video games are appropriately labeled based on their content. Under federal law, games featuring explicit content (violence, language, etc.) are required to display ESRB ratings clearly on packaging and digital storefronts. As of 2023, 96% of all games sold in the U.S. comply with ESRB ratings, with the "Mature" category covering 23% of all sales. Non-compliance can result in retail bans and heavy penalties for developers and publishers. The Federal Communications Commission (FCC) also monitors broadcasted gaming content for compliance with ESRB standards.
United States Gaming Market Segmentation
The United States gaming market is segmented by platform and by game type.
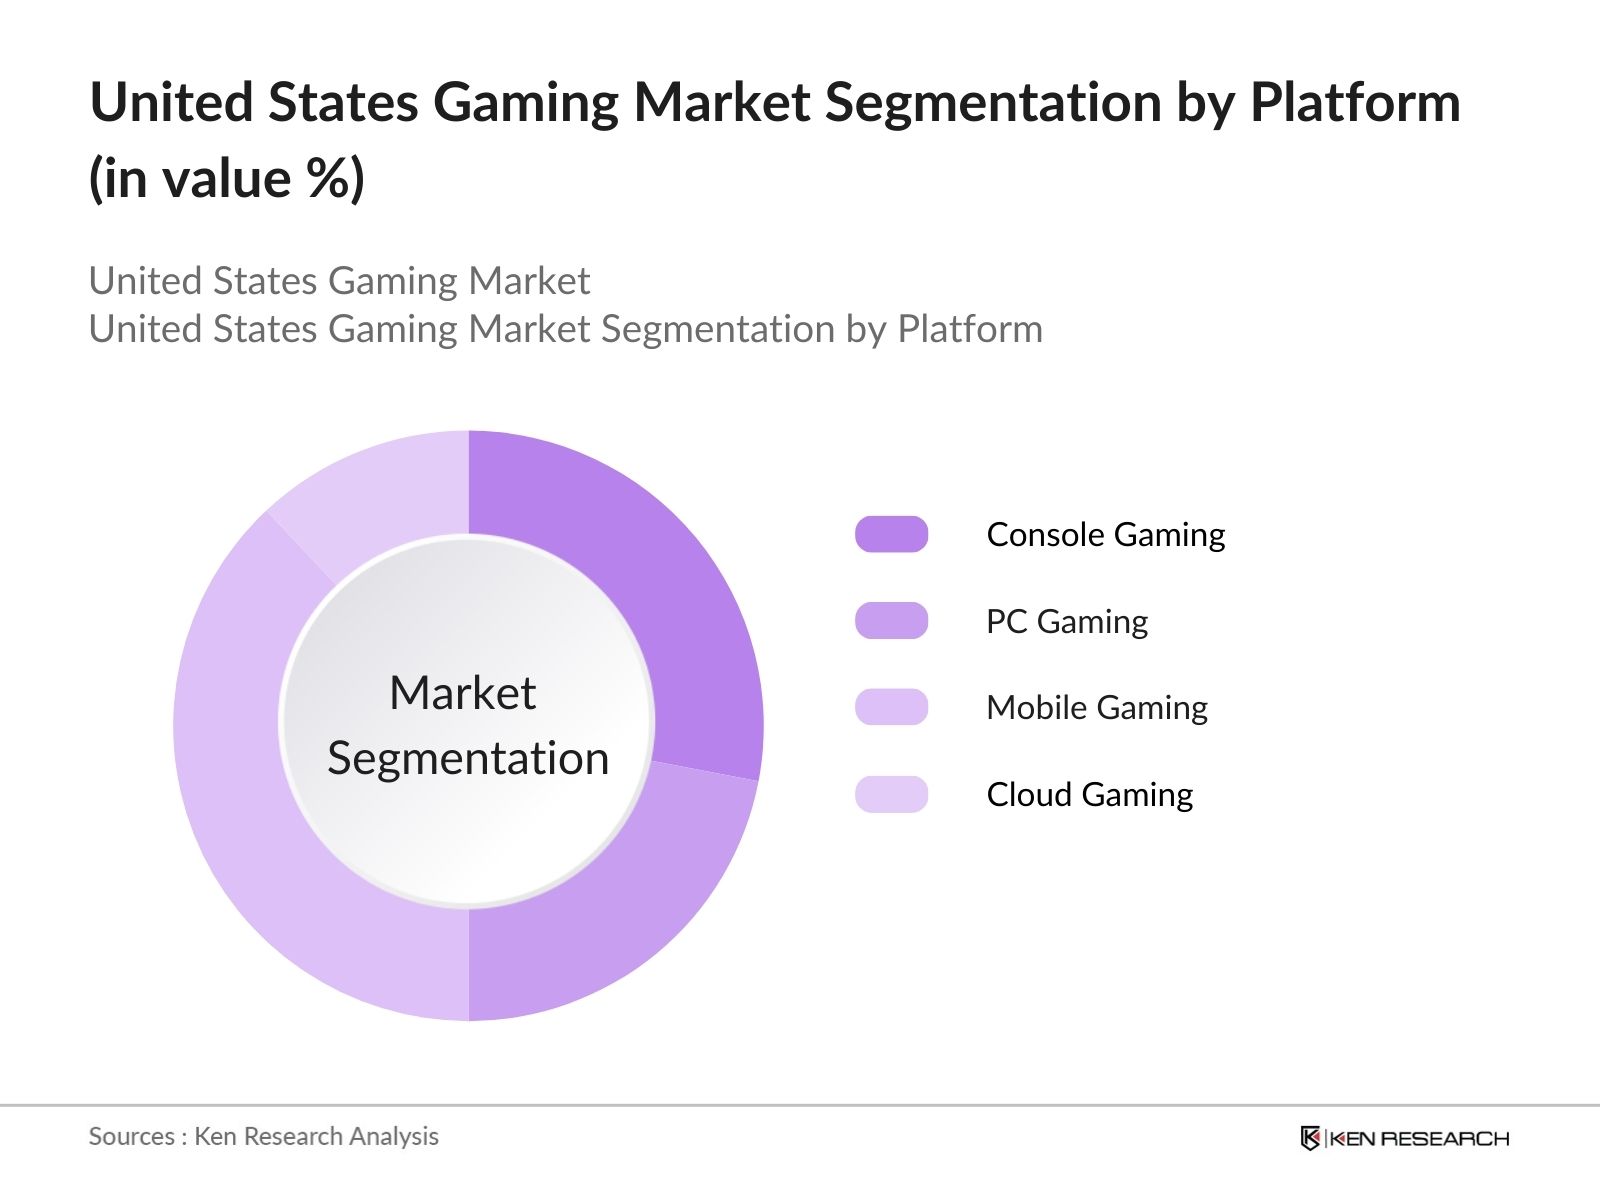
- By Platform: The United States gaming market is segmented by platform into Console Gaming, PC Gaming, Mobile Gaming, and Cloud Gaming. Recently, Mobile Gaming has seen a dominant market share in the platform segmentation due to the accessibility and convenience of smartphones, which allow users to play games anywhere. The rise of free-to-play models, in-game purchases, and ad-based monetization has boosted revenue generation for mobile platforms, making this segment a leader. Furthermore, the increasing power of mobile devices and the introduction of mobile esports tournaments are attracting more players and spectators to mobile gaming.
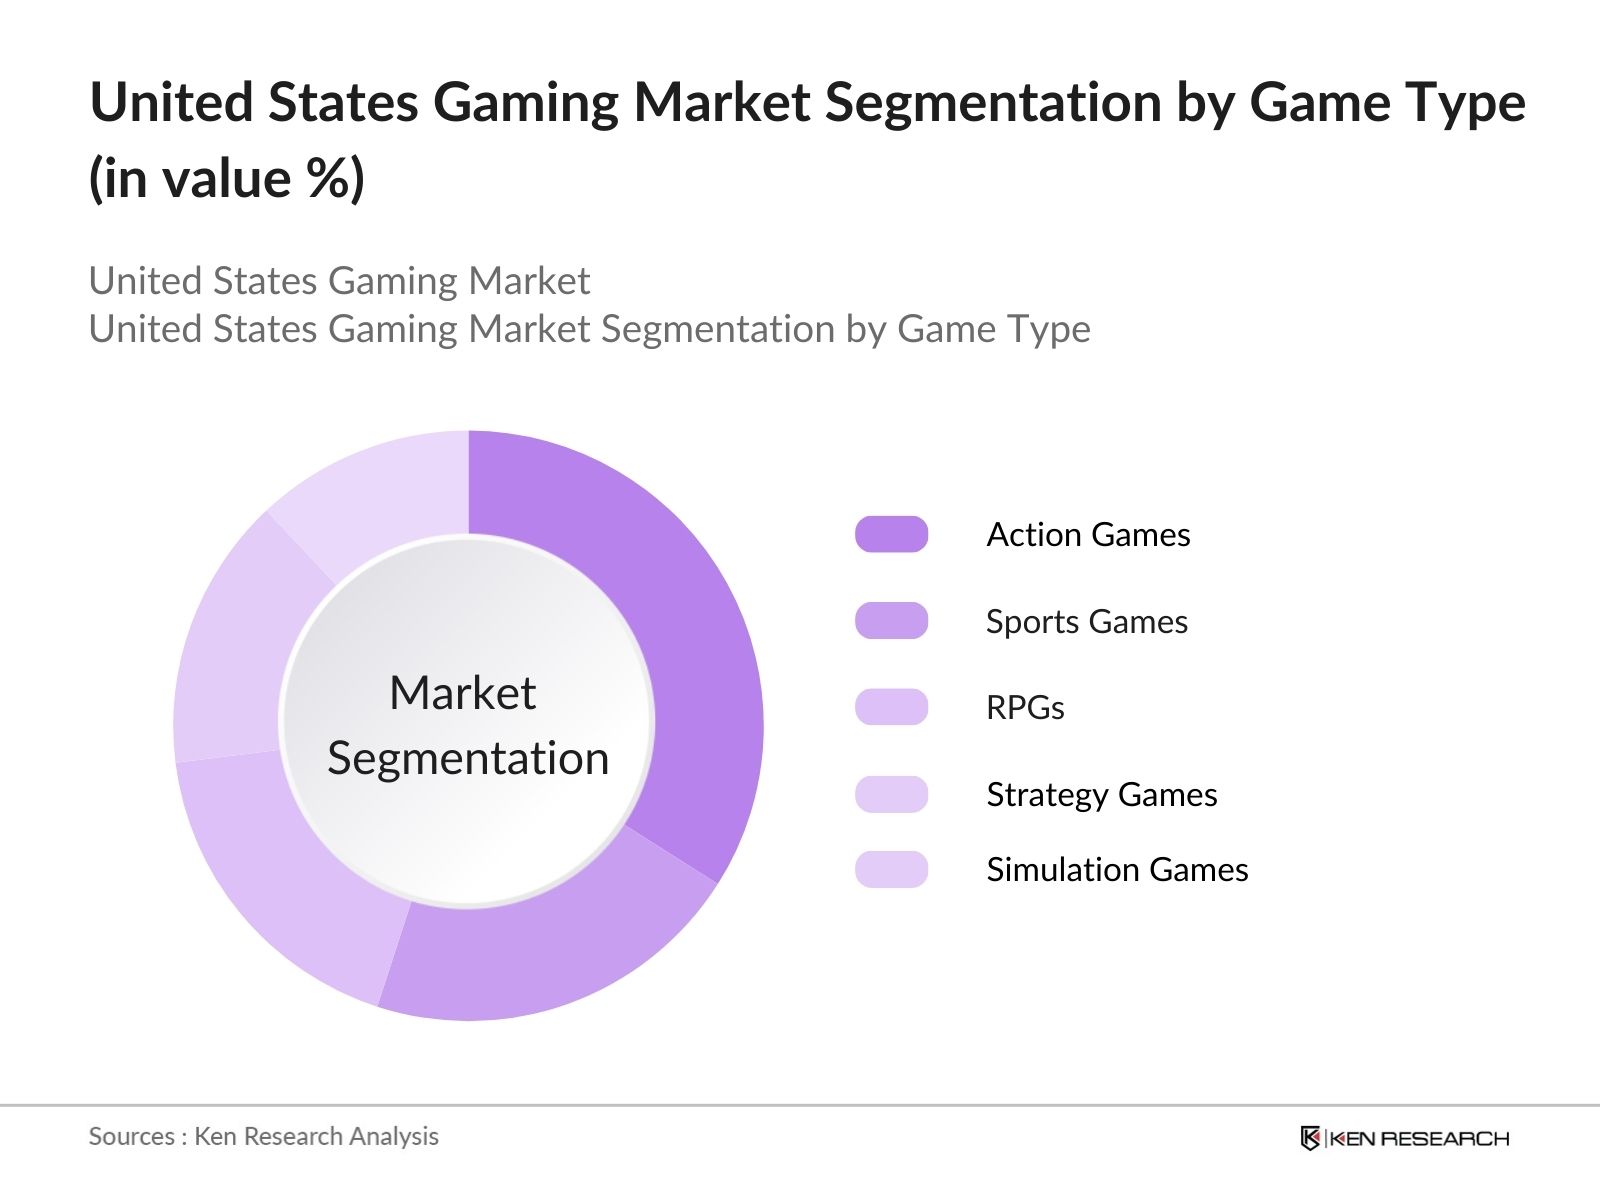
- By Game Type: The U.S. gaming market is also segmented by game type into Action Games, Sports Games, Role-Playing Games (RPGs), Strategy Games, and Simulation Games. Action Games continue to dominate the market share under the game type segmentation due to their broad appeal and immersive gameplay experiences. These games often feature high-quality graphics, compelling narratives, and dynamic gameplay, attracting a wide demographic of players. Additionally, action games are often popular in esports tournaments, contributing to their dominance in the market.
United States Gaming Market Competitive Landscape
The U.S. gaming market is highly competitive, with key players occupying significant market positions. These companies lead the industry due to their innovative game development, robust distribution networks, and strong brand recognition.
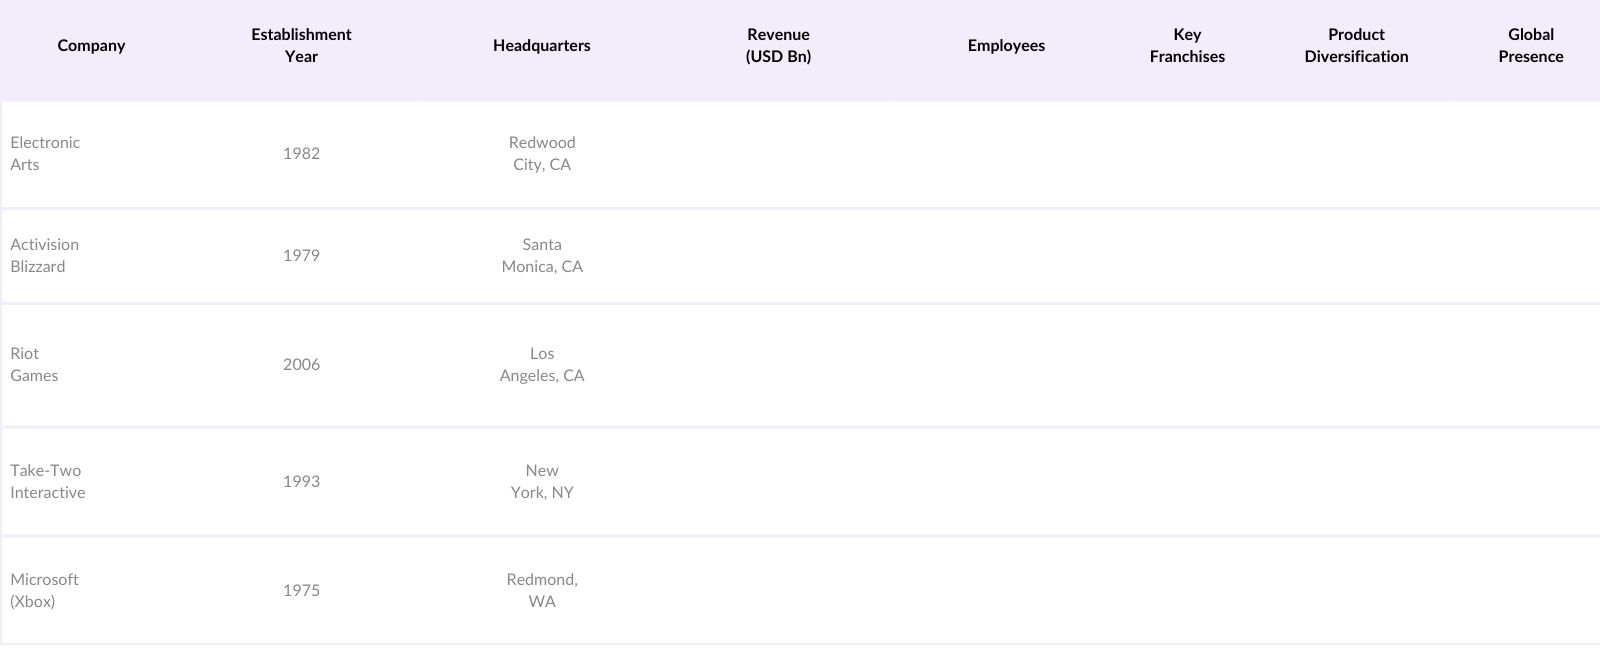
The competitive landscape features established giants such as Electronic Arts, Activision Blizzard, Riot Games, and Take-Two Interactive, all of which are heavily involved in console, PC, and mobile gaming. These companies are continuously investing in game development, esports, and live-service models to sustain their market presence and expand their customer base.
United States Gaming Market Analysis
Growth Drivers
- Expansion of Cloud Gaming: The expansion of cloud gaming in the U.S. market is heavily driven by advancements in server infrastructure and high-speed internet. By 2023, the average internet speed in the U.S. reached 197.4 Mbps, enabling smoother cloud-based gaming experiences with minimal latency, a critical factor for immersive gameplay. This growth is further supported by increased investments from major tech companies, with Microsoft investing over $10 billion in cloud gaming services, and Google expanding its Stadia platform. The global surge in cloud service data centers, expected to hit 700 by 2025, directly impacts the U.S. gaming market. Source.
- Growth in Mobile Gaming Adoption: Mobile gaming is rapidly increasing due to smartphone penetration, which hit 307 million active users in the U.S. by 2023. This adoption is linked to the increased processing power of mobile devices, with phones like the iPhone 14 offering high-resolution screens and faster processors. Mobile gaming applications generated over $40 billion in revenue in 2022, with popular titles such as Call of Duty Mobile and Fortnite showing high engagement levels. Furthermore, Apples App Store alone contributed to over $85 billion in mobile game downloads globally. Source.
- Rise in E-Sports Popularity: The U.S. e-sports sector has experienced exponential growth, with over 30 million viewers tuning into live e-sports events in 2023. Top e-sports events, such as the League of Legends World Championship, garnered over 5 million U.S. viewers in 2022. This increase in viewership is supported by a rise in media rights deals, sponsorships, and advertising revenue, valued at approximately $300 million in 2023. Furthermore, U.S. colleges now offer over 300 varsity e-sports programs, reflecting increased institutional support and job opportunities.
Market Challenges
- High Game Development Costs: The costs associated with game development in the U.S. have surged, with AAA titles costing between $50 million and $300 million to develop as of 2023. Developers face high labor costs, which account for 70% of the total cost. The need for sophisticated technologies like motion capture, VR integration, and photorealistic graphics drives these figures upward. Furthermore, studios are increasingly hiring specialists for AI and machine learning to enhance gaming experiences, contributing to higher operational expenses. Source.
- Regulatory Restrictions on Microtransactions: In 2022, over 30% of U.S. states considered legislation regulating microtransactions, especially loot boxes, citing concerns over gambling-like behavior in minors. For instance, Hawaii and Washington passed bills requiring clear disclosures on in-game purchases. Such restrictions can impact revenue generation for free-to-play games that rely heavily on microtransactions, reducing profit margins for developers targeting U.S. audiences. Consequently, developers may need to explore alternative monetization models that comply with new regulations.
United States Gaming Market Future Outlook
The U.S. gaming market is expected to witness significant growth over the next five years, driven by advancements in game streaming technology, increased adoption of 5G, and the rise of cross-platform gaming experiences. As cloud gaming infrastructure matures, more consumers are likely to shift towards subscription-based models, while the increasing popularity of esports will further drive revenue growth and community engagement in the gaming sector. Additionally, as virtual reality and augmented reality technologies advance, the immersive gaming experience will evolve, opening new monetization opportunities for developers and hardware manufacturers.
Market Opportunities
- Monetization of Virtual Reality (VR) and Augmented Reality (AR) Gaming: The U.S. VR/AR gaming market has grown significantly, with over 8 million active VR users recorded in 2023, fueled by the release of platforms like the Meta Quest 2. U.S.-based companies like Meta and Sony have continued to invest in VR hardware, leading to an increased focus on VR-exclusive game titles. Additionally, AR applications, such as Pokmon GO, still engage millions of daily users, indicating untapped potential for new AR-based gaming experiences. This trend presents a lucrative opportunity for developers to create immersive and interactive gaming environments. Source.
- Expansion of Gaming Subscriptions: In 2023, subscription-based gaming services like Xbox Game Pass and PlayStation Plus attracted over 50 million subscribers in the U.S., reflecting a growing consumer shift towards all-access gaming libraries. The average U.S. household now spends over $250 annually on gaming subscriptions, offering a recurring revenue stream for developers and publishers. This trend also reduces entry barriers for gamers, who now access more content at lower costs, driving engagement and providing opportunities for smaller developers to distribute their games through these platforms. Source.
Scope of the Report
|
||
|
By Game Type |
Action Games Sports Games RPG Strategy Games Simulation Games |
|
|
By Distribution Channel |
Digital Downloads Physical Sales Subscription Services |
|
|
By Device |
Smartphones and Tablets PCs and Laptops Gaming Consoles VR Devices |
|
|
By Region |
North East West South |
Products
Key Target Audience
Game Developers and Publishers
Esports Organizations
Streaming Platforms (e.g., Twitch, YouTube Gaming)
Console and PC Hardware Manufacturers
Mobile Device Manufacturers
Investors and Venture Capitalist Firms
Government and Regulatory Bodies (Federal Trade Commission, ESRB)
Online Payment Providers and Digital Wallet Companies
Companies
Players Mention in the Report:
Electronic Arts
Activision Blizzard
Riot Games
Take-Two Interactive
Microsoft Corporation (Xbox)
Sony Interactive Entertainment (PlayStation)
Tencent Holdings (Riot Games)
Valve Corporation
Ubisoft Entertainment
Zynga Inc.
NetEase Games
Nintendo Co., Ltd.
Square Enix Holdings
Bandai Namco
Roblox Corporation
Table of Contents
1. United States Gaming Market Overview
1.1. Definition and Scope
1.2. Market Taxonomy
1.3. Market Growth Rate
1.4. Market Segmentation Overview
2. United States Gaming Market Size (In USD Mn)
2.1. Historical Market Size
2.2. Year-on-Year Growth Analysis
2.3. Key Market Developments and Milestones
3. United States Gaming Market Analysis
3.1. Growth Drivers
3.1.1. Expansion of Cloud Gaming
3.1.2. Growth in Mobile Gaming Adoption
3.1.3. Rise in E-Sports Popularity
3.1.4. Increased Penetration of High-Speed Internet
3.2. Market Challenges
3.2.1. High Game Development Costs
3.2.2. Regulatory Restrictions on Microtransactions
3.2.3. Data Privacy and Security Concerns
3.2.4. Intense Competitive Pressure from International Developers
3.3. Opportunities
3.3.1. Monetization of Virtual Reality (VR) and Augmented Reality (AR) Gaming
3.3.2. Expansion of Gaming Subscriptions
3.3.3. Collaborations with Entertainment Media for Game Licensing
3.3.4. Growth in Indie Game Development
3.4. Trends
3.4.1. Cross-Platform Gaming Integration
3.4.2. In-Game Advertising and Sponsorship Deals
3.4.3. Live Streaming and Game Streaming Growth
3.4.4. Blockchain-based Gaming
3.5. Government Regulations
3.5.1. Regulations on Loot Boxes and Microtransactions
3.5.2. Content Rating Standards (ESRB)
3.5.3. Data Security Mandates for Gaming Platforms
3.5.4. E-Sports Licensing and Betting Laws
3.6. SWOT Analysis
3.7. Ecosystem Analysis (Developers, Distributors, Platforms)
3.8. Porters Five Forces Analysis
3.9. Competition Ecosystem
4. United States Gaming Market Segmentation
4.1. By Platform (In Value %)
4.1.1. Console Gaming
4.1.2. PC Gaming
4.1.3. Mobile Gaming
4.1.4. Cloud Gaming
4.2. By Game Type (In Value %)
4.2.1. Action Games
4.2.2. Sports Games
4.2.3. Role-Playing Games (RPG)
4.2.4. Strategy Games
4.2.5. Simulation Games
4.3. By Distribution Channel (In Value %)
4.3.1. Digital Downloads
4.3.2. Physical Sales
4.3.3. Subscription Services
4.4. By Device (In Value %)
4.4.1. Smartphones and Tablets
4.4.2. PCs and Laptops
4.4.3. Gaming Consoles
4.4.4. Virtual Reality Devices
4.5. By Region (In Value %)
4.5.1. North
4.5.2. East
4.5.3. West
4.5.4. South
5. United States Gaming Market Competitive Analysis
5.1. Detailed Profiles of Major Companies
5.1.1. Activision Blizzard
5.1.2. Electronic Arts
5.1.3. Take-Two Interactive
5.1.4. Epic Games
5.1.5. Microsoft Corporation (Xbox)
5.1.6. Sony Interactive Entertainment (PlayStation)
5.1.7. Tencent Holdings (Riot Games)
5.1.8. Valve Corporation
5.1.9. Zynga Inc.
5.1.10. Ubisoft Entertainment
5.1.11. Bandai Namco
5.1.12. Nintendo Co., Ltd.
5.1.13. NetEase Games
5.1.14. Square Enix Holdings
5.1.15. Roblox Corporation
5.2. Cross Comparison Parameters
(Revenue, Market Share, Product Portfolio, Development Strategy, Partnerships, Innovation Index, Market Capitalization, Regional Presence)
5.3. Market Share Analysis
5.4. Strategic Initiatives
5.5. Mergers and Acquisitions
5.6. Investment Analysis
5.7. Venture Capital and Private Equity Investments
5.8. Government Grants and Subsidies
6. United States Gaming Market Regulatory Framework
6.1. Data Security and Privacy Laws
6.2. Content Moderation and Rating Systems
6.3. Online Gambling and E-Sports Regulations
6.4. Intellectual Property Protections
7. United States Gaming Future Market Size (In USD Mn)
7.1. Future Market Size Projections
7.2. Key Factors Driving Future Market Growth
8. United States Gaming Future Market Segmentation
8.1. By Platform (In Value %)
8.2. By Game Type (In Value %)
8.3. By Distribution Channel (In Value %)
8.4. By Device (In Value %)
8.5. By Region (In Value %)
9. United States Gaming Market Analysts Recommendations
9.1. Total Addressable Market (TAM), Serviceable Available Market (SAM), Serviceable Obtainable Market (SOM)
9.2. Key Consumer Trends Analysis
9.3. Expansion and Marketing Strategies
9.4. White Space Opportunity Analysis
Disclaimer
Contact Us
Research Methodology
Step 1: Identification of Key Variables
The first step involves creating an ecosystem map that encompasses all stakeholders in the U.S. gaming market. This process is supported by extensive desk research utilizing proprietary databases and secondary sources, aimed at identifying critical variables such as user demographics, technology adoption rates, and game genres that influence market trends.
Step 2: Market Analysis and Construction
This step involves analyzing historical market data from the U.S. gaming sector. This includes reviewing market penetration rates for various platforms, analyzing revenue generated by different game genres, and assessing the impact of subscription services and free-to-play models. This analysis is used to construct accurate revenue forecasts.
Step 3: Hypothesis Validation and Expert Consultation
Market hypotheses are validated through interviews with gaming industry experts, including developers, publishers, and esports organizers. These consultations provide insights into the operational challenges, emerging opportunities, and consumer behavior trends that are shaping the market.
Step 4: Research Synthesis and Final Output
In this phase, data from interviews and secondary research are synthesized into actionable insights, including detailed analysis of market segments, growth drivers, and competitive dynamics. This ensures that the final output provides a comprehensive and accurate picture of the U.S. gaming market.
Frequently Asked Questions
01. How big is the United States Gaming Market?
The U.S. gaming market was valued at USD 54 billion, driven by high consumer spending across mobile, console, and PC platforms, as well as the expansion of cloud gaming services.
02. What are the challenges in the U.S. Gaming Market?
Challenges in U.S. gaming market include high development costs, regulatory hurdles related to microtransactions, and the increasingly competitive landscape as international companies seek to enter the U.S. market.
03. Who are the major players in the U.S. Gaming Market?
Key players in the U.S. gaming market include Electronic Arts, Activision Blizzard, Riot Games, Take-Two Interactive, and Microsoft (Xbox), each dominating due to their strong franchises and deep market penetration.
04. What are the growth drivers of the U.S. Gaming Market?
Key growth drivers in U.S. gaming market include advancements in 5G technology, the proliferation of mobile gaming, the rise of esports, and the increasing popularity of subscription-based cloud gaming services.
05. What role do esports play in the U.S. Gaming Market?
Esports is a major growth area, with increasing investment from both game developers and sponsors, driving significant engagement from younger audiences and contributing to higher in-game spending.
Why Buy From Us?
 Framework")
What makes us stand out is that our consultants follows Robust, Refine and Result (RRR) methodology. i.e. Robust for clear definitions, approaches and sanity checking, Refine for differentiating respondents facts and opinions and Result for presenting data with story

We have set a benchmark in the industry by offering our clients with syndicated and customized market research reports featuring coverage of entire market as well as meticulous research and analyst insights.

While we don't replace traditional research, we flip the method upside down. Our dual approach of Top Bottom & Bottom Top ensures quality deliverable by not just verifying company fundamentals but also looking at the sector and macroeconomic factors.

With one step in the future, our research team constantly tries to show you the bigger picture. We help with some of the tough questions you may encounter along the way: How is the industry positioned? Best marketing channel? KPI's of competitors? By aligning every element, we help maximize success.

Our report gives you instant access to the answers and sources that other companies might choose to hide. We elaborate each steps of research methodology we have used and showcase you the sample size to earn your trust.

If you need any support, we are here! We pride ourselves on universe strength, data quality, and quick, friendly, and professional service.