


U.S. Ball Sports Goods Market Outlook to 2030
Region:North America
Author(s):Shreya Garg
Product Code:KROD2088
December 2024
96
About the Report
U.S. Ball Sports Goods Market Overview
The U.S. Ball Sports Goods Market is valued at USD 3.35 billion, driven by a steady increase in youth sports participation and a rising focus on physical fitness. The popularity of sports like basketball, soccer, and baseball remains a central factor for market growth, and manufacturers are leveraging technology to introduce high-quality, performance-enhancing equipment. Additionally, e-commerce channels have expanded access to these goods, contributing significantly to market value. 
In terms of geographic dominance, major cities such as Los Angeles, New York, and Chicago lead due to the high concentration of sports leagues, professional teams, and sports-focused youth organizations. These cities have robust sports infrastructures and diverse demographics actively engaged in sports, promoting consistent demand for ball sports equipment and apparel.
Trade policies and tariffs influence the sports equipment industry, affecting both production and import costs. For example, the recent adjustments to US import tariffs on materials used in sports equipment manufacturing impact pricing structures, adding 8-12% cost for products imported from non-FTA countries. Such tariffs necessitate strategic sourcing and pricing adjustments for companies reliant on global supply chains.
U.S. Ball Sports Goods Market Segmentation
By Product Type: The Market is segmented by product type into equipment, apparel, and footwear. Equipment holds the largest market share due to the essential role it plays across all sports activities. Basketballs, soccer balls, and baseball equipment maintain high demand as these sports enjoy widespread popularity across various age groups. Technological advancements, like enhanced grip features and durability, make this category a critical driver in the overall market. 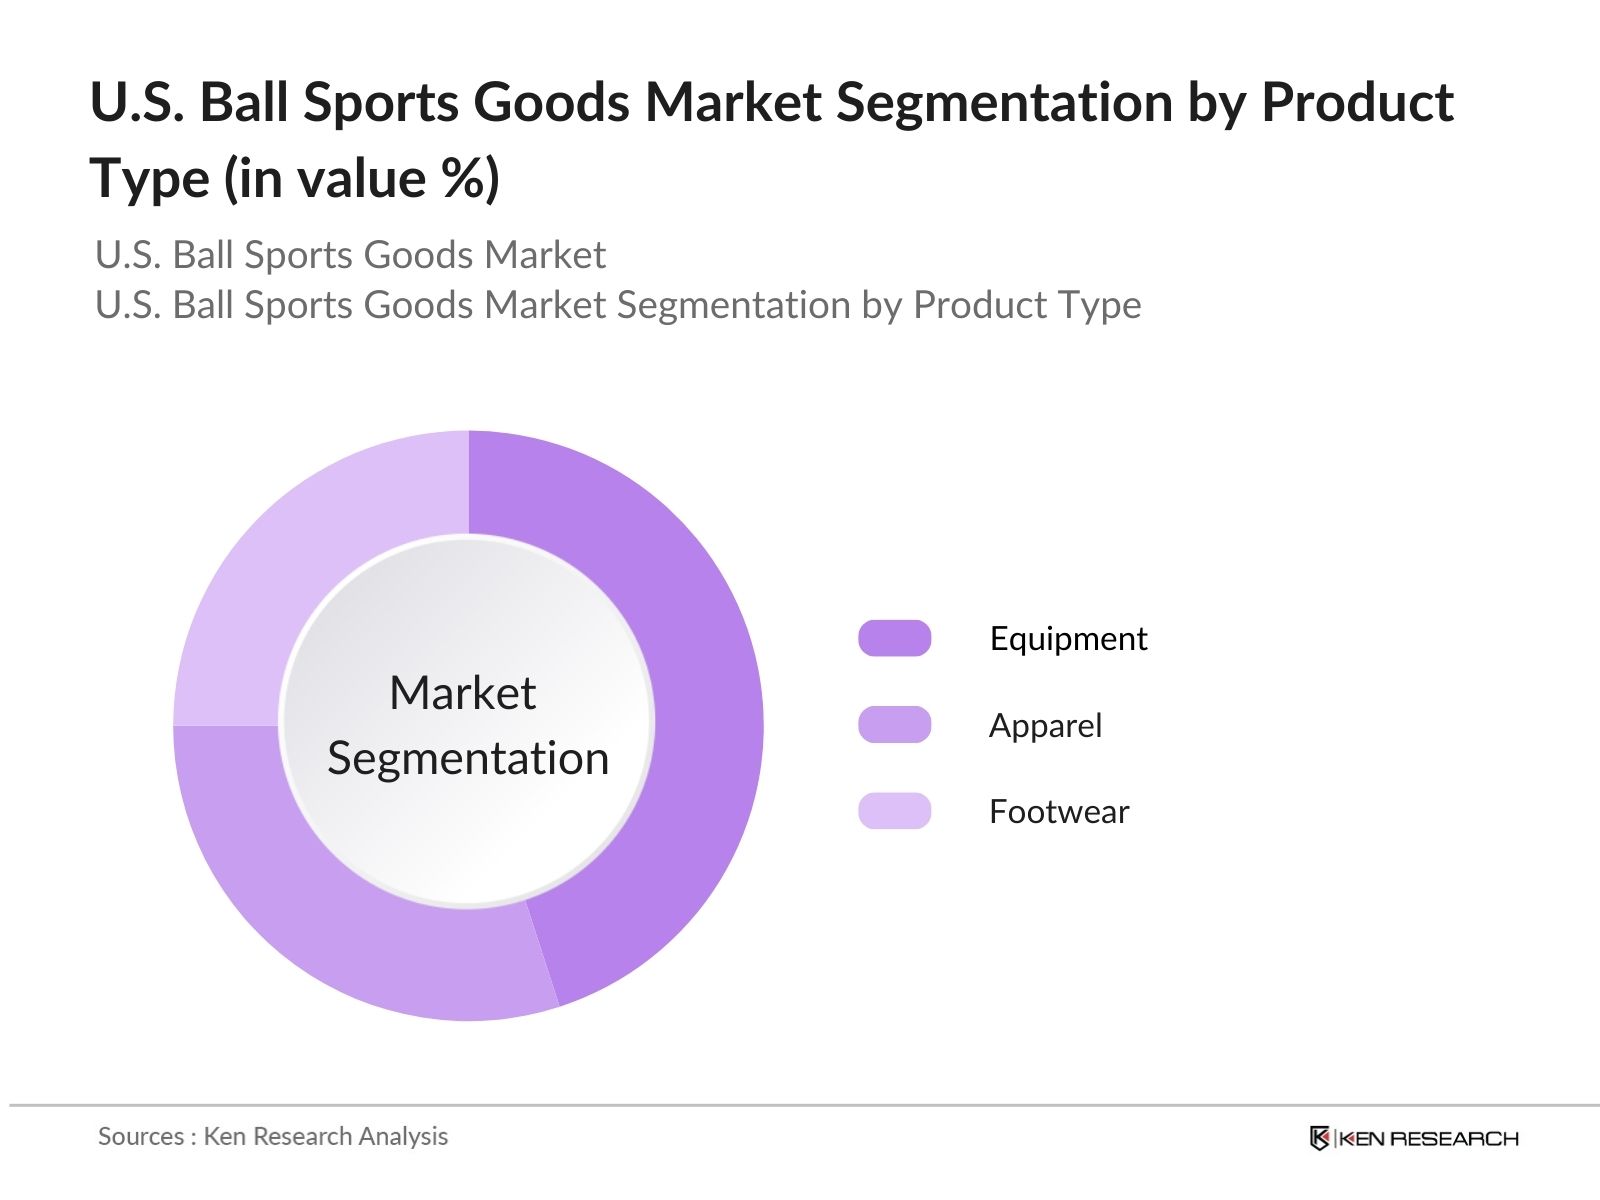
By Distribution Channel: Distribution channels include online retailers, sporting goods stores, supermarkets & hypermarkets, and exclusive brand outlets. Online retailers are currently dominating the market share within this segment, thanks to the convenience and extensive product range available on e-commerce platforms. Online sales have surged as consumers seek out premium sports goods and enjoy exclusive online discounts, making this channel a key contributor to market growth. 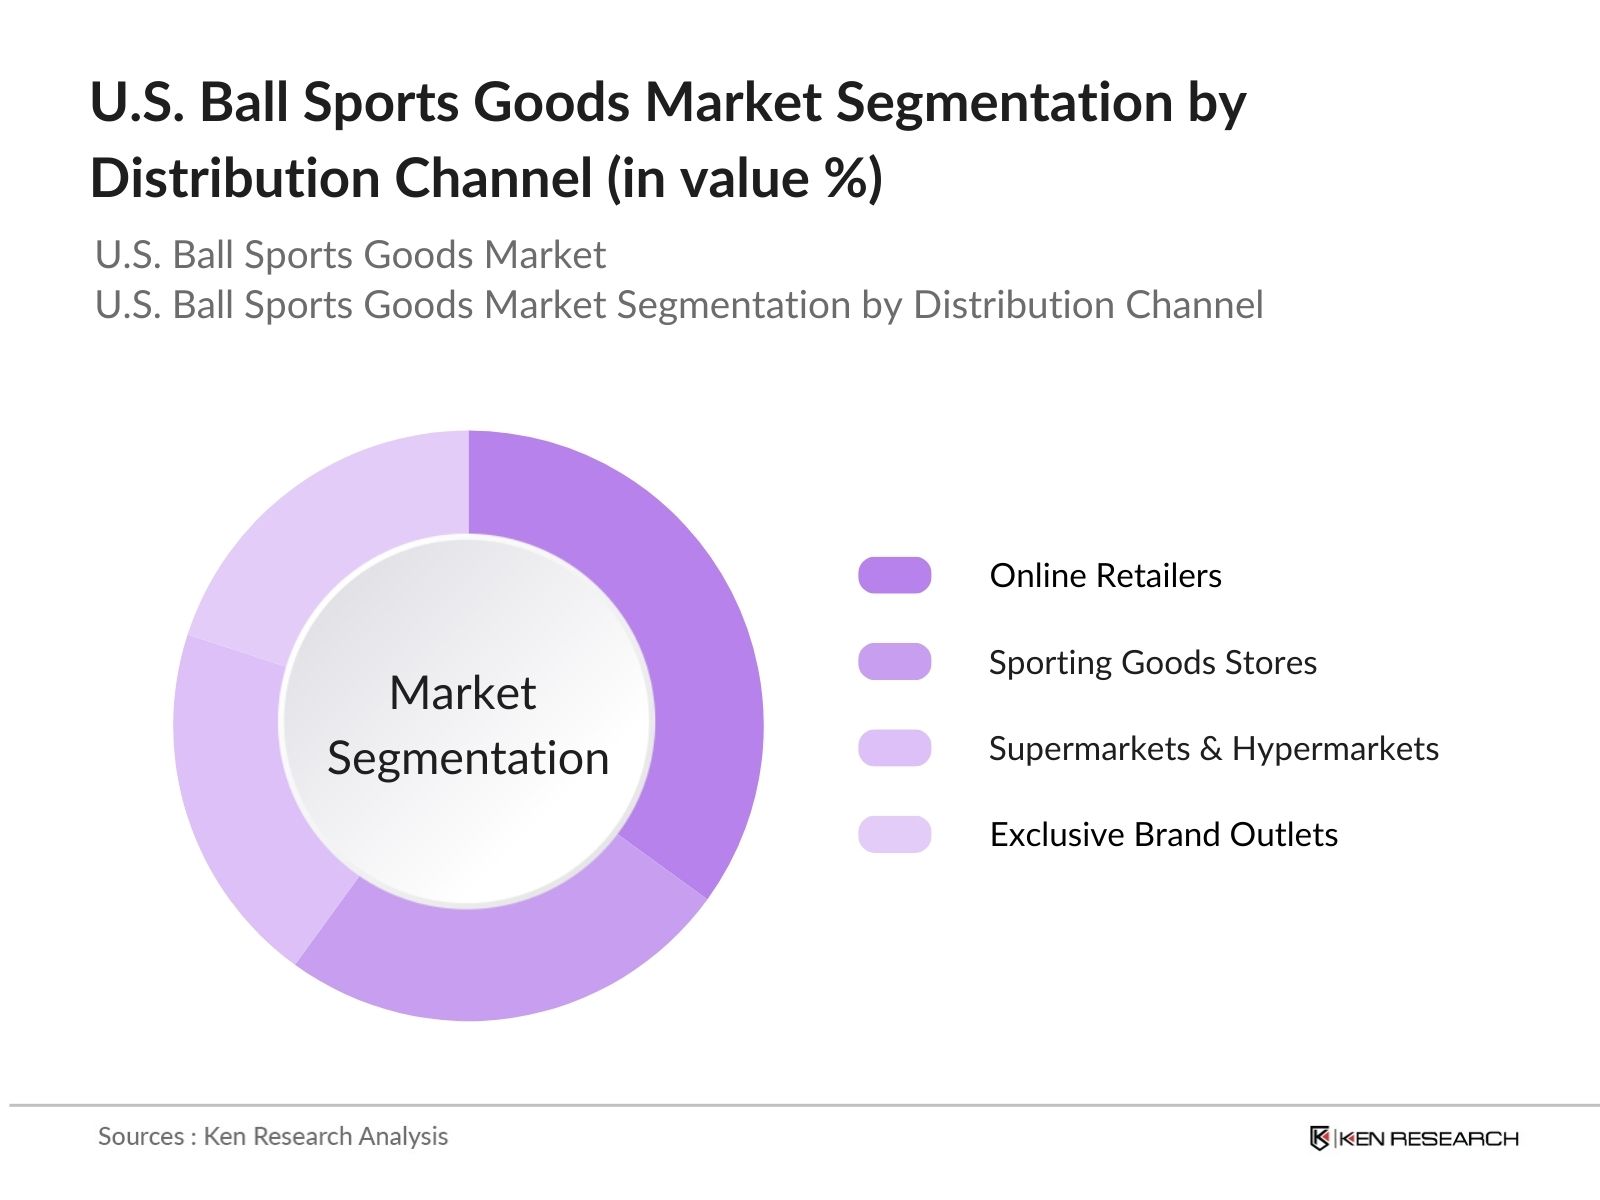
U.S. Ball Sports Goods Market Competitive Landscape
The U.S. Ball Sports Goods Market is dominated by well-established global and domestic brands, with key players such as Nike, Adidas, and Under Armour leading due to their strong brand loyalty, advanced R&D capabilities, and extensive distribution networks. This market concentration reflects the high competition within the sector, as these companies consistently innovate and expand their product offerings. 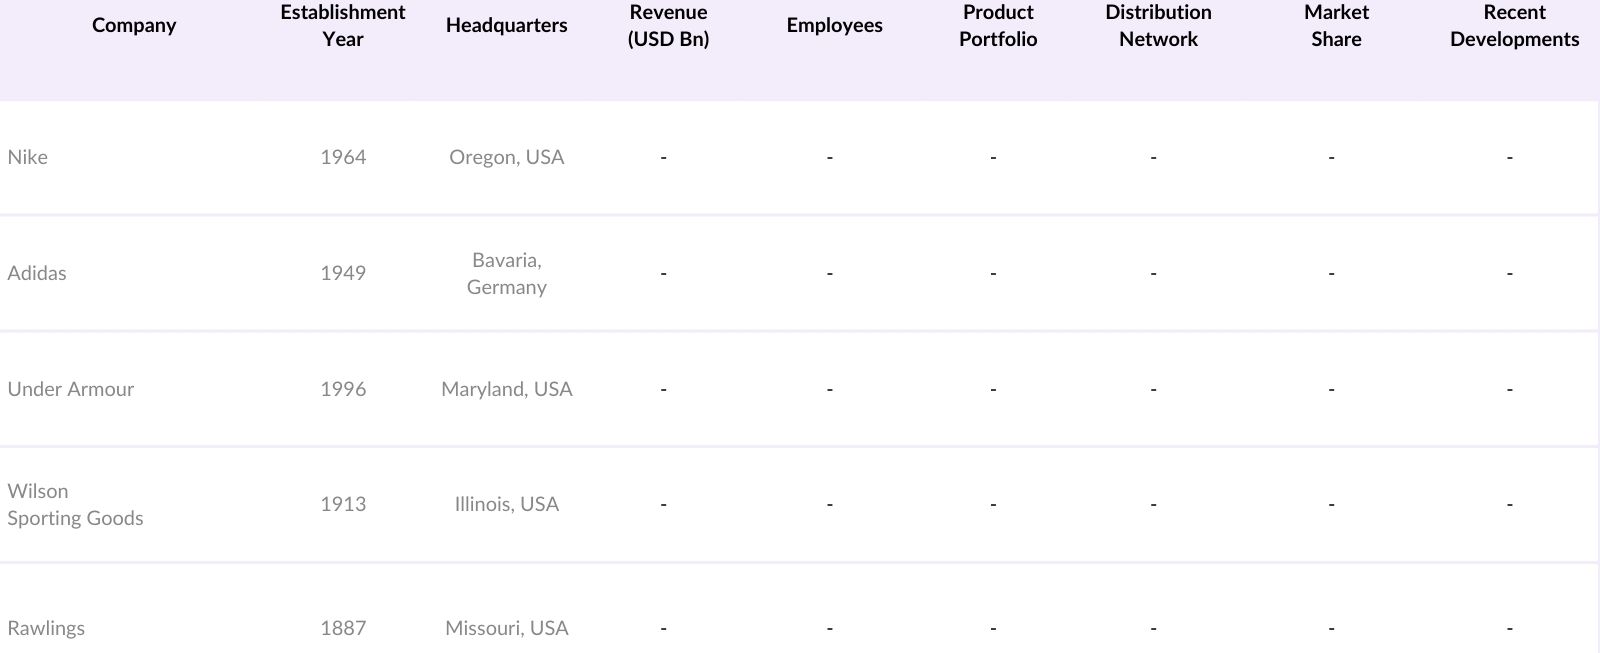
U.S. Ball Sports Goods Industry Analysis
Growth Drivers
- Rising Health and Fitness Awareness: The global push for healthier lifestyles is fueling demand for fitness products, especially in countries like the United States, where adult participation in fitness activities rose by 8 million people between 2022 and 2023, as reported by the CDC. This trend correlates with increasing healthcare spending, particularly in high-income countries where per capita health expenditure has reached $5,500 in 2024, indicating greater consumer spending on preventive health. The WHO has also noted that obesity rates are stabilizing in some regions due to improved fitness habits, further boosting market potential for health-driven sports products.
- Increasing Youth Participation in Sports: Youth participation in sports has seen substantial growth, particularly in emerging economies like India and Brazil. In India, government data shows that youth enrollment in sports programs has increased by 15% in the past two years, while sports participation in Brazil has reached 60 million young athletes as of 2024. These figures highlight a significant demand for sports equipment and apparel, especially with government-backed initiatives funding sports activities in schools and communities, further driving market demand.
- Expansion of E-commerce Platforms: The sports equipment industry is increasingly leveraging e-commerce, with online sales accounting for over 50% of all sports equipment purchases worldwide in 2024. This shift is particularly pronounced in Southeast Asia, where digital adoption has soared, resulting in over 400 million online shoppers across the region, as reported by the World Bank. Enhanced delivery logistics and digital payment solutions continue to support this e-commerce expansion, making sports products more accessible globally.
Market Challenges
- Intense Market Competition: The sports equipment market is highly competitive, with a growing number of domestic brands emerging in regions such as Southeast Asia and Eastern Europe. According to WTO data, the number of sports equipment manufacturers globally increased by 12% from 2022 to 2024, creating a crowded marketplace. This competitive environment pressures established brands to innovate and maintain price competitiveness while investing in advertising to retain market share, adding further operational costs.
- Seasonal Demand Fluctuations: The sports equipment industry experiences significant seasonal fluctuations, impacting supply chain stability. Demand for products such as winter sports equipment is highest in Q4 and Q1, while outdoor summer gear sees spikes in Q2 and Q3. According to the Bureau of Economic Analysis (BEA), seasonal factors contribute to inventory imbalances, resulting in up to 15% variance in production cycles each quarter, challenging manufacturers to maintain operational efficiency and stable workforce levels.
U.S. Ball Sports Goods Market Future Outlook
Over the next five years, the U.S. Ball Sports Goods Market is expected to witness substantial growth driven by rising youth participation in sports, consumer interest in wellness, and advancements in product materials. Continued innovation in sports equipment, along with an increased focus on sustainability, will shape the market dynamics. The shift towards e-commerce channels is expected to remain a significant trend, providing brands with a robust platform to reach a broader consumer base.
Future Market Opportunities
- Emerging Markets and Demographics: Emerging economies represent a significant growth opportunity, with increased spending on sports and fitness products. In 2024, the middle class in Africa and Asia reached 1.5 billion, according to World Bank data, indicating rising disposable incomes. This demographic shift increases demand for fitness and sports products, particularly in urban areas where sports participation is encouraged, signaling strong market growth potential in these regions.
- Integration of Smart Technologies: Smart technologies are increasingly integrated into sports equipment, with over 50 million smart fitness devices in circulation globally, according to OECD data for 2024. These devices include biometric sensors, GPS trackers, and AI-powered analysis tools that enhance athletic performance, creating new demand within the sports equipment sector. The push toward digital health and fitness platforms adds a valuable technological layer to the traditional market, setting the stage for robust future growth.
Scope of the Report
|
Segment |
Sub-segments |
|---|---|
|
By Sport |
- Basketball |
|
By Product Type |
- Equipment |
|
By Price Range |
- Mass |
|
By Distribution Channel |
- Online Retailers |
|
By Region |
- Northeast |
Products
Key Target Audience
Investors and Venture Capitalist Firms
Government and Regulatory Bodies (e.g., Consumer Product Safety Commission, Federal Trade Commission)
Sports Teams and Clubs
Online Retail Platforms
Sporting Goods Retailers
Professional and Amateur Sports Leagues
Manufacturers and Suppliers of Raw Materials
Environmental and Sustainability Agencies
Companies
Major Players
Nike, Inc.
Adidas AG
Under Armour, Inc.
PUMA SE
New Balance Athletics, Inc.
Columbia Sportswear Company
Mizuno Corporation
Callaway Golf Company
ANTA Sports Products Limited
lululemon athletica Inc.
ASICS Corporation
Amer Sports
Franklin Sports Inc.
Wilson Sporting Goods Co.
Rawlings Sporting Goods Company, Inc.
Table of Contents
Market Overview
1.1 Definition and Scope
1.2 Market Taxonomy
1.3 Market Growth Rate
1.4 Market Segmentation Overview
Market Size (USD Billion)
2.1 Historical Market Size
2.2 Year-On-Year Growth Analysis
2.3 Key Market Developments and Milestones
Market Analysis
3.1 Growth Drivers
3.1.1 Rising Health and Fitness Awareness
3.1.2 Increasing Youth Participation in Sports
3.1.3 Technological Advancements in Equipment
3.1.4 Expansion of E-commerce Platforms
3.2 Market Challenges
3.2.1 High Cost of Premium Products
3.2.2 Intense Market Competition
3.2.3 Seasonal Demand Fluctuations
3.3 Opportunities
3.3.1 Emerging Markets and Demographics
3.3.2 Sustainable and Eco-friendly Products
3.3.3 Integration of Smart Technologies
3.4 Trends
3.4.1 Customization and Personalization of Products
3.4.2 Growth of Women's Sports Segment
3.4.3 Collaborations with Professional Athletes
3.5 Government Regulations
3.5.1 Safety Standards and Compliance
3.5.2 Trade Policies and Tariffs
3.5.3 Environmental Regulations
3.6 SWOT Analysis
3.7 Stakeholder Ecosystem
3.8 Porter's Five Forces Analysis
3.9 Competitive Landscape
Market Segmentation
4.1 By Sport (Revenue Share %)
4.1.1 Basketball
4.1.2 Football/Soccer
4.1.3 Baseball
4.1.4 Volleyball
4.1.5 Golf
4.2 By Product Type (Revenue Share %)
4.2.1 Equipment
4.2.2 Apparel
4.2.3 Footwear
4.3 By Price Range (Revenue Share %)
4.3.1 Mass
4.3.2 Premium
4.4 By Distribution Channel (Revenue Share %)
4.4.1 Online Retailers
4.4.2 Sporting Goods Retailers
4.4.3 Supermarkets & Hypermarkets
4.4.4 Exclusive Brand Outlets
4.5 By Region (Revenue Share %)
4.5.1 Northeast
4.5.2 Midwest
4.5.3 South
4.5.4 West
Competitive Analysis
5.1 Detailed Profiles of Major Companies
5.1.1 Nike, Inc.
5.1.2 Adidas AG
5.1.3 Under Armour, Inc.
5.1.4 PUMA SE
5.1.5 New Balance Athletics, Inc.
5.1.6 Columbia Sportswear Company
5.1.7 Mizuno Corporation
5.1.8 Callaway Golf Company
5.1.9 ANTA Sports Products Limited
5.1.10 lululemon athletica Inc.
5.1.11 ASICS Corporation
5.1.12 Amer Sports
5.1.13 Franklin Sports Inc.
5.1.14 Wilson Sporting Goods Co.
5.1.15 Rawlings Sporting Goods Company, Inc.
5.2 Cross Comparison Parameters
5.2.1 Number of Employees
5.2.2 Headquarters Location
5.2.3 Year of Establishment
5.2.4 Revenue
5.2.5 Product Portfolio
5.2.6 Market Share
5.2.7 Recent Developments
5.2.8 Strategic Initiatives
5.3 Market Share Analysis
5.4 Strategic Initiatives
5.5 Mergers and Acquisitions
5.6 Investment Analysis
5.6.1 Venture Capital Funding
5.6.2 Government Grants
5.6.3 Private Equity Investments
Regulatory Framework
6.1 Industry Standards and Certifications
6.2 Compliance Requirements
6.3 Import and Export Regulations
Future Market Size (USD Billion)
7.1 Future Market Size Projections
7.2 Key Factors Driving Future Market Growth
Future Market Segmentation
8.1 By Sport (Revenue Share %)
8.2 By Product Type (Revenue Share %)
8.3 By Price Range (Revenue Share %)
8.4 By Distribution Channel (Revenue Share %)
8.5 By Region (Revenue Share %)
Analysts Recommendations
9.1 Total Addressable Market (TAM), Serviceable Available Market (SAM), and Serviceable Obtainable Market (SOM) Analysis
9.2 Customer Cohort Analysis
9.3 Marketing Initiatives
9.4 White Space Opportunity Analysis
Disclaimer Contact UsResearch Methodology
Step 1: Identification of Key Variables
The initial phase involved constructing an ecosystem map of the U.S. Ball Sports Goods Market, identifying stakeholders including manufacturers, suppliers, distributors, and retailers. This process utilized secondary databases and proprietary research to determine influential market variables.
Step 2: Market Analysis and Construction
This phase involved historical data analysis of the U.S. Ball Sports Goods Market. The dataset covered market size, key segments, and consumer preferences, analyzed to ensure accuracy in projected growth and current trends.
Step 3: Hypothesis Validation and Expert Consultation
Interviews with industry experts were conducted to validate hypotheses. Insights from experienced practitioners in various sports goods companies provided in-depth understanding of competitive and operational aspects.
Step 4: Research Synthesis and Final Output
Direct engagement with manufacturers and distributors provided concrete data on production and consumer behavior trends. This interaction complemented the bottom-up approach, leading to a validated analysis of the market landscape.
Frequently Asked Questions
01. How big is the U.S. Ball Sports Goods Market?
The U.S. Ball Sports Goods Market is valued at USD 3.35 billion, with continued growth driven by increased sports participation and the expansion of e-commerce platforms.
02. What are the major challenges in the U.S. Ball Sports Goods Market?
Challenges in the U.S. Ball Sports Goods Market nclude intense competition, seasonal demand fluctuations, and high production costs for premium goods, which impact profitability and market growth.
03. Who are the key players in the U.S. Ball Sports Goods Market?
Key players in the U.S. Ball Sports Goods Market include Nike, Adidas, Under Armour, Wilson Sporting Goods, and Rawlings, known for their product innovation, brand recognition, and extensive distribution networks.
04. What is driving the growth of the U.S. Ball Sports Goods Market?
Growth in the U.S. Ball Sports Goods Market is driven by factors such as youth sports programs, health awareness, and advancements in product technology, especially in durability and performance enhancements.
05. Which product type dominates the U.S. Ball Sports Goods Market?
The equipment segment dominates the U.S. Ball Sports Goods Market due to its essential role across sports, supported by advancements in materials that enhance durability and performance.
Why Buy From Us?
 Framework")
What makes us stand out is that our consultants follows Robust, Refine and Result (RRR) methodology. i.e. Robust for clear definitions, approaches and sanity checking, Refine for differentiating respondents facts and opinions and Result for presenting data with story

We have set a benchmark in the industry by offering our clients with syndicated and customized market research reports featuring coverage of entire market as well as meticulous research and analyst insights.

While we don't replace traditional research, we flip the method upside down. Our dual approach of Top Bottom & Bottom Top ensures quality deliverable by not just verifying company fundamentals but also looking at the sector and macroeconomic factors.

With one step in the future, our research team constantly tries to show you the bigger picture. We help with some of the tough questions you may encounter along the way: How is the industry positioned? Best marketing channel? KPI's of competitors? By aligning every element, we help maximize success.

Our report gives you instant access to the answers and sources that other companies might choose to hide. We elaborate each steps of research methodology we have used and showcase you the sample size to earn your trust.

If you need any support, we are here! We pride ourselves on universe strength, data quality, and quick, friendly, and professional service.