
U.S. Business Jet Market Outlook to 2030
Region:North America
Author(s):Sanjeev
Product Code:KROD10420
December 2024
97
About the Report
U.S. Business Jet Market Overview
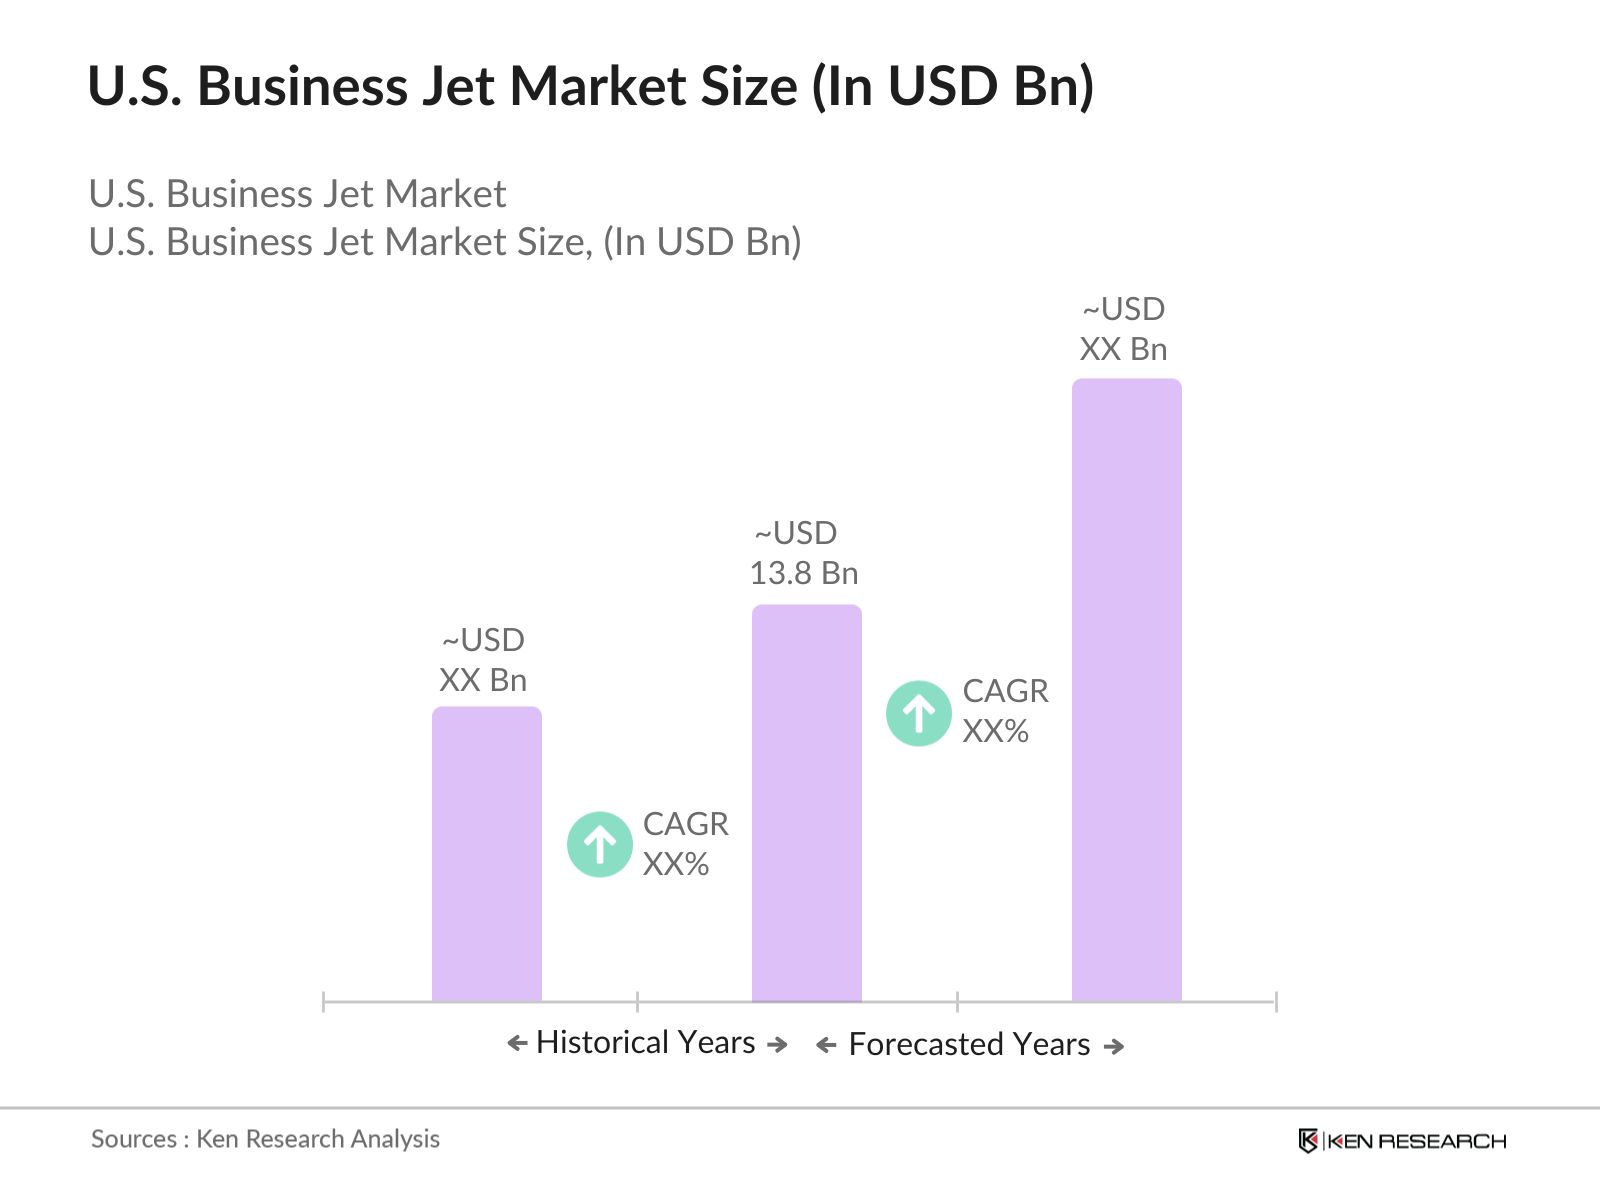
- The U.S. Business Jet market is valued at USD 13.8 billion, based on a five-year historical analysis. This growth is driven by increasing corporate profits and demand from high-net-worth individuals (HNWIs), who prefer private jet travel for both business and leisure purposes. Furthermore, the growing trend of on-demand jet services and fractional ownership models has fueled the expansion of the market. The rising number of millionaires and billionaires in the U.S. has been a significant driver, with the business jet market benefitting from the wealth accumulation and corporate demand for increased travel flexibility.
- The U.S. market is dominated by cities like New York, Los Angeles, and Miami, due to their significant concentration of wealth and strong demand from corporate sectors. New York is a hub for financial services, while Los Angeles and Miami serve the entertainment and tourism industries, which are heavy users of private jets. These cities also have access to private airports and excellent air infrastructure, making them ideal for business jet usage. Additionally, favorable tax policies and high demand for short-distance and transcontinental flights contribute to their dominance.
- The FAA plays a central role in regulating the U.S. business jet market. In 2023, the FAA introduced updated safety protocols requiring enhanced pilot training and stricter maintenance schedules for business jets. These regulations are designed to ensure the highest safety standards for operators, but they also impose additional costs on jet owners and operators. Compliance with FAA guidelines is mandatory for both private and commercial business jet operations, impacting operational efficiency and costs.
U.S. Business Jet Market Segmentation
The U.S. Business Jet market is segmented by aircraft type and by end-user.
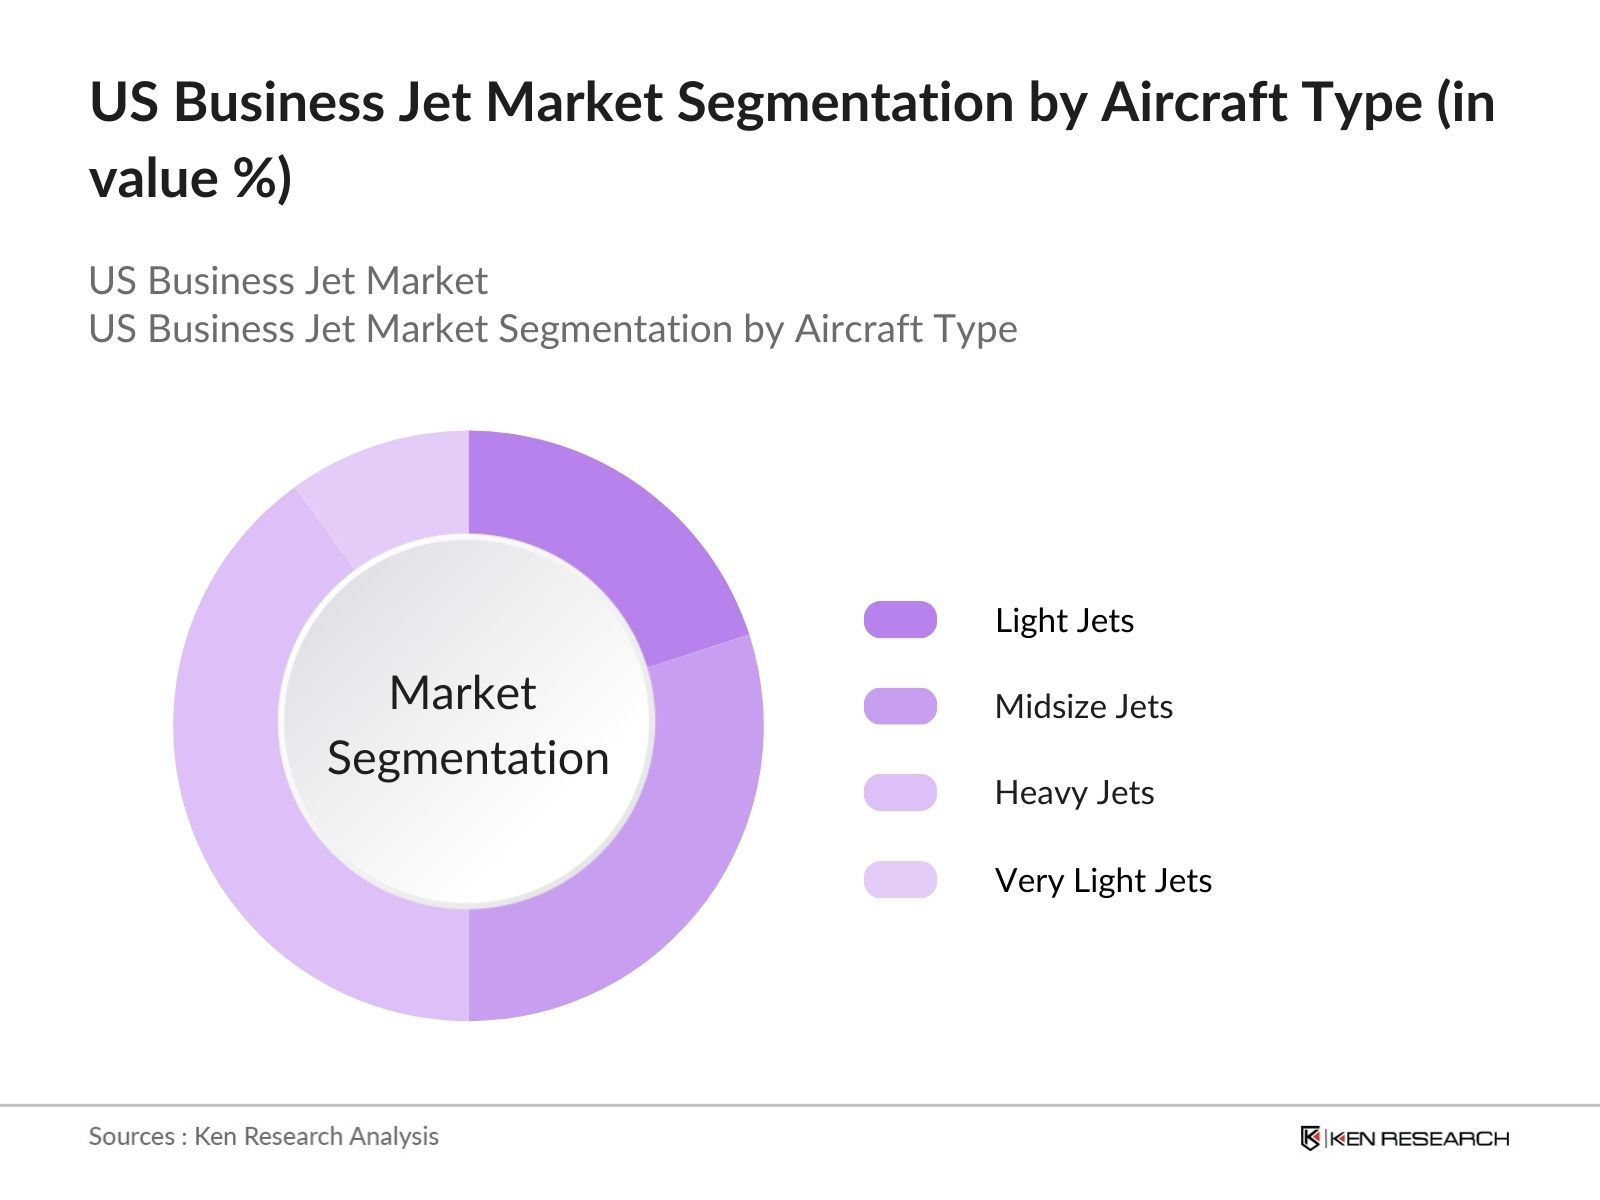
- By Aircraft Type: The U.S. Business Jet market is segmented by aircraft type into Light Jets, Midsize Jets, Heavy Jets, and Very Light Jets (VLJs). Among these, Heavy Jets hold a dominant market share in 2023, driven by their ability to offer long-range travel with superior comfort. Heavy jets are popular among corporate executives and large enterprises that require transcontinental and transoceanic flights. These jets provide enhanced cabin space, luxurious amenities, and advanced in-flight connectivity, which are highly valued in the business sector.
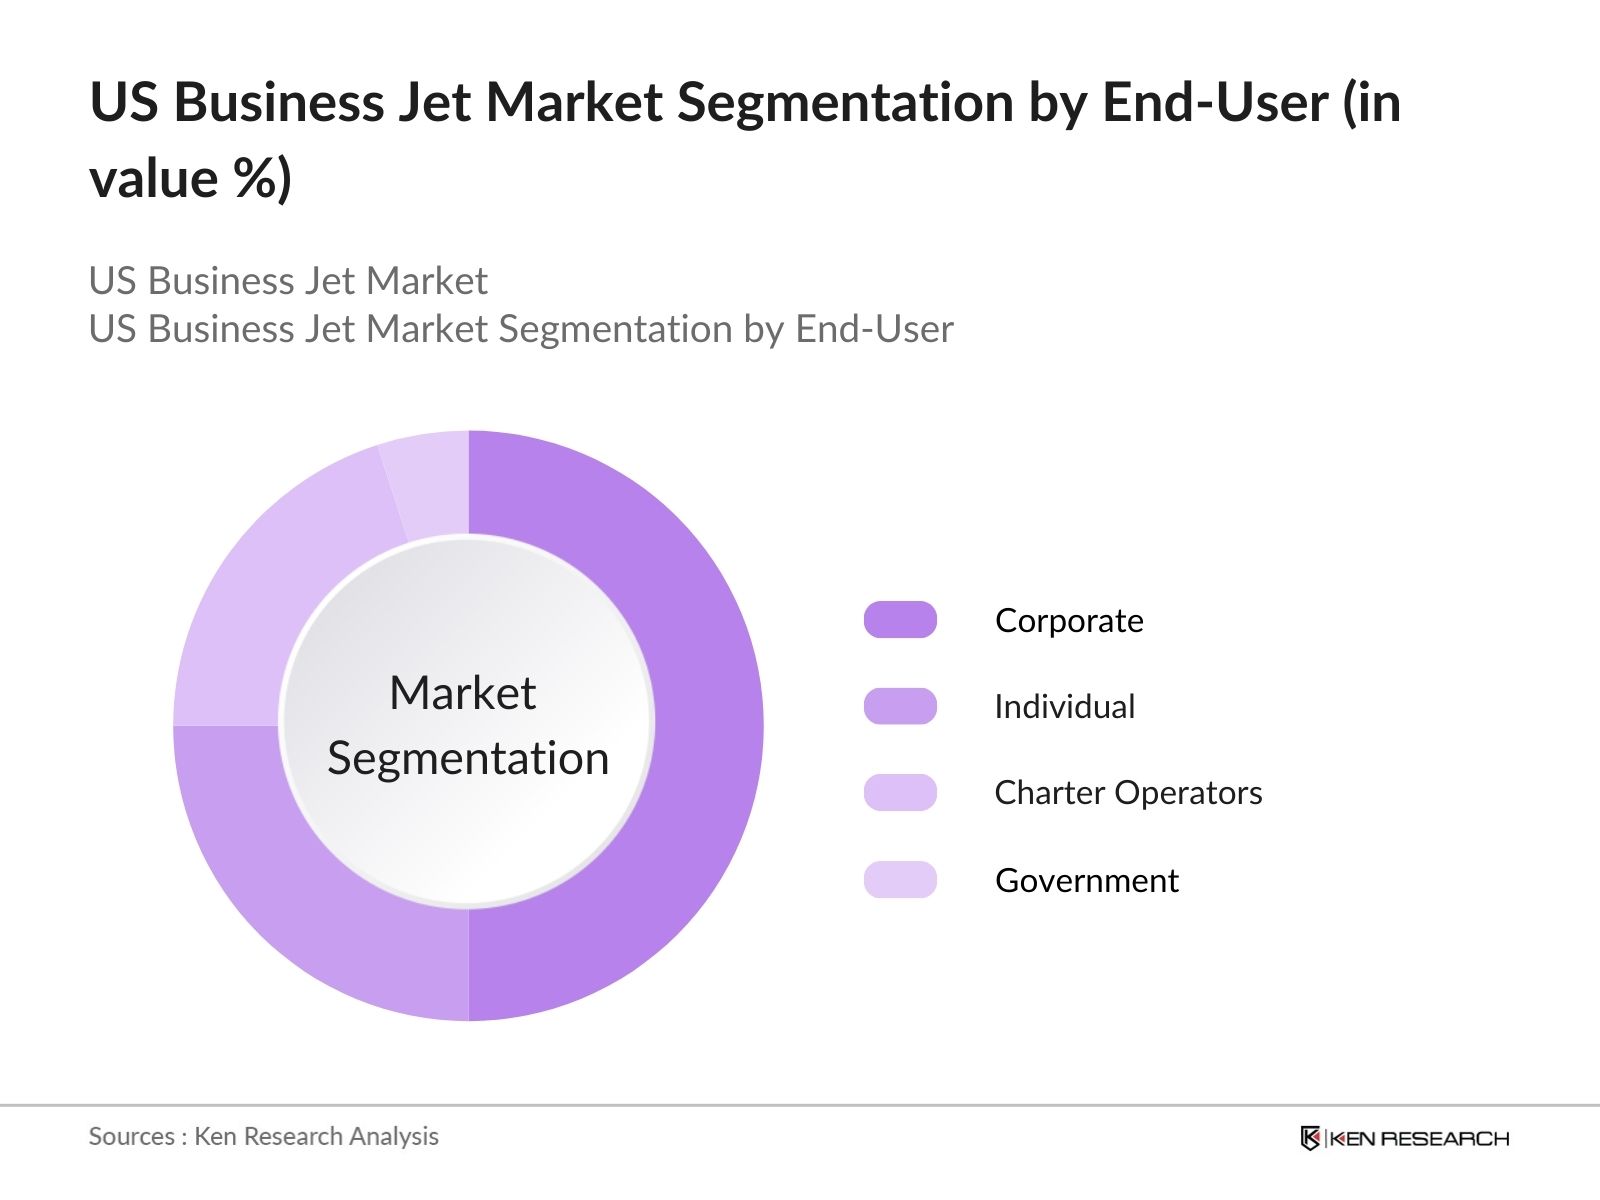
- By End-User: The U.S. Business Jet market is also segmented by end-user into Corporate, Individual, Charter Operators, and Government. The Corporate segment dominates the market share in 2023, primarily due to the increasing need for flexible and private travel options for business executives. Corporate jets are preferred for their ability to reduce travel time, provide a secure environment for business operations during flights, and ensure privacy and confidentiality for high-level executives.
U.S. Business Jet Market Competitive Landscape
The U.S. Business Jet market is highly competitive, with both domestic and international players vying for market share. Gulfstream Aerospace, Bombardier Aviation, and Textron Aviation (Cessna and Beechcraft) dominate the market due to their innovative product offerings, strong brand presence, and robust after-sales support. These companies invest heavily in research and development to stay ahead of the curve, focusing on fuel efficiency, range extension, and advanced avionics.
|
Company |
Establishment Year |
Headquarters |
Number of Employees |
Fleet Size |
Revenue (USD Bn) |
|
Gulfstream Aerospace |
1958 |
Savannah, GA |
|||
|
Bombardier Aviation |
1942 |
Montreal, Canada |
|||
|
Textron Aviation (Cessna) |
1927 |
Wichita, KS |
|||
|
Dassault Aviation |
1929 |
Paris, France |
|||
|
Embraer Executive Jets |
1969 |
So Paulo, Brazil |
U.S. Business Jet Industry Analysis
Growth Drivers
- Increasing Corporate Profits (Revenue Growth): Corporate profits in the U.S. have been rising steadily since 2022, which has contributed to increased demand for business jets. In 2023, corporate profits in the U.S. reached $2.75 trillion, driven by sectors like technology, finance, and healthcare, which often utilize business jets for corporate travel. Business jets provide time efficiency, privacy, and flexibility, making them valuable assets for companies managing cross-state or international operations. The rise in corporate profits supports increased capital expenditure on aviation, including the purchase of private jets.
- Demand from High-Net-Worth Individuals (HNWIs) (Individual Spending Capacity): In 2024, the U.S. is home to over 770,000 high-net-worth individuals (HNWIs), with a combined wealth exceeding $30 trillion. This wealth facilitates luxury spending, including private jet ownership and travel. HNWIs use business jets to optimize their travel time, maintain confidentiality, and gain access to remote or underserved airports. The purchasing power of HNWIs has increased in recent years, reflecting a growing demand for business jets for personal and business purposes, especially within investment banking, real estate, and tech sectors.
- Expanding Tourism Sector (Private Jet Usage for Leisure Travel): The U.S. tourism sector has shown resilience post-pandemic, with domestic travel reaching approximately 1.9 billion person-trips in 2023. High-end travelers, especially those utilizing luxury tourism services, increasingly opt for business jets to access private or exclusive destinations. This growth is particularly evident in destinations like Aspen, Palm Springs, and the Hamptons, were affluent travelers demand convenience and luxury. The growth of private jet usage for leisure purposes reflects the evolving tourism patterns, focusing on comfort, privacy, and exclusivity.
Market Challenges
- High Operating Costs (Fuel & Maintenance): The operating costs of business jets remain a significant barrier in 2024, driven largely by volatile fuel prices and increasing maintenance expenses. Jet fuel prices averaged $2.85 per gallon in 2023, up from previous years due to global supply chain disruptions and geopolitical tensions. Additionally, maintenance costs for advanced jets can run into hundreds of thousands of dollars annually. These high costs impact the profitability of business jet operations, particularly for smaller operators and fractional ownership models.
- Regulatory Restrictions (FAA Regulations): The U.S. business jet market is tightly regulated by the Federal Aviation Administration (FAA). In 2023, the FAA introduced new safety regulations that require additional inspections and certifications for business jets operating in high-traffic airspace. These regulations, while improving safety, increase operational complexity and costs for jet operators. Further, international operations are subject to stringent customs and immigration protocols, which create logistical challenges for operators.
U.S. Business Jet Market Future Outlook
The U.S. Business Jet market is expected to experience significant growth in the coming years, driven by increasing corporate demand for flexible travel options, innovations in sustainable aviation technology, and the rise of on-demand business jet services. With advancements in electric and hybrid aircraft technology, the market is poised to benefit from reduced operating costs and growing demand for eco-friendly options. The development of private jet infrastructure and airports will also support this growth, allowing greater access to business jet services across the country.
Market Opportunities
- Fractional Ownership Expansion (Business Model Innovation): Fractional ownership has gained popularity in the U.S. business jet market, offering more affordable access to private aviation. In 2023, the number of fractional ownership deals increased by 15%, driven by corporate clients and HNWIs seeking more flexible travel options without the full burden of ownership. Fractional ownership programs reduce upfront costs and operational expenses, allowing companies and individuals to access business jets without full capital expenditure. This model is expected to grow further as demand for private air travel remains strong.
- Sustainable Aviation Technologies (Electric and Hybrid Jets): Sustainable aviation has gained momentum, with U.S.-based companies investing heavily in electric and hybrid jet technologies. In 2023, the U.S. government allocated over $200 million to research and development in sustainable aviation technologies, reflecting the aviation industrys efforts to reduce its carbon footprint. Although full commercial deployment is in its early stages, the development of hybrid-electric business jets represents a long-term opportunity for growth. These technologies promise reduced operating costs and environmental impacts, appealing to environmentally conscious clients.
Scope of the Report
|
Light Jets Midsize Jets Heavy Jets Very Light Jets (VLJs) |
|
|
By Range |
Short Range (<2,500 nautical miles) Mid-Range (2,500 - 5,000 nautical miles) Long Range (>5,000 nautical miles) |
|
By End-User |
Corporate Individual Charter Operators Government |
|
By Ownership Type |
Full Ownership Fractional Ownership Jet Card Programs |
|
By Region |
North East West South |
Products
Key Target Audience
Corporate Executives and Business Leaders
Private Jet Operators
High-Net-Worth Individuals (HNWIs)
Luxury Tourism Operators
Charter Operators
Government and Regulatory Bodies (FAA, ITAR)
Investments and Venture Capitalist Firms
Private Jet Maintenance and Repair Companies
Companies
Players Mention in the Report:
Gulfstream Aerospace
Bombardier Aviation
Textron Aviation (Cessna and Beechcraft)
Dassault Aviation
Embraer Executive Jets
Boeing Business Jets (BBJ)
Airbus Corporate Jets (ACJ)
Honda Aircraft Company
NetJets Inc.
VistaJet
Flexjet
Wheels Up
Jet Aviation
Clay Lacy Aviation
XOJet
Table of Contents
1. U.S. Business Jet Market Overview
1.1. Definition and Scope
1.2. Market Taxonomy
1.3. Market Growth Rate
1.4. Market Segmentation Overview
2. U.S. Business Jet Market Size (In USD Bn)
2.1. Historical Market Size
2.2. Year-On-Year Growth Analysis
2.3. Key Market Developments and Milestones
3. U.S. Business Jet Market Analysis
3.1. Growth Drivers
3.1.1. Increasing Corporate Profits (Revenue Growth)
3.1.2. Demand from High-Net-Worth Individuals (HNWIs) (Individual Spending Capacity)
3.1.3. Expanding Tourism Sector (Private Jet Usage for Leisure Travel)
3.1.4. Technological Advancements (Aerospace Innovation)
3.2. Market Challenges
3.2.1. High Operating Costs (Fuel & Maintenance)
3.2.2. Regulatory Restrictions (FAA Regulations)
3.2.3. Pilot Shortages (Skilled Workforce Constraints)
3.3. Opportunities
3.3.1. Fractional Ownership Expansion (Business Model Innovation)
3.3.2. Sustainable Aviation Technologies (Electric and Hybrid Jets)
3.3.3. Increasing Usage of Private Airports (Infrastructure Growth)
3.4. Trends
3.4.1. On-Demand Business Jet Services (Uberization of Jets)
3.4.2. Advancements in Jet Connectivity (Wi-Fi) (In-Flight Technologies)
3.4.3. Sustainability Initiatives (Adoption of Biofuels)
3.5. Government Regulation
3.5.1. Federal Aviation Administration (FAA) Guidelines
3.5.2. Tax Benefits for Aircraft Purchases (Section 179 Deduction)
3.5.3. International Trade Regulations (ITAR) (Jet Exports)
3.6. SWOT Analysis
3.7. Stakeholder Ecosystem
3.8. Porters Five Forces
3.9. Competitive Landscape
4. U.S. Business Jet Market Segmentation
4.1. By Aircraft Type (In Value %)
4.1.1. Light Jets
4.1.2. Midsize Jets
4.1.3. Heavy Jets
4.1.4. Very Light Jets (VLJs)
4.2. By Range (In Value %)
4.2.1. Short Range (Less than 2,500 nautical miles)
4.2.2. Mid Range (2,500 - 5,000 nautical miles)
4.2.3. Long Range (More than 5,000 nautical miles)
4.3. By End-User (In Value %)
4.3.1. Corporate
4.3.2. Individual
4.3.3. Charter Operators
4.3.4. Government
4.4. By Ownership Type (In Value %)
4.4.1. Full Ownership
4.4.2. Fractional Ownership
4.4.3. Jet Card Programs
4.5. By Region (In Value %)
4.5.1. Northeast
4.5.2. Southeast
4.5.3. Midwest
4.5.4. West Coast
5. U.S. Business Jet Market Competitive Analysis
5.1. Detailed Profiles of Major Companies
5.1.1. Gulfstream Aerospace
5.1.2. Bombardier Aviation
5.1.3. Dassault Aviation
5.1.4. Embraer Executive Jets
5.1.5. Textron Aviation (Cessna & Beechcraft)
5.1.6. Honda Aircraft Company
5.1.7. Boeing Business Jets (BBJ)
5.1.8. Airbus Corporate Jets (ACJ)
5.1.9. NetJets Inc.
5.1.10. VistaJet
5.1.11. Flexjet
5.1.12. Wheels Up
5.1.13. Jet Aviation
5.1.14. Clay Lacy Aviation
5.1.15. XOJet
5.2. Cross Comparison Parameters
Number of Employees
Headquarters
Year of Inception
Revenue
Fleet Size
Range Capability
Market Share (In %)
Business Model
5.3. Market Share Analysis
5.4. Strategic Initiatives
5.5. Mergers and Acquisitions
5.6. Investment Analysis
5.7. Private Equity Investments
5.8. Government Funding Programs
6. U.S. Business Jet Market Regulatory Framework
6.1. FAA Regulations
6.2. Environmental Compliance Standards (Emissions Regulations)
6.3. Certification Processes for New Aircraft
6.4. Tax Regulations Impacting Ownership
7. U.S. Business Jet Market Future Size (In USD Bn)
7.1. Future Market Size Projections
7.2. Key Factors Driving Future Growth (Sustainability, New Entrants)
8. U.S. Business Jet Future Market Segmentation
8.1. By Aircraft Type (In Value %)
8.2. By Range (In Value %)
8.3. By End-User (In Value %)
8.4. By Ownership Type (In Value %)
8.5. By Region (In Value %)
9. U.S. Business Jet Market Analysts Recommendations
9.1. TAM/SAM/SOM Analysis
9.2. Customer Cohort Analysis
9.3. Marketing Initiatives
9.4. White Space Opportunity Analysis
Disclaimer Contact UsResearch Methodology
Step 1: Identification of Key Variables
The initial phase involves constructing an ecosystem map encompassing all major stakeholders within the U.S. Business Jet market. Extensive desk research was conducted to identify and define the critical variables such as fleet size, operating costs, and range capability that influence market dynamics.
Step 2: Market Analysis and Construction
In this phase, historical data on business jet deliveries, utilization rates, and service providers were compiled. An evaluation of business jet penetration within corporate sectors and high-net-worth individuals was conducted to ensure the accuracy of revenue estimates.
Step 3: Hypothesis Validation and Expert Consultation
Market hypotheses were developed and validated through interviews with industry experts from jet manufacturers, charter operators, and corporate buyers. These consultations provided valuable insights into operational challenges and market trends.
Step 4: Research Synthesis and Final Output
Engagement with business jet operators and manufacturers helped refine the market analysis. Insights from these interviews were synthesized to ensure a comprehensive, validated analysis of the U.S. Business Jet market.
Frequently Asked Questions
01. How big is the U.S. Business Jet Market?
The U.S. Business Jet market, valued at USD 13.8 billion, is driven by increasing demand from corporate sectors and high-net-worth individuals seeking flexible and private travel options.
02. What are the challenges in the U.S. Business Jet Market?
Key challenges in U.S. Business Jet market include high operating costs, stringent FAA regulations, and a shortage of skilled pilots, which can limit the growth potential of the market.
03. Who are the major players in the U.S. Business Jet Market?
Major players in U.S. Business Jet market include Gulfstream Aerospace, Bombardier Aviation, Textron Aviation, Dassault Aviation, and Embraer Executive Jets, dominating due to their innovative offerings and strong after-sales service.
04. What are the growth drivers of the U.S. Business Jet Market?
The U.S. Business Jet market is propelled by the increasing wealth of high-net-worth individuals, corporate demand for private jet services, and innovations in aircraft technology, including sustainable aviation solutions.
05. What trends are shaping the U.S. Business Jet Market?
Key trends in U.S. Business Jet market include the rise of fractional ownership models, advancements in jet connectivity, and the push towards sustainable aviation, including the use of biofuels and electric jets.
Why Buy From Us?
 Framework")
What makes us stand out is that our consultants follows Robust, Refine and Result (RRR) methodology. i.e. Robust for clear definitions, approaches and sanity checking, Refine for differentiating respondents facts and opinions and Result for presenting data with story

We have set a benchmark in the industry by offering our clients with syndicated and customized market research reports featuring coverage of entire market as well as meticulous research and analyst insights.

While we don't replace traditional research, we flip the method upside down. Our dual approach of Top Bottom & Bottom Top ensures quality deliverable by not just verifying company fundamentals but also looking at the sector and macroeconomic factors.

With one step in the future, our research team constantly tries to show you the bigger picture. We help with some of the tough questions you may encounter along the way: How is the industry positioned? Best marketing channel? KPI's of competitors? By aligning every element, we help maximize success.

Our report gives you instant access to the answers and sources that other companies might choose to hide. We elaborate each steps of research methodology we have used and showcase you the sample size to earn your trust.

If you need any support, we are here! We pride ourselves on universe strength, data quality, and quick, friendly, and professional service.