Ken Research Logo

U.S. Chemical Distribution Market Outlook to 2030

Region:North America

Author(s):Sanjeev

Product Code:KROD527

Published On

November 2024

Total pages

87

About the Report

U.S. Chemical Distribution Market Overview

  • The U.S. chemical distribution market is valued at USD 28.03 billion, driven by increasing demand from downstream sectors such as pharmaceuticals, agriculture, automotive, and electronics. The market's growth is further supported by the rise in specialty chemicals, which cater to more niche applications. Additionally, distribution channels are evolving with a shift toward digital platforms, improving supply chain efficiency and expanding reach.
  • Key cities such as Houston, Texas, and New York dominate the U.S. chemical distribution market. Houston benefits from its proximity to major petrochemical plants and the Gulf Coast, a central hub for oil and gas, which makes it a key area for distribution. Meanwhile, New York leads due to its strong presence in the pharmaceutical and healthcare sectors, making it a prime location for chemical distributors focusing on specialty and life sciences chemicals.
  • U.S. chemical distributors must comply with stringent safety regulations from agencies like OSHA and the EPA, which govern the handling and distribution of hazardous materials. In 2023, OSHA reported over 4,000 chemical safety violations, highlighting the strict oversight in this sector. The EPAs Risk Management Program requires distributors handling large quantities of hazardous chemicals to implement risk management plans, impacting nearly 12,000 facilities across the U.S. These regulatory frameworks ensure the safety of chemical distribution but also increase operational costs, as companies must invest in safety equipment, training, and compliance measures.

market overviews

U.S. Chemical Distribution Market Segmentation

The U.S. chemical distribution market is segmented by product type and by end-use industry.

  • By Product Type: The market is segmented by product type into basic chemicals, specialty chemicals, and commodities. Specialty chemicals hold the dominant market share due to their application in various end-use industries like healthcare, automotive, and electronics. The increasing demand for high-performance chemicals and sustainable solutions has driven the focus on specialty chemicals. Brands like Brenntag and Univar Solutions have capitalized on this shift by expanding their product portfolios to meet customer needs for more specialized chemical products.market overviews
  • By End-Use Industry: The market is segmented into pharmaceuticals, agriculture, automotive, electronics, and construction. Pharmaceuticals dominate the end-use industry segment due to the rising demand for high-quality chemicals used in drug manufacturing and research. The industrys strict regulatory environment requires a reliable supply of chemicals, leading distributors to focus heavily on quality, safety, and consistent delivery. Distributors with strong connections in the pharmaceutical sector, such as IMCD US and Barentz, have established a competitive edge.market overviews

U.S. Chemical Distribution Market Competitive Landscape

The U.S. chemical distribution market is dominated by a few key players, including global and domestic distributors. Companies like Brenntag, Univar Solutions, and IMCD have established strong market positions through their vast distribution networks, comprehensive product portfolios, and deep industry relationships. The competitive landscape is characterized by ongoing consolidation, with several mergers and acquisitions shaping the industry. These key players are leveraging their scale to offer innovative solutions and meet the growing demand for specialty chemicals.

Company Name

Establishment Year

Headquarters

Revenue

No. of Employees

Industry Focus

Brenntag North America

1874

Essen, Germany


Univar Solutions

1924

Downers Grove, IL, USA


IMCD US

1995

Rotterdam, Netherlands


Helm U.S. Corporation

1900

Hamburg, Germany


Barentz North America

1953

Hoofddorp, Netherlands


U.S. Chemical Distribution Industry Analysis

Market Growth Drivers

  • Rising Demand in End-Use Industries (Pharmaceuticals, Agriculture, Automotive): The U.S. chemical distribution market is impacted by rising demand across key end-use industries like pharmaceuticals, agriculture, and automotive. The U.S. pharmaceutical industry, valued at $1.42 trillion in 2022, is a major driver of demand for chemical raw materials. The automotive industry, recovering after supply chain disruptions, produced 8.8 million vehicles in 2023, fueling demand for automotive chemicals. In agriculture, the U.S. exported $196.6 billion worth of agricultural products in 2022, with chemical inputs like fertilizers and pesticides playing a crucial role. This steady demand ensures consistent distribution requirements across these industries.
  • Expansion of Specialty Chemicals: The specialty chemicals sector is expanding rapidly, with the U.S. specialty chemicals market reaching new heights due to its role in industries like personal care, electronics, and construction. In 2022, the U.S. produced $328 billion worth of specialty chemicals, contributing to around 40% of the global market. These chemicals, which require tailored distribution networks, are increasingly in demand due to the growing trend of customized, high-performance chemical solutions across various industries. This demand has stimulated the chemical distribution sector, which manages complex supply chains for these niche products.
  • Strategic Partnerships and M&A: Strategic partnerships and mergers and acquisitions (M&A) have been integral to growth within the U.S. chemical distribution market. In 2023, over $90 billion worth of M&A deals were executed in the U.S. chemical sector, as companies consolidated their supply chains and broadened distribution networks. These alliances help distributors enhance their logistical capabilities and market reach, particularly in fast-growing sectors such as green chemicals and biotechnology. Such partnerships also increase efficiency, allowing distributors to offer an expanded range of chemicals to various industries.

Market Challenges

  • Rising Transportation Costs: Transportation costs have become a major challenge for the U.S. chemical distribution market, driven by increasing fuel prices and supply chain bottlenecks. In 2023, U.S. diesel fuel prices averaged $4.10 per gallon, impacting the cost of transporting chemicals, which are often classified as hazardous and require specialized logistics. Additionally, shipping container costs have increased since 2021 due to global supply chain issues, with U.S. importers paying up to $9,000 per 40-foot container in 2023, compared to $1,500 in pre-pandemic years. These rising costs squeeze profit margins for distributors.
  • Stringent Environmental Regulations: U.S. chemical distributors face increasing regulatory scrutiny, particularly considering environmental protection laws. The U.S. Environmental Protection Agency (EPA) has intensified enforcement of the Toxic Substances Control Act (TSCA), which regulates chemicals in commerce. In 2023, the EPA proposed restrictions on the production and distribution of per- and polyfluoroalkyl substances (PFAS), affecting over 12,000 chemicals. Compliance with these stringent regulations increases operational costs for distributors, as they must invest in environmentally compliant storage and transportation solutions. This regulatory landscape adds pressure on the chemical distribution industry to balance safety and profitability.

U.S. Chemical Distribution Market Future Outlook

Over the next five years, the U.S. chemical distribution market is expected to witness growth, driven by advances in digital supply chains, the growing demand for specialty chemicals, and evolving environmental regulations. The ongoing digital transformation is expected to improve operational efficiencies for distributors, while sustainability trends will push for greener chemical solutions, which will further boost market demand.

Market Opportunities

  • Digital Transformation of Supply Chains: The digital transformation of supply chains presents a key opportunity for chemical distributors in the U.S. market. In 2023, 78% of chemical companies reported increased investments in digital supply chain solutions like blockchain, automation, and IoT-enabled tracking systems. These technologies enable real-time monitoring of chemical shipments, reducing delays and increasing transparency in distribution. With U.S. businesses spending $350 billion on digital supply chain technologies, chemical distributors stand to gain by integrating these innovations, improving efficiency, reducing human error, and enhancing customer satisfaction in a highly competitive market.
  • Development of Sustainable Chemical Solutions: Sustainability is becoming a major focus in the U.S. chemical distribution market, driven by both regulatory pressures and consumer demand. In 2023, over 25% of U.S. chemical companies reported prioritizing the distribution of sustainable chemical solutions, such as biodegradable plastics and bio-based chemicals. This shift aligns with broader government initiatives like the Inflation Reduction Act, which allocates $370 billion to clean energy projects, further driving demand for green chemicals. Distributors who capitalize on sustainable offerings can leverage this growing trend, benefiting from government incentives and meeting the needs of environmentally conscious industries.

Scope of the Report

By Product Type

Basic Chemicals

Specialty Chemicals

Commodities

By End-Use Industry

Pharmaceuticals

Agriculture

Automotive

Electronics

By Distribution Channel

Direct Distribution

Third-Party Distribution

By Company Size

Large Enterprises

Small and Medium Enterprises (SMEs)

By Region

North

East

West

South

Products

Key Target Audience

  • Chemical Manufacturers

  • Pharmaceuticals and Life Sciences Companies

  • Automotive Component Manufacturers

  • Electronics and Semiconductor Manufacturers

  • Construction Material Producers

  • Agriculture Input Suppliers

  • Banks and Financial Institutes

  • Investment and Venture Capital Firms

  • Government and Regulatory Bodies (EPA, OSHA, FDA)

Companies

Players Mention in the Report:

  • Brenntag North America

  • Univar Solutions

  • Helm U.S. Corporation

  • IMCD US

  • Barentz North America

  • Nexeo Solutions

  • Caldic

  • ChemGroup

  • Maroon Group

  • Chemisphere

  • Azelis Americas

  • Hawkins Inc.

  • Tarr LLC

  • PVS Chemicals

  • Cornelius Group

Table of Contents

1. U.S. Chemical Distribution Market Overview

1.1. Definition and Scope
1.2. Market Taxonomy
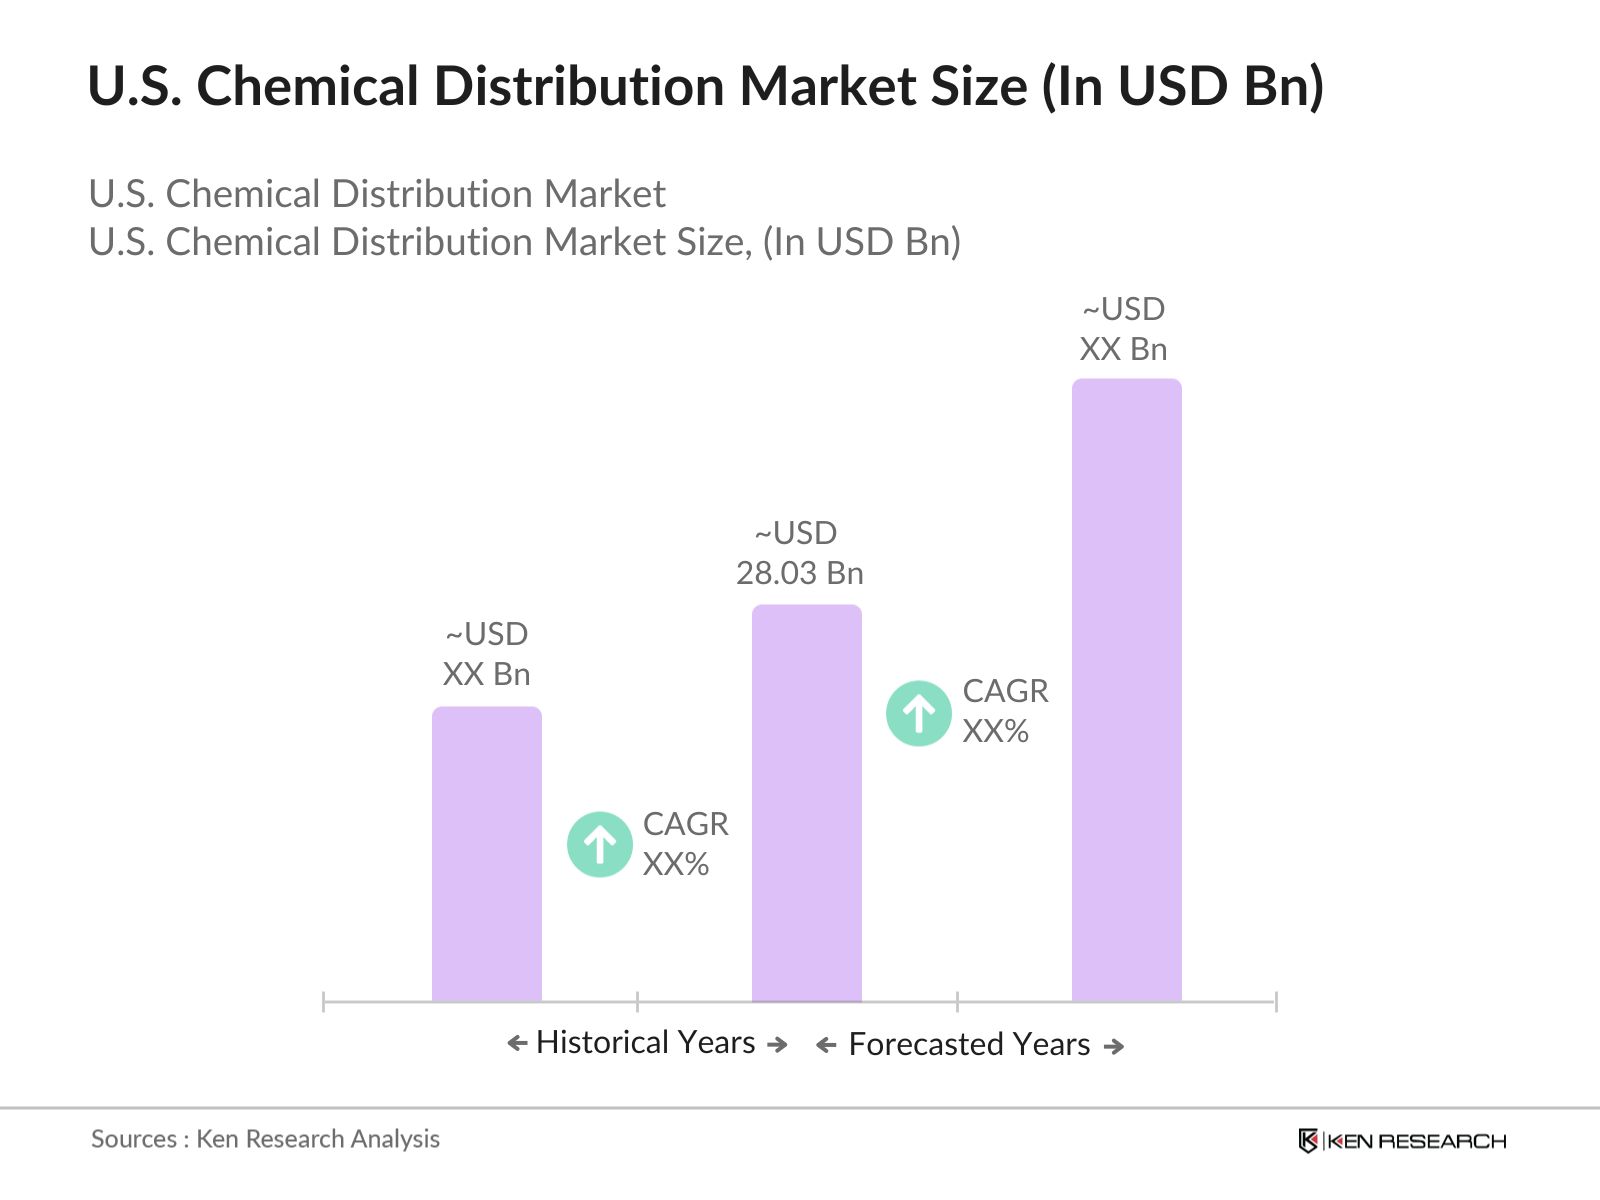
1.3. Market Growth Rate
1.4. Market Segmentation Overview

2. U.S. Chemical Distribution Market Size (In USD Bn)

2.1. Historical Market Size
2.2. Year-On-Year Growth Analysis
2.3. Key Market Developments and Milestones

3. U.S. Chemical Distribution Market Analysis

3.1. Growth Drivers (Supply Chain Efficiencies, Increasing Demand in Downstream Sectors)
3.1.1. Rising Demand in End-Use Industries (Pharmaceuticals, Agriculture, Automotive)
3.1.2. Expansion of Specialty Chemicals
3.1.3. Strategic Partnerships and M&A
3.2. Market Challenges (Pricing Volatility, Regulatory Pressure)
3.2.1. Rising Transportation Costs
3.2.2. Stringent Environmental Regulations
3.2.3. Supply Chain Disruptions
3.3. Opportunities (Growth in E-Commerce, Technological Integration in Distribution)
3.3.1. Digital Transformation of Supply Chains
3.3.2. Development of Sustainable Chemical Solutions
3.3.3. Green Chemistry and Circular Economy Initiatives
3.4. Trends (Automation, Consolidation in the Industry)
3.4.1. Adoption of AI and Machine Learning in Distribution Networks
3.4.2. Consolidation of Major Distributors
3.4.3. Shifting Focus to Specialty Chemicals
3.5. Government Regulations (Hazardous Material Handling, Trade Tariffs)
3.5.1. Chemical Safety Regulations (OSHA, EPA)
3.5.2. Import/Export Compliance and Tariffs
3.5.3. Industry-Specific Regulations (FDA, FIFRA)
3.6. SWOT Analysis
3.7. Value Chain and Stakeholder Ecosystem
3.8. Porters Five Forces
3.9. Competitive Landscape and Ecosystem

4. U.S. Chemical Distribution Market Segmentation

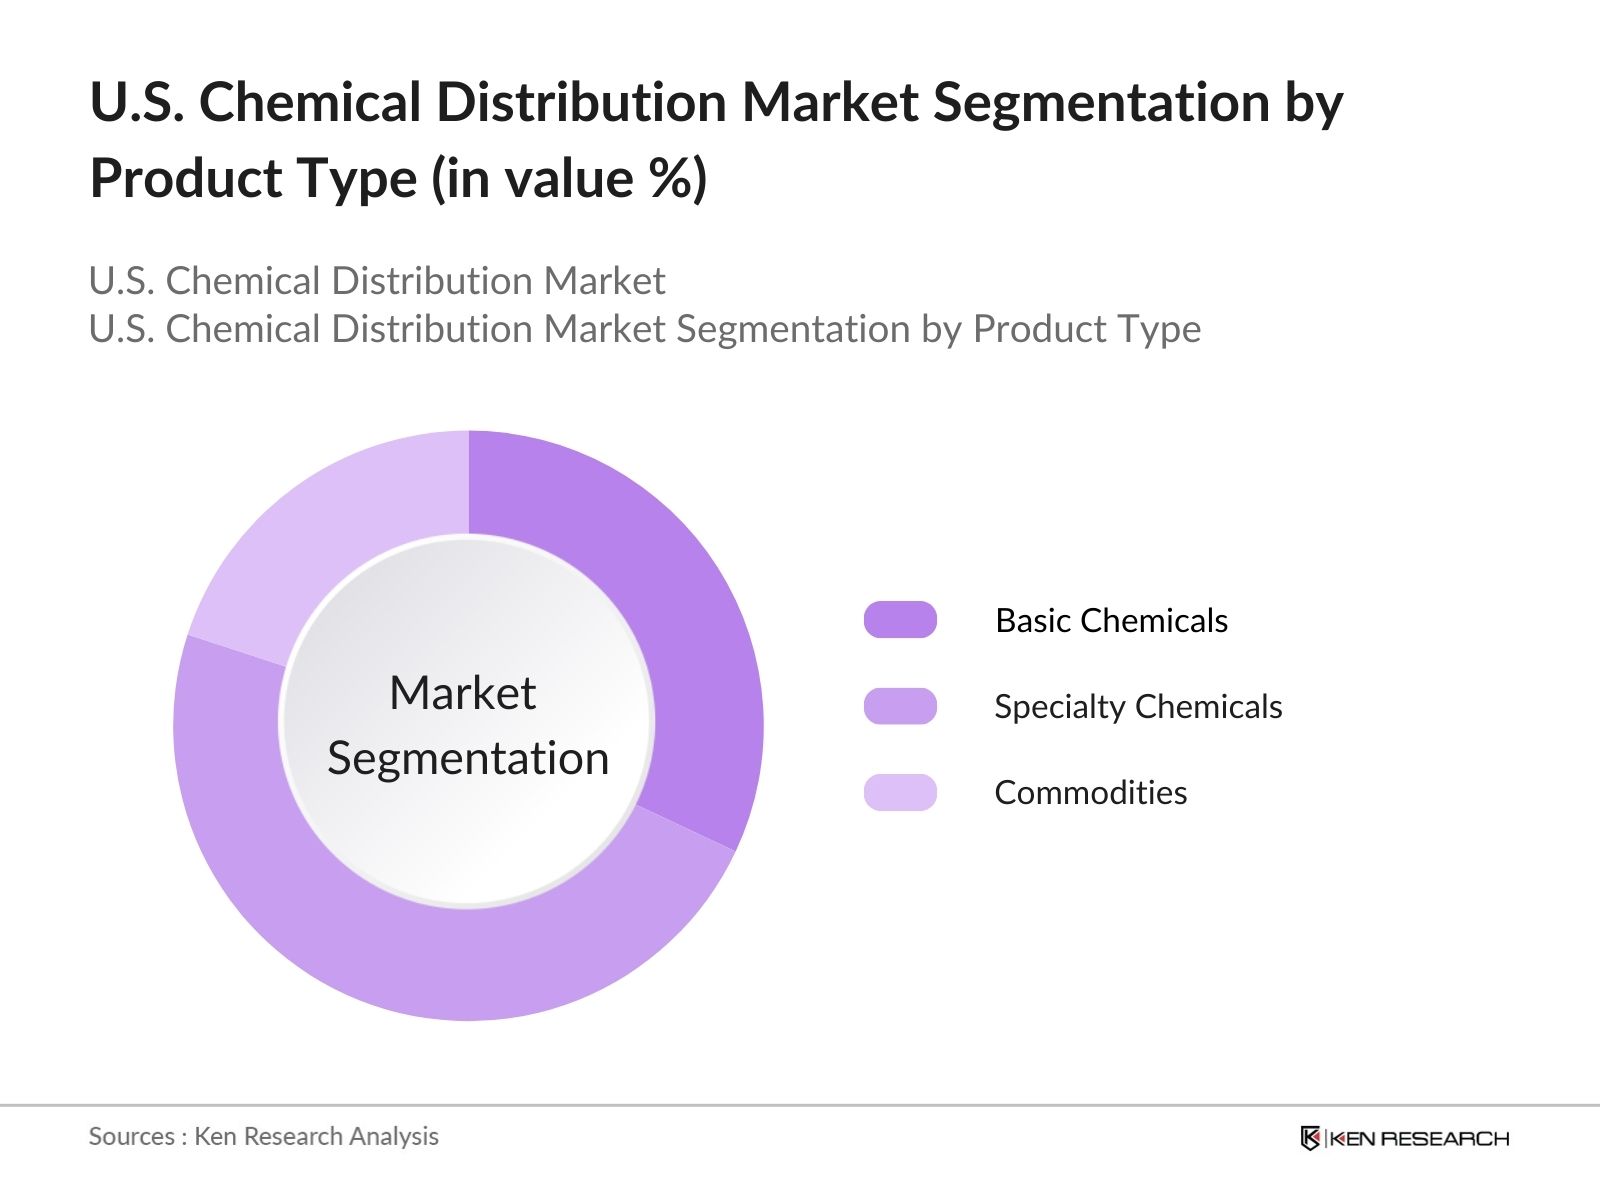
4.1. By Product Type (In Value %)
4.1.1. Basic Chemicals
4.1.2. Specialty Chemicals
4.1.3. Commodities
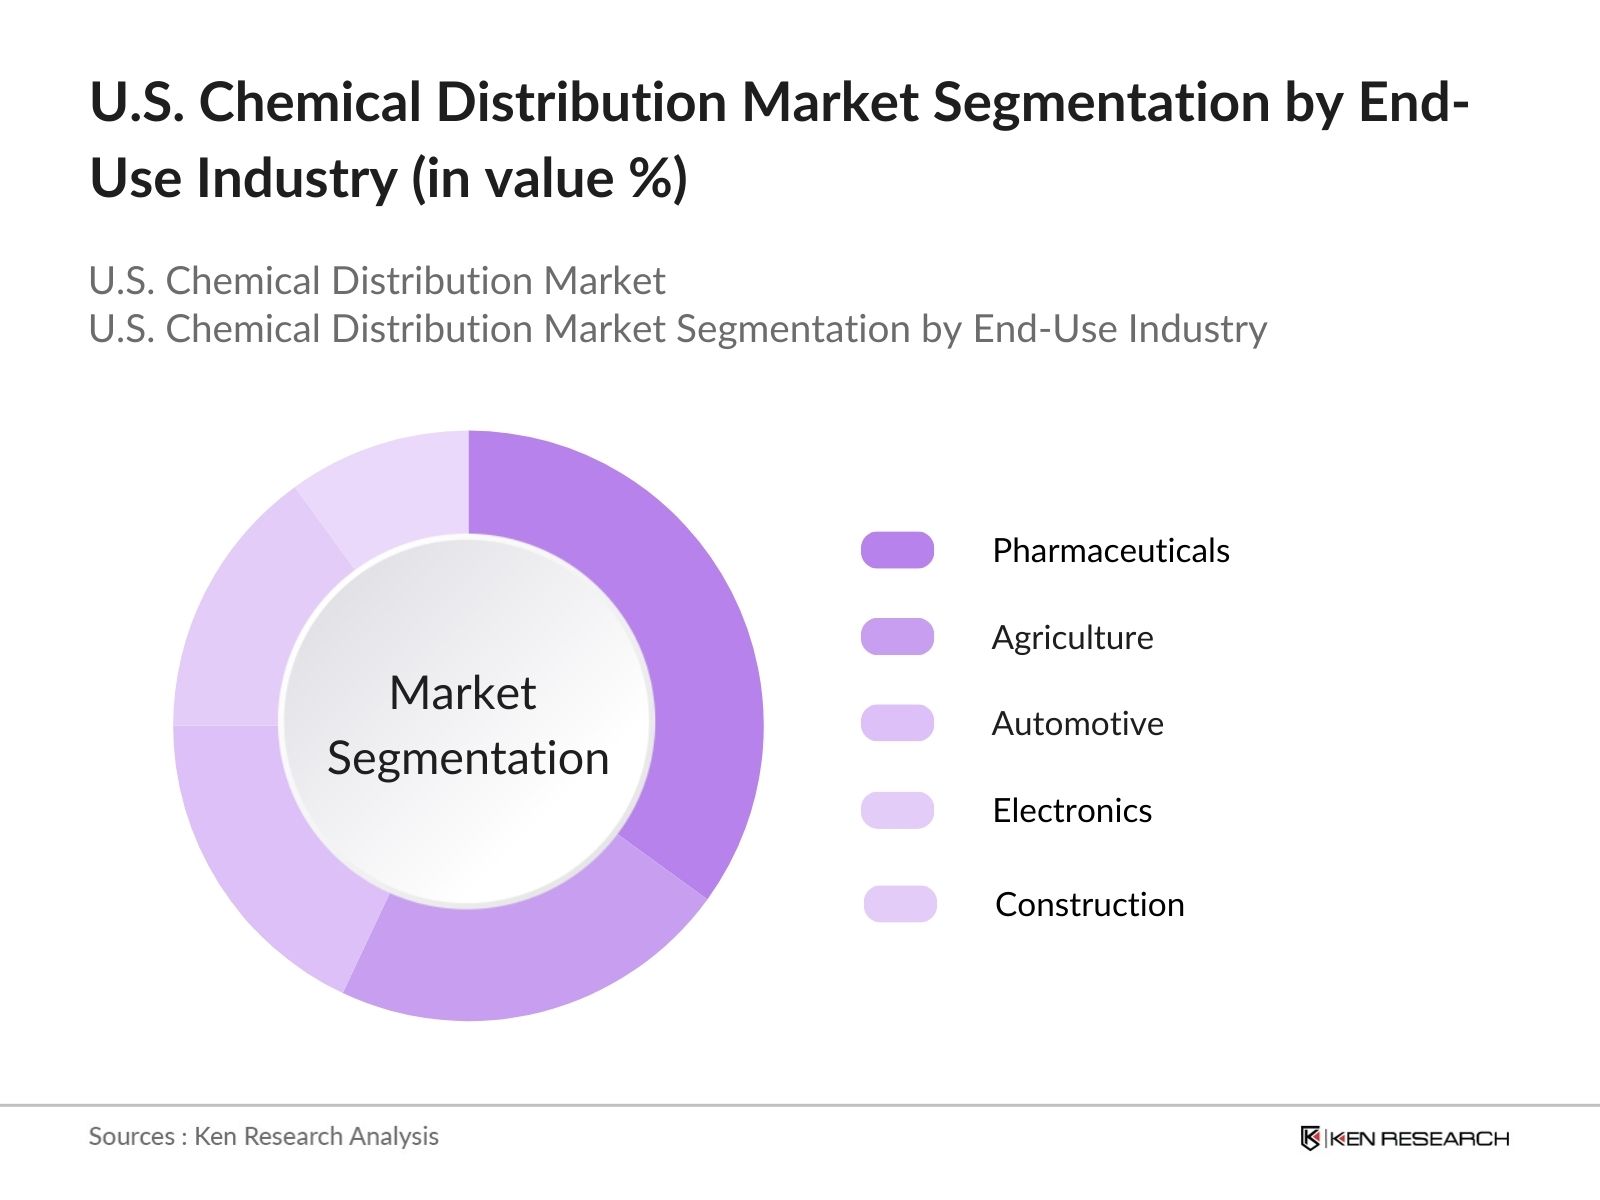
4.2. By End-Use Industry (In Value %)
4.2.1. Pharmaceuticals
4.2.2. Agriculture
4.2.3. Automotive
4.2.4. Electronics
4.2.5. Construction
4.3. By Distribution Channel (In Value %)
4.3.1. Direct Distribution
4.3.2. Third-Party Distribution
4.4. By Region (In Value %)
4.4.1. North
4.4.2. West
4.4.3. South
4.4.4. East
4.5. By Company Size (In Value %)
4.5.1. Large Enterprises
4.5.2. Small and Medium Enterprises (SMEs)

5. U.S. Chemical Distribution Market Competitive Analysis

5.1. Detailed Profiles of Major Companies
5.1.1. Univar Solutions
5.1.2. Brenntag North America
5.1.3. Helm U.S. Corporation
5.1.4. Barentz North America
5.1.5. Nexeo Solutions
5.1.6. IMCD US
5.1.7. ChemGroup
5.1.8. Caldic
5.1.9. Maroon Group
5.1.10. Chemisphere
5.1.11. Azelis Americas
5.1.12. Hawkins Inc.
5.1.13. Tarr LLC
5.1.14. PVS Chemicals
5.1.15. Cornelius Group
5.2. Cross Comparison Parameters (Headquarters, Product Offerings, Revenue, No. of Employees, Distribution Networks, Industry Focus, Sustainability Initiatives, M&A Activities)
5.3. Market Share Analysis
5.4. Strategic Initiatives (Partnerships, Expansions, M&A)
5.5. Mergers and Acquisitions Overview
5.6. Investment Analysis
5.7. Venture Capital Funding
5.8. Government Grants
5.9. Private Equity Investments

6. U.S. Chemical Distribution Market Regulatory Framework

6.1. Chemical Safety Standards and Compliance (OSHA, EPA)
6.2. Licensing and Certification Requirements
6.3. Trade Compliance and Tariff Structures

7. U.S. Chemical Distribution Future Market Size (In USD Bn)

7.1. Future Market Size Projections
7.2. Key Factors Driving Future Market Growth

8. U.S. Chemical Distribution Future Market Segmentation

8.1. By Product Type (In Value %)
8.2. By End-Use Industry (In Value %)
8.3. By Distribution Channel (In Value %)
8.4. By Region (In Value %)
8.5. By Company Size (In Value %)

9. U.S. Chemical Distribution Market Analysts Recommendations

9.1. TAM/SAM/SOM Analysis
9.2. Customer Cohort Analysis
9.3. White Space Opportunities
9.4. Strategic Marketing Initiatives

Disclaimer Contact Us

Research Methodology

Step 1: Identification of Key Variables

The first step involves mapping the U.S. chemical distribution ecosystem, identifying key stakeholders including manufacturers, distributors, and end-users. Secondary research was conducted using proprietary databases and industry reports to define the primary variables that influence market dynamics.

Step 2: Market Analysis and Construction

We compiled historical data related to chemical distribution trends in the U.S. and assessed market penetration, distribution networks, and revenue generation. Service quality and logistics efficiency were evaluated to verify revenue estimates.

Step 3: Hypothesis Validation and Expert Consultation

Industry hypotheses were validated through in-depth interviews with industry leaders and experts from top chemical distribution firms. These discussions provided critical operational insights, further refining our market forecasts.

Step 4: Research Synthesis and Final Output

Finally, detailed insights were gathered through engagements with key players in the U.S. chemical distribution market, helping to validate our bottom-up approach. This synthesis ensured a thorough and reliable market analysis.

Frequently Asked Questions

01. How big is the U.S. Chemical Distribution Market?

The U.S. chemical distribution market is valued at USD 28.03 billion, driven by increasing demand from various end-use sectors such as pharmaceuticals, agriculture, and automotive.

02. What are the challenges in the U.S. Chemical Distribution Market?

The U.S. chemical distribution market faces challenges such as pricing volatility due to fluctuating raw material costs, stringent environmental regulations, and rising transportation costs, which put pressure on profitability.

03. Who are the major players in the U.S. Chemical Distribution Market?

Key players in U.S. chemical distribution market include Brenntag North America, Univar Solutions, IMCD US, Helm U.S. Corporation, and Barentz North America. These companies dominate due to their extensive distribution networks and focus on specialty chemicals.

04. What are the growth drivers of the U.S. Chemical Distribution Market?

Growth drivers in U.S. chemical distribution market include the increasing demand for specialty chemicals, advancements in digital supply chains, and the rise of sustainable chemical solutions driven by environmental regulations.

05. What are the opportunities in the U.S. Chemical Distribution Market?

Opportunities in U.S. chemical distribution market lie in the expansion of e-commerce platforms for chemical distribution, increasing demand for sustainable and green chemical solutions, and growth in end-use industries such as pharmaceuticals and electronics.

Why Buy From Us?

RRR
Refine Robust Result (RRR) Framework

What makes us stand out is that our consultants follows Robust, Refine and Result (RRR) methodology. i.e. Robust for clear definitions, approaches and sanity checking, Refine for differentiating respondents facts and opinions and Result for presenting data with story

Our Reach Is Unmatched

We have set a benchmark in the industry by offering our clients with syndicated and customized market research reports featuring coverage of entire market as well as meticulous research and analyst insights.

Research
Shifting the Research Paradigm

While we don't replace traditional research, we flip the method upside down. Our dual approach of Top Bottom & Bottom Top ensures quality deliverable by not just verifying company fundamentals but also looking at the sector and macroeconomic factors.

Insite
More Insights-Better Decisions

With one step in the future, our research team constantly tries to show you the bigger picture. We help with some of the tough questions you may encounter along the way: How is the industry positioned? Best marketing channel? KPI's of competitors? By aligning every element, we help maximize success.

Trust
Transparency and Trust

Our report gives you instant access to the answers and sources that other companies might choose to hide. We elaborate each steps of research methodology we have used and showcase you the sample size to earn your trust.

support
Round the Clock Support

If you need any support, we are here! We pride ourselves on universe strength, data quality, and quick, friendly, and professional service.

Why Client Choose Us?

400000+ Reports in repository
150+ Consulting project a year
100+ Analysts
8000+ Client Queries in 2022