


U.S. Process Analytical Technology (PAT) Market Outlook 2030
Region:North America
Author(s):Shivani Mehra
Product Code:KROD11460
November 2024
81
About the Report
U.S. Process Analytical Technology Market Overview
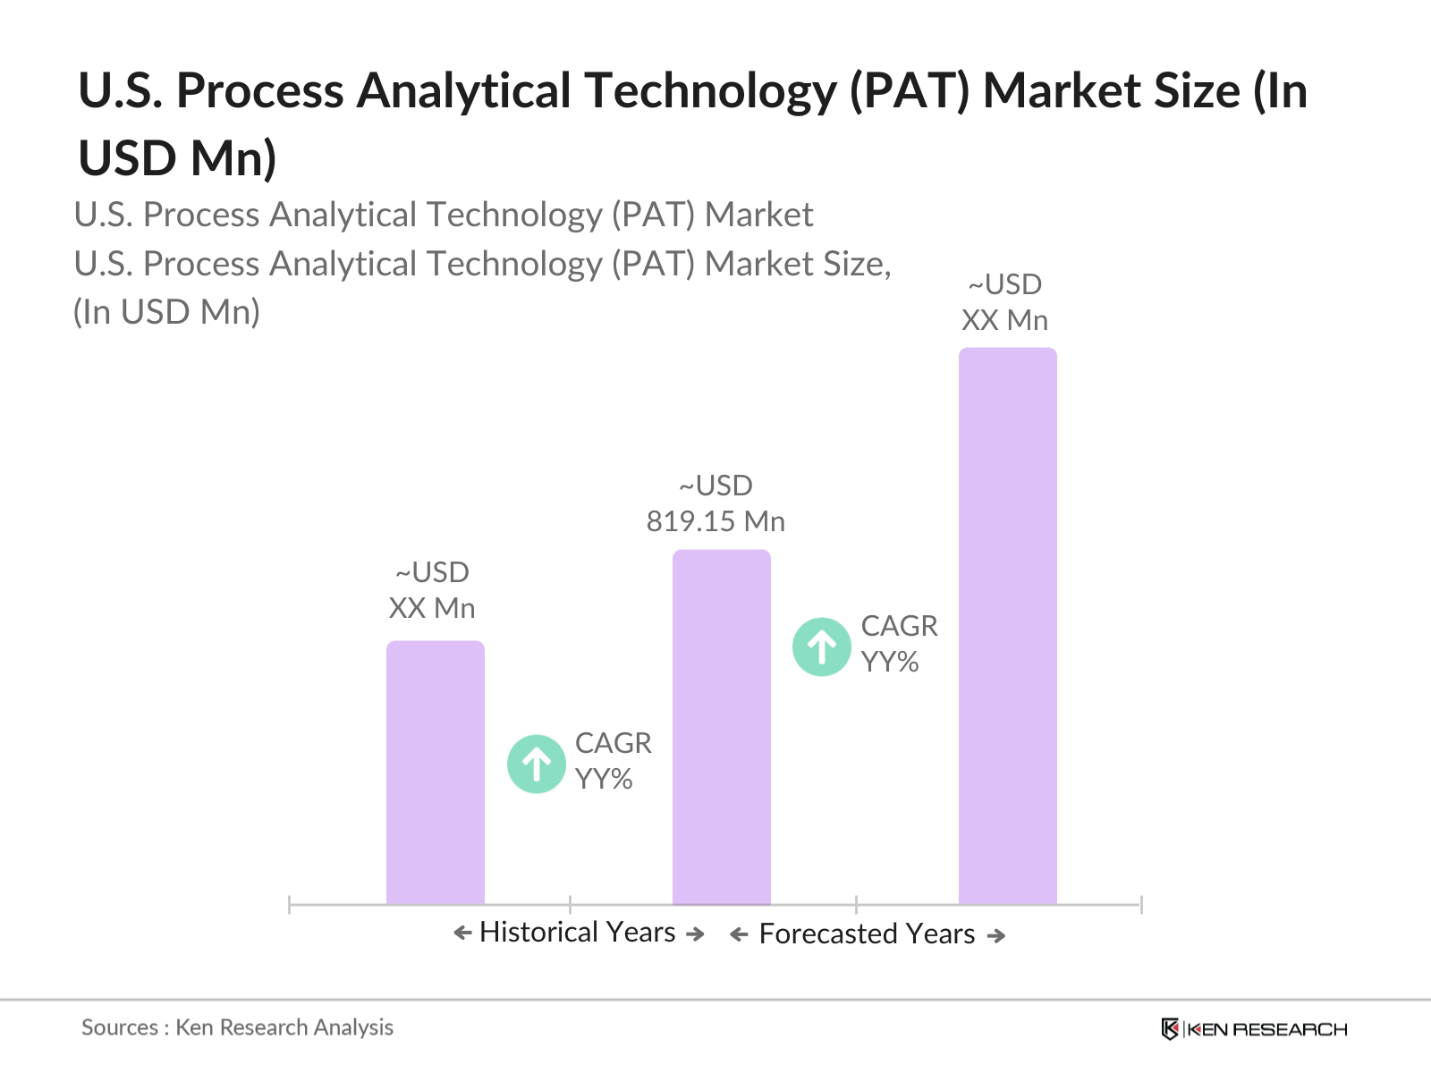
- The U.S. Process Analytical Technology (PAT) market reached a valuation of USD 819.15 million, primarily driven by the rising demand for real-time monitoring in pharmaceutical and biopharmaceutical industries. Increasing regulatory support from agencies like the FDA and the adoption of PAT for quality assurance in drug manufacturing and formulation development further propel the market's growth. The market is also expected to grow due to technological advancements in spectroscopy and chromatography.
- Key regions dominating the market include California, Massachusetts, and New York, where robust pharmaceutical and biotechnology industries create high demand for PAT solutions. These states host numerous biopharma firms, research institutions, and regulatory bodies, reinforcing their dominance in the PAT market.
- The U.S. FDA has implemented specific guidelines under its PAT framework to encourage the use of advanced manufacturing technologies in the biopharma sector. Introduced to enhance product quality and manufacturing efficiency, the PAT guidance provides a regulatory pathway that aligns with innovation in real-time quality control and monitoring. By promoting these technologies, the FDA aims to reduce process variability and enhance safety in drug production. In recent years, the FDA has issued multiple guidance documents and collaborated with industry players to ensure smooth adoption of PAT in line with regulatory standards.
U.S. Process Analytical Technology Market Segmentation
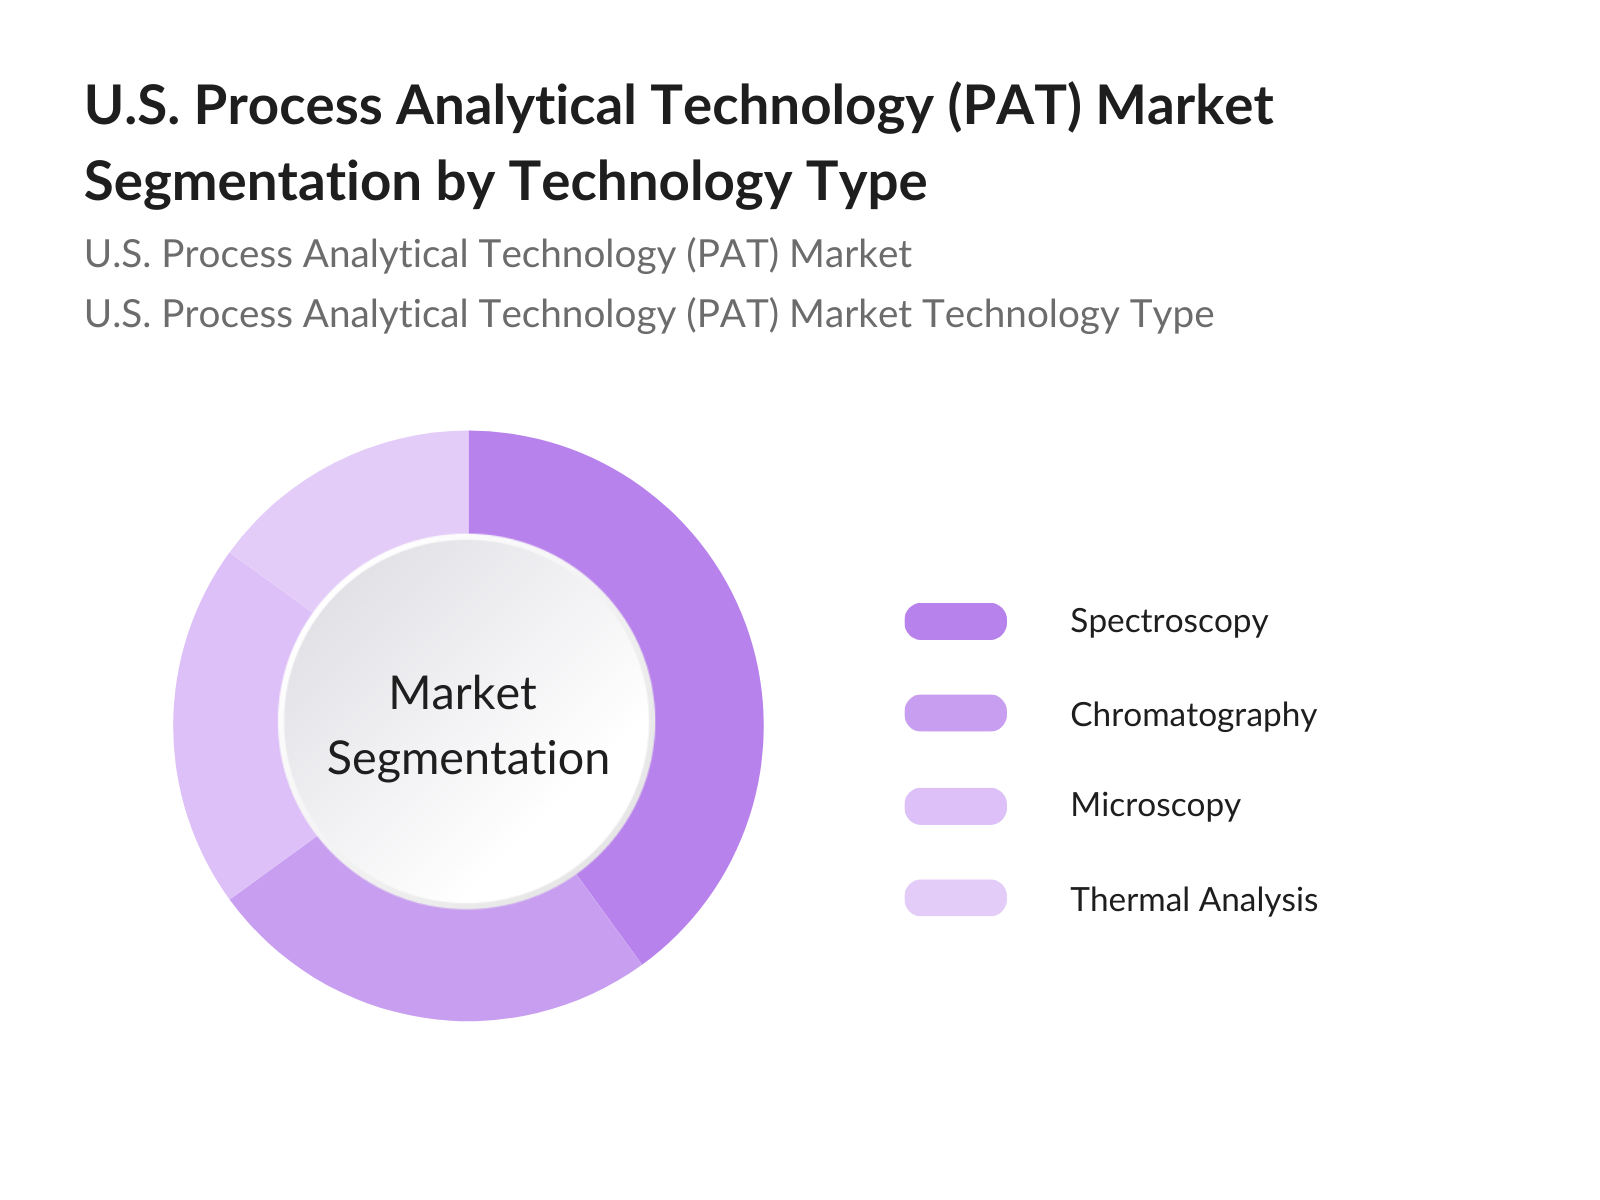
- By Technology: The U.S. Process Analytical Technology market is segmented by technology into spectroscopy, chromatography, microscopy, and thermal analysis. Spectroscopy dominates due to its extensive use in drug formulation and quality control, as it allows for non-destructive, real-time monitoring of chemical composition during manufacturing. The adoption of spectroscopy in continuous manufacturing processes is another significant driver for its dominance within this segment.
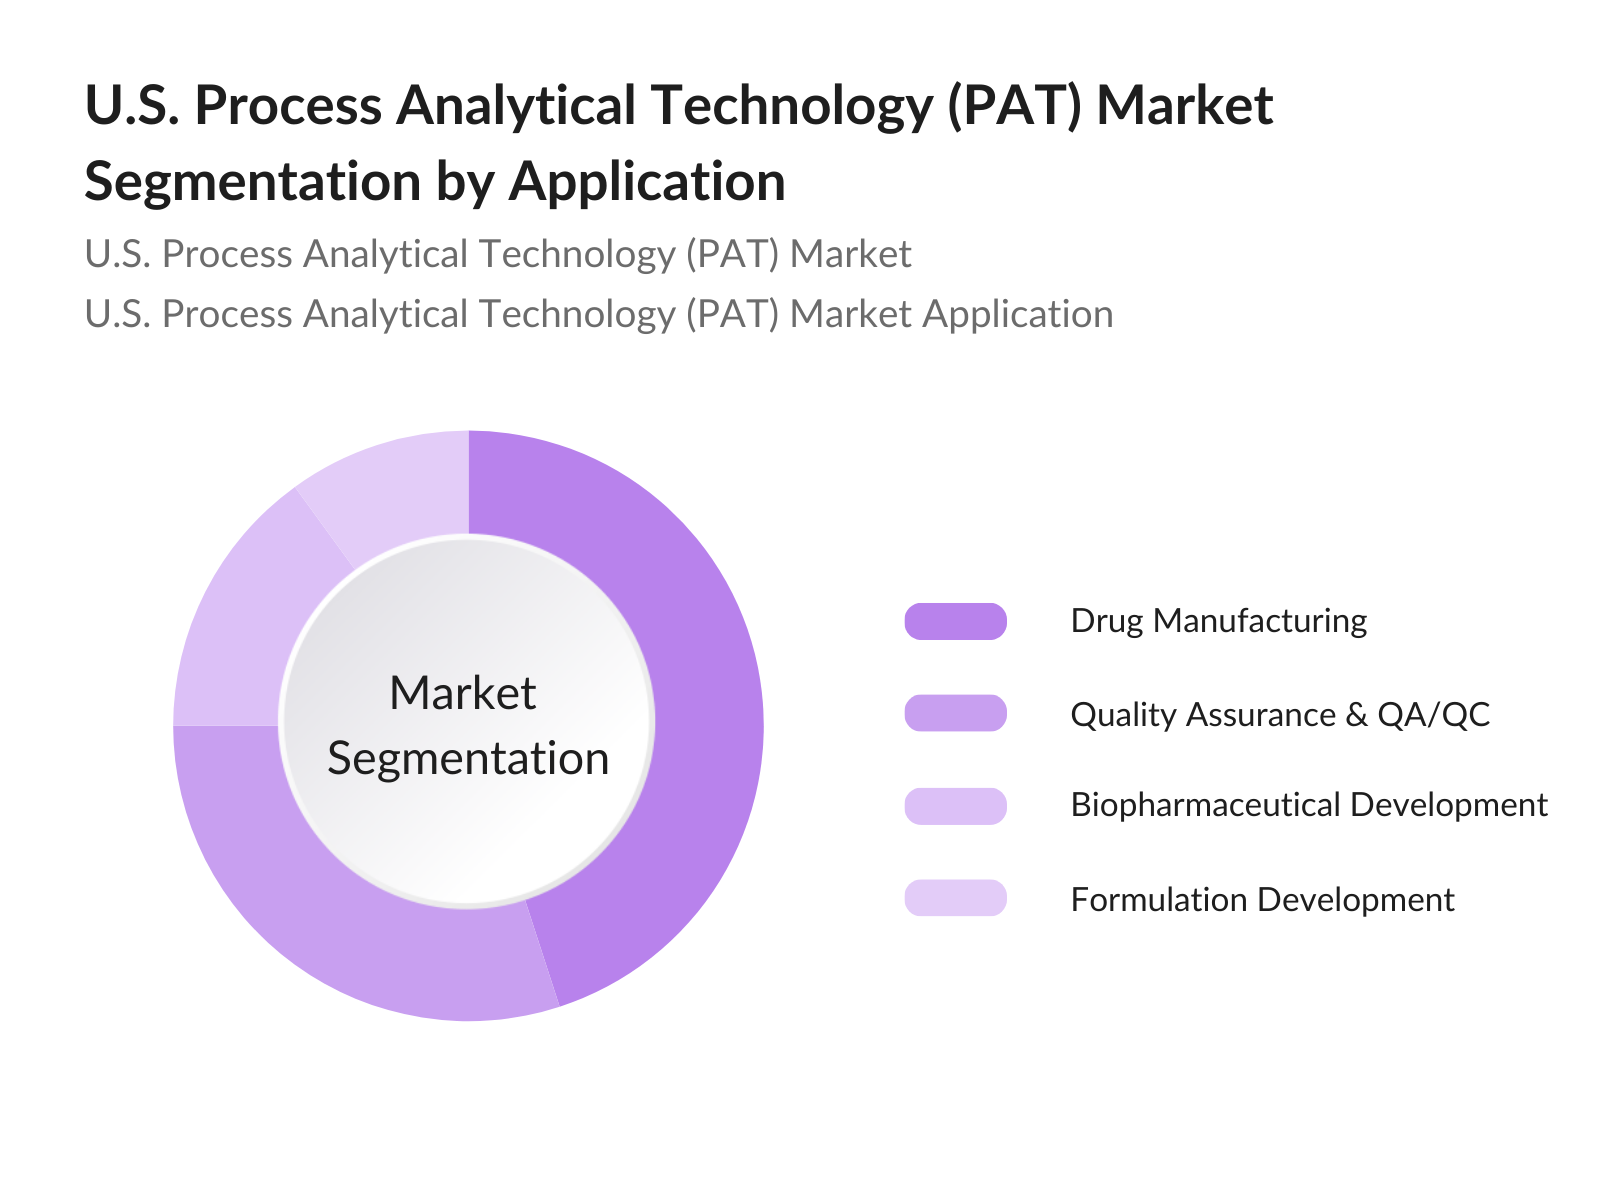
- By Application: The market is further segmented by application into drug manufacturing, quality assurance & quality control (QA/QC), biopharmaceutical development, and formulation development. Drug manufacturing holds the highest market share due to its critical role in ensuring product consistency and compliance with regulatory standards. Real-time PAT tools are essential in monitoring each stage of the drug manufacturing process, supporting the adherence to good manufacturing practices (GMP).
U.S. Process Analytical Technology Market Competitive Landscape
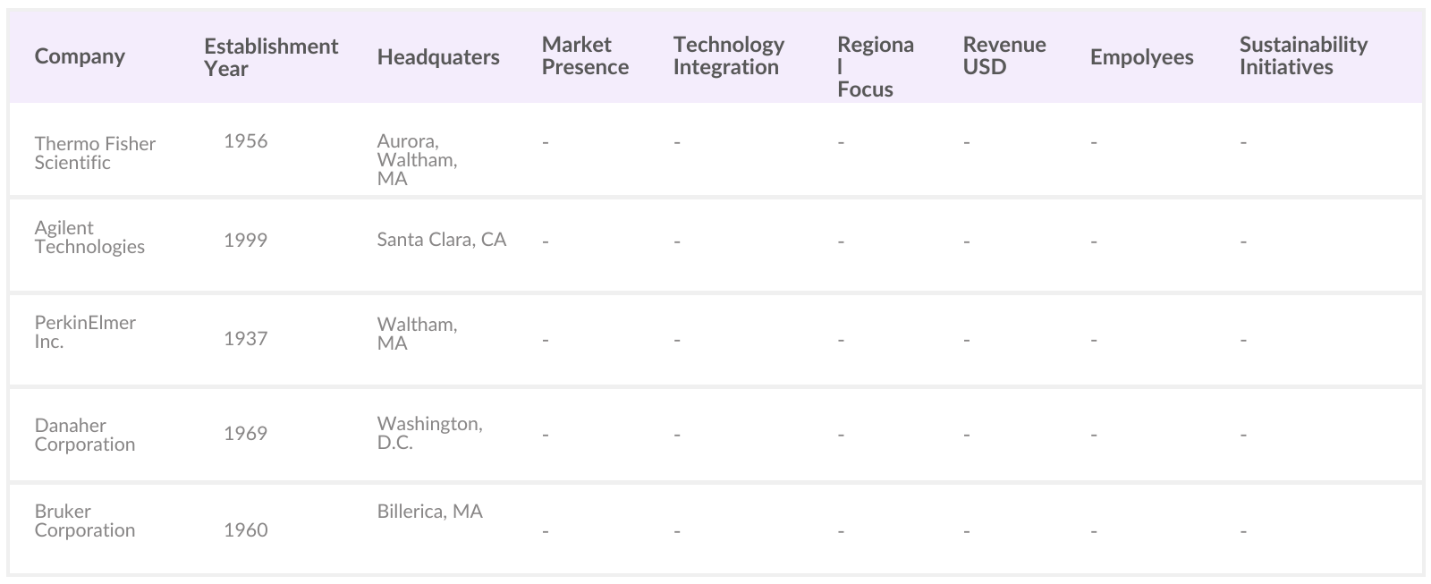
The U.S. Process Analytical Technology market is characterized by the presence of leading players such as Thermo Fisher Scientific and Agilent Technologies, which maintain significant influence due to their extensive product portfolios and strong client relationships within pharmaceutical and biotech industries.
U.S. Process Analytical Technology Market Analysis
Market Growth Drivers
- Rising Demand for Quality Control in Biopharma: The U.S. biopharmaceutical sector is a significant contributor to the economy, with over 4,500 companies operating nationwide. In 2022, the industry invested approximately $102 billion in research and development, underscoring a strong commitment to innovation and quality. This substantial investment highlights the industry's dedication to maintaining high-quality standards in drug development and manufacturing. The emphasis on quality control is further reinforced by the Food and Drug Administration's (FDA) stringent regulations, which mandate rigorous testing and validation processes to ensure the safety and efficacy of biopharmaceutical products.
- Increasing Adoption of Real-Time Monitoring: Real-time monitoring has become integral to modern manufacturing, enabling immediate detection and correction of process deviations. In the U.S., industries such as pharmaceuticals and biotechnology have increasingly adopted real-time monitoring systems to enhance process efficiency and product quality. For instance, the FDA's Process Analytical Technology (PAT) framework encourages the use of real-time monitoring tools to achieve better process understanding and control. This approach not only improves product quality but also reduces production costs by minimizing waste and rework.
- Technological Advancements in Spectroscopy: Spectroscopy technologies have advanced significantly, offering enhanced capabilities for process analysis. In the U.S., industries such as pharmaceuticals, chemicals, and food processing have increasingly utilized advanced spectroscopy techniques for real-time monitoring and control of manufacturing processes. These advancements have led to improved process efficiency, product quality, and compliance with regulatory standards. The development of portable and handheld spectroscopy devices has further expanded their application in various industries, enabling on-site analysis and faster decision-making.
Market Challenges:
- High Initial Investment Costs: Implementing Process Analytical Technology (PAT) systems requires substantial initial investment, which can be a barrier for small and medium-sized enterprises (SMEs). The costs associated with purchasing advanced analytical instruments, integrating them into existing manufacturing processes, and training personnel can be significant. For instance, the average cost of a high-performance liquid chromatography (HPLC) system ranges from $20,000 to $50,000, depending on the configuration and capabilities. Additionally, the integration of PAT systems may require modifications to existing infrastructure, further increasing costs.
- Integration Complexity with Existing Systems: Integrating PAT systems into existing manufacturing processes can be complex and challenging. Many manufacturing facilities operate with legacy systems that may not be compatible with modern PAT technologies. This incompatibility can lead to significant integration challenges, requiring extensive system modifications or replacements. Additionally, the integration process may necessitate downtime, disrupting production schedules and potentially leading to financial losses. The complexity of integration can also require specialized expertise, further increasing costs and resource requirements.
U.S. Process Analytical Technology Market Future Outlook
Over the next five years, the U.S. Process Analytical Technology market is projected to experience robust growth due to increased focus on precision medicine, technological advancements in analytical tools, and the regulatory push towards Quality by Design (QbD) practices. Companies are expected to adopt PAT solutions more widely, driven by the need for efficient production processes, cost reduction, and adherence to stringent regulatory standards. The market outlook remains optimistic, as the PAT industry adapts to evolving pharmaceutical and biopharmaceutical needs.
Market Opportunities:
- Expansion in Emerging Biopharma Markets: The biopharmaceutical industry is experiencing significant growth, with emerging markets presenting substantial opportunities. In 2022, the global biopharmaceutical market was valued at approximately $325 billion, with emerging markets contributing significantly to this growth. The expansion of biopharmaceutical manufacturing in these regions necessitates advanced process control technologies to ensure product quality and compliance with international standards. Process Analytical Technology (PAT) offers real-time monitoring and control capabilities, making it an essential tool for manufacturers aiming to meet stringent quality requirements.
- Increased Funding in R&D: Research and development (R&D) investments are crucial for innovation and technological advancement. In 2022, the U.S. government allocated approximately $142 billion to R&D across various sectors, including healthcare and manufacturing. This funding supports the development of advanced manufacturing technologies, such as Process Analytical Technology (PAT), which can enhance process efficiency and product quality. Additionally, private sector investments in R&D have been substantial, with companies investing heavily in developing.
Scope of the Report
|
By Technology |
Spectroscopy Chromatography Microscopy Capillary Electrophoresis Thermal Analysis |
|
By Measurement Type |
On-line In-line At-line Off-line |
|
By Application |
Drug Manufacturing Biopharmaceutical Development QA/QC Formulation Development |
|
By End-User |
Pharmaceutical Companies Biotechnology Companies Research Institutes CROs |
|
By Region |
North-East Midwest West Coast Southern States |
Products
Key Target Audience
Pharmaceutical Manufacturing Companies
Biotechnology Firms
Government and Regulatory Bodies (e.g., FDA, U.S. Department of Health and Human Services)
Drug Development Companies
Quality Assurance and Control Organizations
Research and Development Institutes
Investment and Venture Capital Firms
Contract Research Organizations (CROs)
Companies
Players mentioned in the report
Thermo Fisher Scientific
Agilent Technologies
PerkinElmer Inc.
Danaher Corporation
Bruker Corporation
ABB Ltd.
Shimadzu Corporation
Emerson Electric Co.
Mettler-Toledo International Inc.
Siemens AG
Sartorius AG
HORIBA Ltd.
Malvern Panalytical
Biomerieux SA
Yokogawa Electric Corporation
Table of Contents
1. U.S. Process Analytical Technology Market Overview
1.1. Definition and Scope
1.2. Market Taxonomy
1.3. Market Growth Rate
1.4. Market Segmentation Overview
2. U.S. Process Analytical Technology Market Size (in USD Bn)
2.1. Historical Market Size
2.2. Year-On-Year Growth Analysis
2.3. Key Market Developments and Milestones
3. U.S. Process Analytical Technology Market Analysis
3.1. Growth Drivers
3.1.1. Rising Demand for Quality Control in Biopharma (Quality Control)
3.1.2. Increasing Adoption of Real-Time Monitoring (Real-Time Monitoring)
3.1.3. Technological Advancements in Spectroscopy (Spectroscopy Advancements)
3.1.4. Regulatory Compliance Requirements (Regulatory Compliance)
3.2. Market Challenges
3.2.1. High Initial Investment Costs (Initial Cost Challenges)
3.2.2. Integration Complexity with Existing Systems (Integration Complexity)
3.2.3. Limited Skilled Workforce Availability (Skilled Workforce Challenges)
3.3. Opportunities
3.3.1. Expansion in Emerging Biopharma Markets (Emerging Markets Expansion)
3.3.2. Increased Funding in R&D (R&D Funding)
3.3.3. Growth of Process Analytical Technology in Continuous Manufacturing (Continuous Manufacturing)
3.4. Trends
3.4.1. Growth of Automation in PAT (Automation)
3.4.2. Integration with Industry 4.0 Technologies (Industry 4.0 Integration)
3.4.3. Advancements in Data Analytics and Machine Learning (Data Analytics Advancements)
3.5. Regulatory Compliance
3.5.1. FDA PAT Guidance
3.5.2. Good Manufacturing Practices (GMP) Compliance
3.5.3. Quality by Design (QbD) Initiatives
3.5.4. Public-Private Partnerships in Biopharma
3.6. SWOT Analysis
3.7. Stake Ecosystem
3.8. Porters Five Forces
3.9. Competition Ecosystem
4. U.S. Process Analytical Technology Market Segmentation
4.1. By Technology (in Value %)
4.1.1. Spectroscopy
4.1.2. Chromatography
4.1.3. Microscopy
4.1.4. Capillary Electrophoresis
4.1.5. Thermal Analysis
4.2. By Measurement Type (in Value %)
4.2.1. On-line
4.2.2. In-line
4.2.3. At-line
4.2.4. Off-line
4.3. By Application (in Value %)
4.3.1. Drug Manufacturing
4.3.2. Biopharmaceutical Development
4.3.3. Quality Assurance & Quality Control (QA/QC)
4.3.4. Formulation Development
4.4. By End-User (in Value %)
4.4.1. Pharmaceutical Companies
4.4.2. Biotechnology Companies
4.4.3. Research Institutes
4.4.4. Contract Research Organizations (CROs)
4.5. By Region (in Value %)
4.5.1. Northeast U.S.
4.5.2. Midwest U.S.
4.5.3. Southern U.S.
4.5.4. Western U.S.
5. U.S. Process Analytical Technology Market Competitive Analysis
5.1. Detailed Profiles of Major Companies
5.1.1. Thermo Fisher Scientific
5.1.2. Agilent Technologies
5.1.3. Bruker Corporation
5.1.4. PerkinElmer Inc.
5.1.5. Danaher Corporation
5.1.6. ABB Ltd.
5.1.7. Shimadzu Corporation
5.1.8. Emerson Electric Co.
5.1.9. Mettler-Toledo International Inc.
5.1.10. Siemens AG
5.1.11. Sartorius AG
5.1.12. HORIBA Ltd.
5.1.13. Malvern Panalytical
5.1.14. Biomerieux SA
5.1.15. Yokogawa Electric Corporation
5.2. Cross Comparison Parameters (Market Reach, Core Technology, Research Investment, Compliance Capabilities, Product Portfolio, Market Focus, Technological Expertise, Customer Base)
5.3. Market Share Analysis
5.4. Strategic Initiatives
5.5. Mergers and Acquisitions
5.6. Investment Analysis
5.7. Government Grants
5.8. Private Equity Investments
6. U.S. Process Analytical Technology Market Regulatory Framework
6.1. FDA Standards for Process Analytical Technology
6.2. Good Manufacturing Practices (GMP) Compliance Requirements
6.3. Certification Processes
6.4. Regulatory Bodies Involved
7. U.S. Process Analytical Technology Future Market Size (in USD Bn)
7.1. Future Market Size Projections
7.2. Key Factors Driving Future Market Growth
8. U.S. Process Analytical Technology Future Market Segmentation
8.1. By Technology (in Value %)
8.2. By Measurement Type (in Value %)
8.3. By Application (in Value %)
8.4. By End-User (in Value %)
8.5. By Region (in Value %)
9. U.S. Process Analytical Technology Market Analysts Recommendations
9.1. TAM/SAM/SOM Analysis
9.2. White Space Opportunity Analysis
9.3. Customer Cohort Analysis
9.4. Key Marketing Initiatives
Research Methodology
Step 1: Identification of Key Variables
The initial phase focuses on identifying critical variables influencing the U.S. Process Analytical Technology market, which include regulatory frameworks, technological advancements, and pharmaceutical manufacturing processes. This is achieved through extensive desk research and consultation with secondary and proprietary databases.
Step 2: Market Analysis and Construction
This step involves analyzing historical data on market penetration, manufacturing demand, and PAT adoption rates. Additionally, we assess the impact of regulatory changes and technological integration on the market, compiling data to construct accurate revenue estimates and market projections.
Step 3: Hypothesis Validation and Expert Consultation
Hypotheses regarding market growth and demand patterns are developed and validated through consultations with industry professionals from diverse organizations, including pharmaceutical companies, instrument manufacturers, and regulatory bodies. This helps refine and corroborate our market insights.
Step 4: Research Synthesis and Final Output
The final phase includes synthesizing data from interviews, secondary research, and industry reports to develop a comprehensive analysis. Direct interactions with market stakeholders ensure data accuracy, leading to an insightful, validated report on the U.S. Process Analytical Technology market.
Frequently Asked Questions
01. How big is the U.S. Process Analytical Technology market?
The U.S. Process Analytical Technology market is valued at USD 819.15 million, driven by high demand from the pharmaceutical and biopharmaceutical industries for efficient monitoring and quality control solutions.
02. What are the challenges in the U.S. Process Analytical Technology market?
Key challenges include high initial costs of PAT systems, integration issues with legacy equipment, and a limited skilled workforce trained in advanced analytical technologies.
03. Who are the major players in the U.S. Process Analytical Technology market?
Leading companies in this market include Thermo Fisher Scientific, Agilent Technologies, PerkinElmer, Danaher Corporation, and Bruker Corporation, known for their comprehensive PAT solutions and expertise in biopharma.
04. What are the growth drivers of the U.S. Process Analytical Technology market?
Growth is driven by increasing adoption of real-time monitoring in drug manufacturing, supportive regulatory frameworks from the FDA, and the shift toward Quality by Design (QbD) practices in pharmaceuticals.
Why Buy From Us?
 Framework")
What makes us stand out is that our consultants follows Robust, Refine and Result (RRR) methodology. i.e. Robust for clear definitions, approaches and sanity checking, Refine for differentiating respondents facts and opinions and Result for presenting data with story

We have set a benchmark in the industry by offering our clients with syndicated and customized market research reports featuring coverage of entire market as well as meticulous research and analyst insights.

While we don't replace traditional research, we flip the method upside down. Our dual approach of Top Bottom & Bottom Top ensures quality deliverable by not just verifying company fundamentals but also looking at the sector and macroeconomic factors.

With one step in the future, our research team constantly tries to show you the bigger picture. We help with some of the tough questions you may encounter along the way: How is the industry positioned? Best marketing channel? KPI's of competitors? By aligning every element, we help maximize success.

Our report gives you instant access to the answers and sources that other companies might choose to hide. We elaborate each steps of research methodology we have used and showcase you the sample size to earn your trust.

If you need any support, we are here! We pride ourselves on universe strength, data quality, and quick, friendly, and professional service.