


US Thermal Power Market Outlook to 2030
Region:North America
Author(s):Shreya Garg
Product Code:KROD5925
December 2024
88
About the Report
US Thermal Power Market Overview
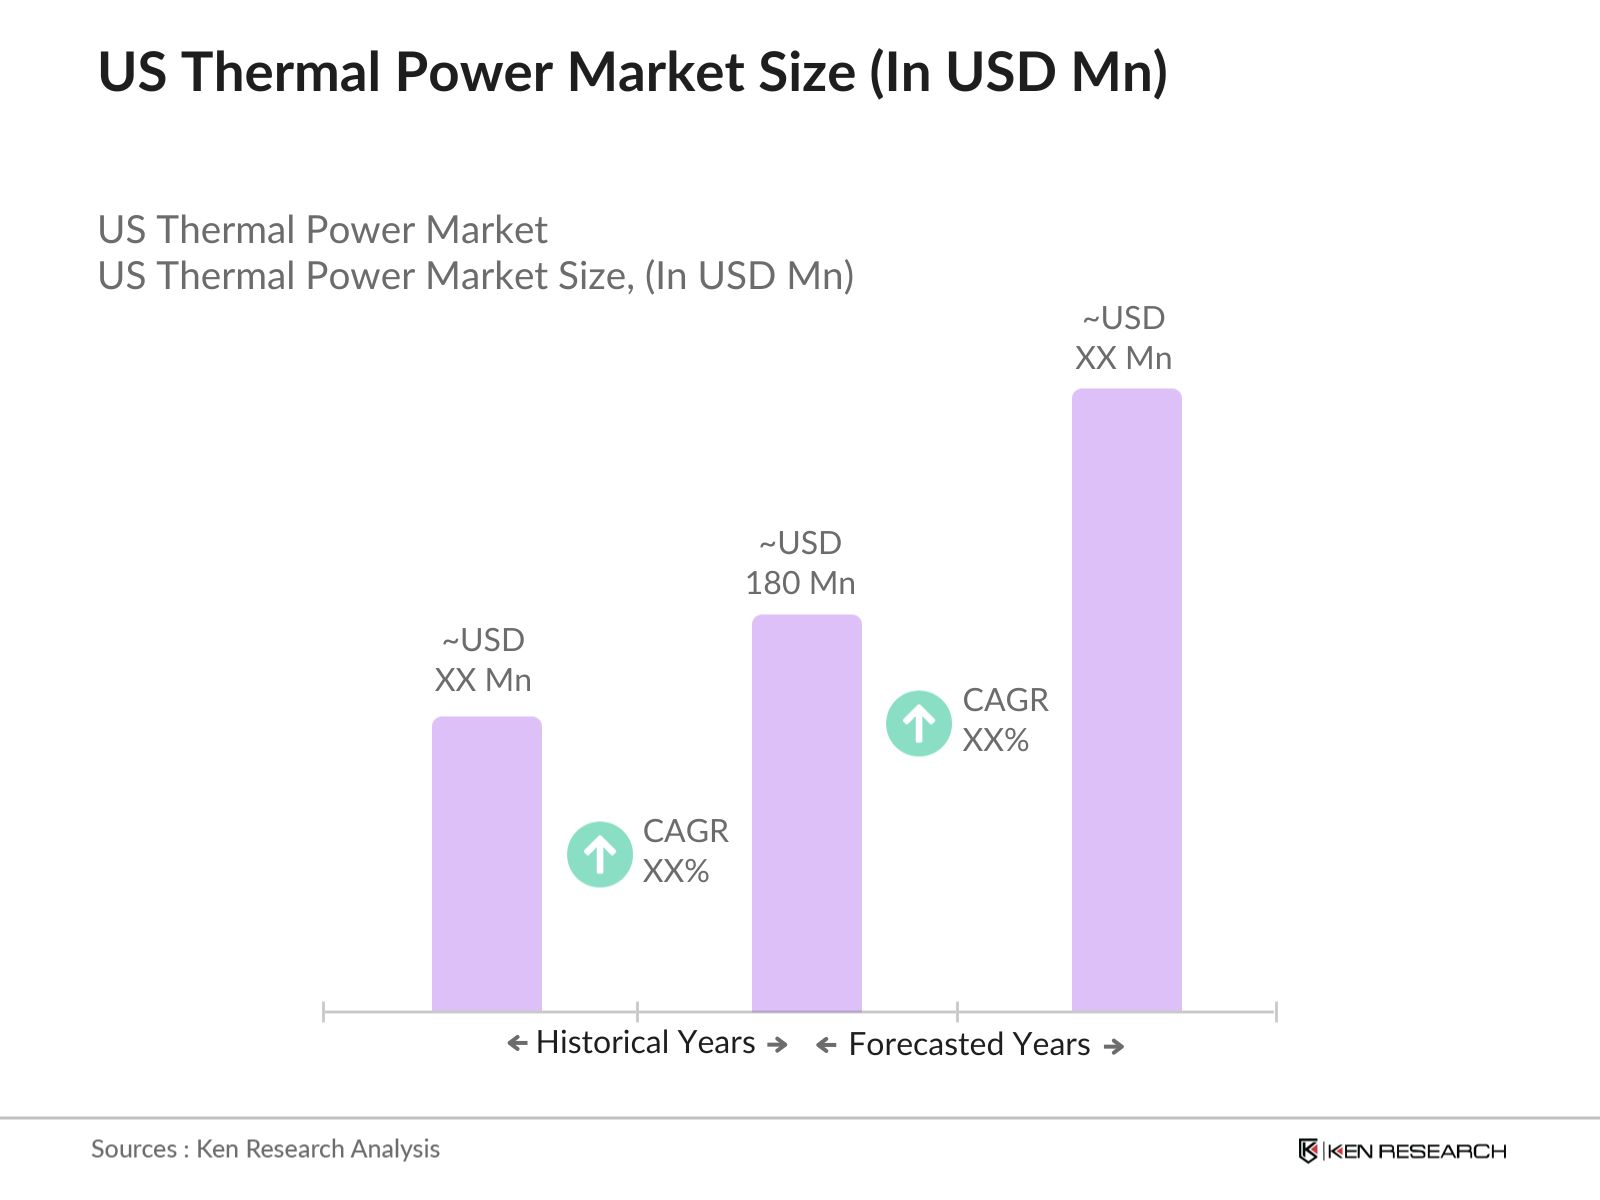
- The US Thermal Power market is valued at USD 180 million, based on a five-year historical analysis. This market is driven by the ever-growing demand for electricity across industrial, residential, and commercial sectors. Thermal power plants, primarily fueled by coal and natural gas, form the backbone of the US power generation infrastructure. The rising adoption of natural gas as a cleaner fuel option has contributed to the sustained demand for thermal power, supported by government initiatives to transition towards lower emissions.
- Key cities that dominate the US thermal power market include Texas, California, and Florida. Texas holds a share due to its vast reserves of natural gas and its extensive infrastructure for natural gas-fired power plants. Californias dominance is due to its large population and demand for electricity, despite ongoing efforts to shift towards renewable sources. Floridas reliance on natural gas for electricity generation makes it a dominant player in the market as well. These regions have established power infrastructure, favorable regulations, and access to resources, driving their dominance in the thermal power landscape.
- Public-private partnerships (PPPs) are playing a crucial role in the development of power infrastructure in the U.S. The Infrastructure Investment and Jobs Act of 2021 promotes PPPs by providing financial incentives and regulatory support for private sector investment in energy projects, including thermal power. In 2022, PPPs contributed approximately $5 billion to energy infrastructure projects, highlighting the government's commitment to fostering collaboration between the public and private sectors.
US Thermal Power Market Segmentation
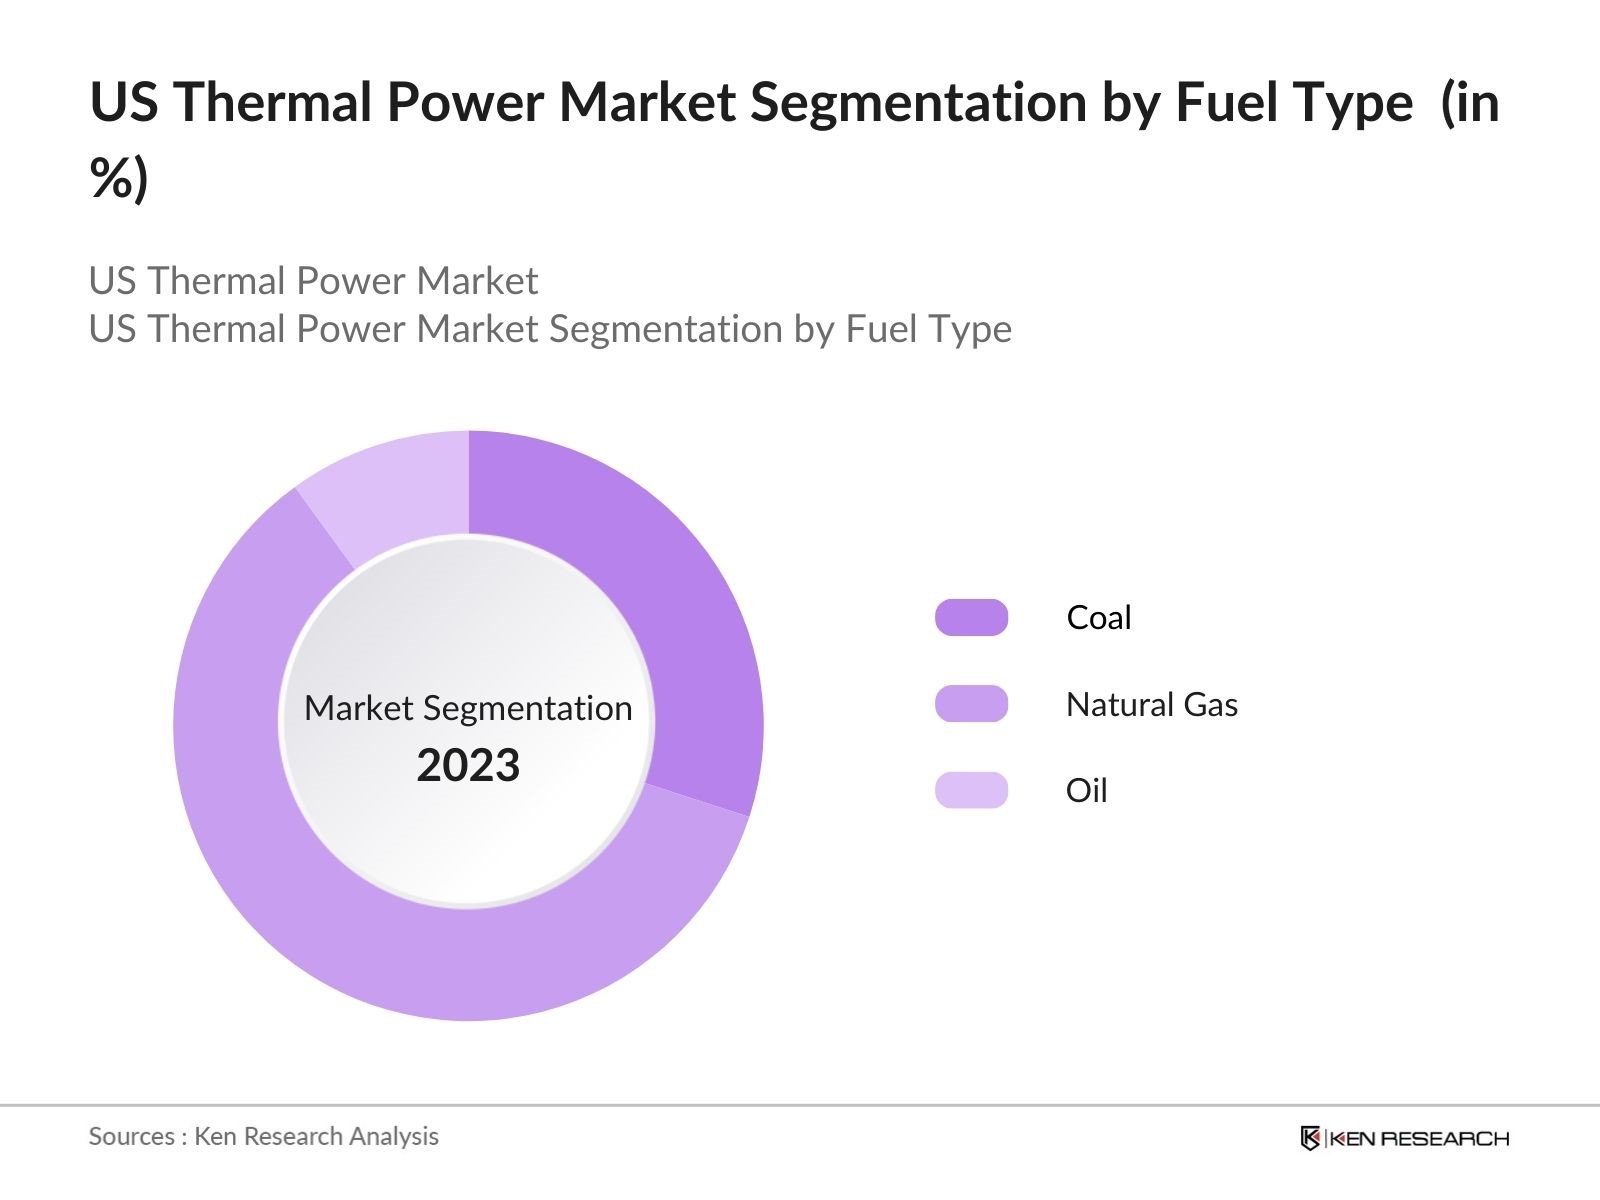
By Fuel Type: The market is segmented by fuel type into coal, natural gas, and oil. Among these, natural gas currently holds a dominant share in the market due to its cleaner combustion process and the push towards reducing emissions. The abundance of natural gas reserves in the US, along with the development of pipeline infrastructure, makes it the preferred choice for new power plants. Additionally, government regulations aimed at reducing carbon emissions have accelerated the shift away from coal to natural gas.
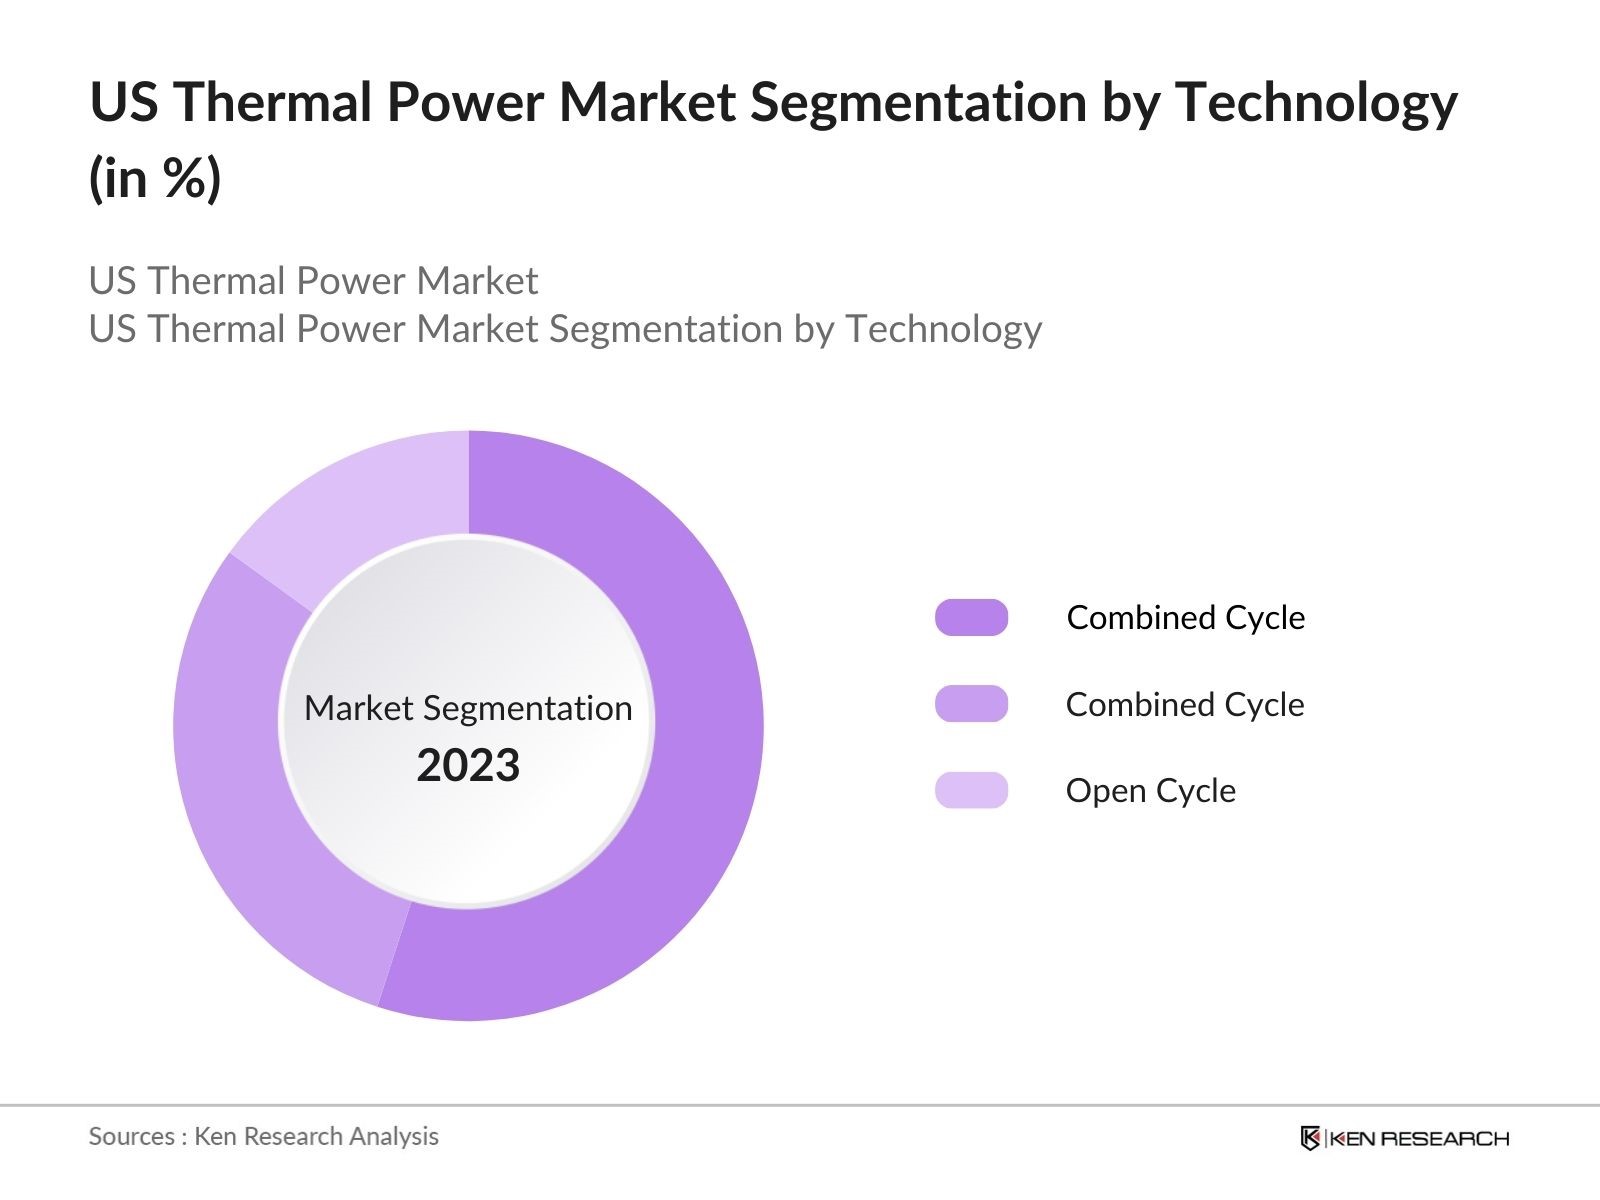
By Technology: Thermal power technology can be segmented into combined cycle, cogeneration, and open cycle. Combined cycle technology is the dominant segment due to its higher efficiency and lower emissions compared to traditional open cycle systems. Combined cycle plants use both gas and steam turbines to generate electricity, making them more efficient and a better fit for meeting environmental standards. The operational flexibility and cost-effectiveness of this technology have further solidified its position in the US market.
US Thermal Power Market Competitive Landscape
The US thermal power market is highly competitive, with major players having established strong positions. Companies leverage advanced technology, fuel diversity, and strategic geographic locations to maintain their market leadership. The competitive landscape in the US thermal power market is characterized by the strong presence of key players such as General Electric, Siemens Energy, and Mitsubishi Power, which have a wide range of offerings and advanced technologies. The competition is driven by a combination of fuel efficiency, carbon emissions management, and operational capacity, allowing these companies to remain competitive in the evolving power generation landscape.
|
Company |
Establishment Year |
Headquarters |
Fuel Portfolio |
Operational Capacity |
Technology Expertise |
Market Share |
Geographical Presence |
Carbon Footprint |
Strategic Initiatives |
|
General Electric |
1892 |
Boston, MA |
|||||||
|
Siemens Energy |
1847 |
Munich, Germany |
|||||||
|
Mitsubishi Power |
1870 |
Tokyo, Japan |
|||||||
|
Duke Energy Corporation |
1904 |
Charlotte, NC |
|||||||
|
Southern Company |
1945 |
Atlanta, GA |
US Thermal Power Industry Analysis
Growth Drivers
- Increase in Energy Demand: The US is experiencing a rise in energy consumption, driven by population growth, industrial activities, and expanding urban centers. According to the U.S. Energy Information Administration (EIA), total electricity consumption in the U.S. reached approximately 4.07 trillion kilowatt-hours (kWh) in 2022, a marked increase from previous years. With continuous industrial expansion, particularly in sectors like manufacturing and IT, energy demand is expected to stay strong through 2025. This growing demand necessitates the expansion and optimization of thermal power plants to ensure uninterrupted power supply.
- Technological Advancements in Power Generation: The integration of advanced technologies like AI, automation, and smart grid systems in thermal power plants is enhancing operational efficiency and reducing downtime. For example, AI-based predictive maintenance in thermal plants can reduce unplanned outages by up to 50%, according to the U.S. Department of Energy. Such technological innovations are crucial as they ensure more reliable and optimized power generation, which is increasingly necessary in the U.S. where electricity consumption is expected to remain stable at 4.2 trillion kWh through 2025.
- Government Regulations Favoring Power Projects: Federal and state-level government initiatives in the U.S. are strongly supporting the expansion of thermal power projects. The Infrastructure Investment and Jobs Act, passed in 2021, earmarks approximately $73 billion for upgrading the nation's energy infrastructure, with a portion dedicated to power generation, including thermal plants. These regulatory efforts aim to bolster energy security and improve the efficiency of existing plants, further supporting the expansion of thermal power generation across the country.
Market Challenges
- Environmental Concerns Related to Emissions: One of the major challenges facing the U.S. thermal power market is the stringent environmental regulations on greenhouse gas emissions. The Clean Air Act, implemented by the Environmental Protection Agency (EPA), enforces strict emission limits for thermal power plants. In 2022, CO2 emissions from the U.S. energy sector stood at 4.9 billion metric tons, with thermal power plants being a major contributor. The growing public and governmental push for cleaner energy sources continues to place pressure on the thermal power sector.
- High Initial Capital Costs: Thermal power plants require substantial upfront investments, particularly when incorporating modern technologies like carbon capture and storage (CCS) systems. The capital cost for constructing a new combined-cycle gas turbine plant can range between $1,000 and $1,500 per kilowatt, based on data from the U.S. Department of Energy. These high costs often deter investment, especially as the energy market shifts toward renewable options with lower operational costs.
US Thermal Power Market Future Outlook
Over the next five years, the US thermal power market is expected to witness moderate growth, supported by technological advancements, increased focus on reducing carbon emissions, and regulatory changes. Despite the growing emphasis on renewable energy, thermal power will continue to play a crucial role in the nations energy mix due to its ability to provide reliable base load electricity. Advancements in carbon capture and storage (CCS) technologies and the increased use of natural gas are anticipated to further enhance the sustainability of thermal power plants.
Future Market Opportunities
- Expansion into Rural and Industrial Power Supply: There is a growing opportunity for thermal power plants to expand their services to rural and industrial areas where grid connectivity remains unreliable. The U.S. Department of Energy's Rural Energy for America Program (REAP) is providing grants and loans to facilitate energy projects in rural areas, opening a potential market for thermal power. In 2022, over $300 million was allocated for energy projects under REAP, with thermal power projects poised to benefit from this expansion.
- International Collaborations in Power Projects: The U.S. thermal power sector is seeing increased collaboration with international entities, especially for technology transfer and project financing. For instance, the World Banks Energy Sector Management Assistance Program (ESMAP) supports several energy infrastructure projects in developing countries, including thermal power projects. These collaborations allow U.S. companies to export their technologies and expertise, expanding their footprint globally while also receiving financial support from international development agencies.
Scope of the Report
|
Fuel Type |
Coal Natural Gas Oil |
|
Technology |
Combined Cycle Cogeneration Open Cycle |
|
End-User |
Industrial Residential Commercial |
|
Plant Type |
Base Load Peak Load |
|
Region |
Midwest Northeast West South |
Products
Key Target Audience
Investors and venture capitalist firms
Government and regulatory bodies (EPA, Department of Energy)
Power plant operators
Thermal power equipment manufacturers
Fuel suppliers (natural gas, coal, oil)
Engineering, procurement, and construction (EPC) companies
Utilities and electricity distribution companies
Environmental agencies
Banks and Financial Institutions
Companies
Major Players
Siemens Energy
Mitsubishi Power
Duke Energy Corporation
Southern Company
NRG Energy
NextEra Energy
Exelon Corporation
American Electric Power
Vistra Energy
FirstEnergy
Dominion Energy
Entergy Corporation
AES Corporation
Calpine Corporation
Table of Contents
US Thermal Power Market Overview
1.1. Definition and Scope
1.2. Market Taxonomy
1.3. Market Growth Rate
1.4. Market Segmentation Overview
US Thermal Power Market Size (In USD Mn)
2.1. Historical Market Size
2.2. Year-On-Year Growth Analysis
2.3. Key Market Developments and Milestones
US Thermal Power Market Analysis
3.1. Growth Drivers
3.1.1. Increase in Energy Demand
3.1.2. Technological Advancements in Power Generation
3.1.3. Government Regulations Favoring Power Projects
3.2. Market Challenges
3.2.1. Environmental Concerns Related to Emissions
3.2.2. High Initial Capital Costs
3.2.3. Shift Toward Renewable Energy
3.3. Opportunities
3.3.1. Development of Carbon Capture Technologies
3.3.2. Expansion into Rural and Industrial Power Supply
3.3.3. International Collaborations in Power Projects
3.4. Trends
3.4.1. Increased Use of Combined Cycle Power Plants
3.4.2. Integration of AI in Plant Management
3.4.3. Growth in Natural Gas-Fired Power Plants
3.5. Government Regulation
3.5.1. Clean Air Act and Emission Standards
3.5.2. Subsidies for Energy-Efficient Technologies
3.5.3. Public-Private Partnerships in Power Infrastructure
3.6. SWOT Analysis
3.7. Stake Ecosystem
3.8. Porters Five Forces Analysis
3.9. Competition Ecosystem
US Thermal Power Market Segmentation
4.1. By Fuel Type (In Value %)
4.1.1. Coal
4.1.2. Natural Gas
4.1.3. Oil
4.2. By Technology (In Value %)
4.2.1. Combined Cycle
4.2.2. Cogeneration
4.2.3. Open Cycle
4.3. By End-User (In Value %)
4.3.1. Industrial
4.3.2. Residential
4.3.3. Commercial
4.4. By Plant Type (In Value %)
4.4.1. Base Load Plants
4.4.2. Peak Load Plants
4.5. By Region (In Value %)
4.5.1. Midwest
4.5.2. Northeast
4.5.3. West
4.5.4. South
US Thermal Power Market Competitive Analysis
5.1. Detailed Profiles of Major Companies
5.1.1. General Electric
5.1.2. Siemens Energy
5.1.3. Mitsubishi Power
5.1.4. Duke Energy Corporation
5.1.5. Southern Company
5.1.6. NRG Energy
5.1.7. NextEra Energy
5.1.8. Exelon Corporation
5.1.9. American Electric Power
5.1.10. Vistra Energy
5.1.11. FirstEnergy
5.1.12. Dominion Energy
5.1.13. Entergy Corporation
5.1.14. AES Corporation
5.1.15. Calpine Corporation
5.2. Cross Comparison Parameters (Revenue, Operational Capacity, No. of Employees, Technology Expertise, Fuel Portfolio, Geographical Presence, Carbon Footprint, Power Generation Mix)
5.3. Market Share Analysis
5.4. Strategic Initiatives
5.5. Mergers and Acquisitions
5.6. Investment Analysis
5.7. Venture Capital Funding
5.8. Private Equity Investments
US Thermal Power Market Regulatory Framework
6.1. Environmental Standards and Compliance
6.2. Permitting and Licensing Requirements
6.3. Carbon Emission Policies
US Thermal Power Future Market Size (In USD Mn)
7.1. Future Market Size Projections
7.2. Key Factors Driving Future Growth
US Thermal Power Future Market Segmentation
8.1. By Fuel Type (In Value %)
8.2. By Technology (In Value %)
8.3. By End-User (In Value %)
8.4. By Plant Type (In Value %)
8.5. By Region (In Value %)
US Thermal Power Market Analysts Recommendations
9.1. TAM/SAM/SOM Analysis
9.2. Risk Mitigation Strategies
9.3. Investment Opportunities
Research Methodology
Step 1: Identification of Key Variables
The initial phase involves constructing an ecosystem map encompassing all major stakeholders within the US Thermal Power Market. This step is underpinned by extensive desk research, utilizing a combination of secondary and proprietary databases to gather comprehensive industry-level information. The primary objective is to identify and define the critical variables that influence market dynamics.
Step 2: Market Analysis and Construction
In this phase, historical data pertaining to the US Thermal Power Market is compiled and analyzed. This includes assessing market penetration, the ratio of power plants to consumers, and the resultant revenue generation. Furthermore, an evaluation of operational efficiency statistics will be conducted to ensure the reliability and accuracy of the revenue estimates.
Step 3: Hypothesis Validation and Expert Consultation
Market hypotheses will be developed and subsequently validated through computer-assisted telephone interviews (CATIs) with industry experts representing a diverse array of companies. These consultations will provide valuable operational and financial insights directly from industry practitioners, which will be instrumental in refining and corroborating the market data.
Step 4: Research Synthesis and Final Output
The final phase involves direct engagement with multiple thermal power plant operators to acquire detailed insights into fuel segments, plant efficiency, operational challenges, and consumer preferences. This interaction will serve to verify and complement the statistics derived from the bottom-up approach, ensuring a comprehensive, accurate, and validated analysis of the US Thermal Power Market.
Frequently Asked Questions
01 How big is the US Thermal Power Market?
The US thermal power market was valued at USD 180 million, driven by increasing electricity demand, strong industrial output, and government initiatives supporting cleaner power generation technologies.
02 What are the challenges in the US Thermal Power Market?
The US thermal power market faces challenges such as stringent environmental regulations, high initial capital investment, and competition from renewable energy sources. Additionally, the rising operational costs of older coal plants create further challenges.
03 Who are the major players in the US Thermal Power Market?
Key players in the US thermal power market include General Electric, Siemens Energy, Mitsubishi Power, Duke Energy Corporation, and Southern Company. These companies maintain leadership through their large operational capacities and technological advancements.
04 What are the growth drivers of the US Thermal Power Market?
Growth in the US thermal power market is driven by factors like the increasing adoption of natural gas, government support for cleaner technologies, and the need for stable electricity supply in the industrial and commercial sectors.
05 What are the trends in the US Thermal Power Market?
Notable trends in the US thermal power market include the adoption of combined cycle power plants, integration of artificial intelligence in plant management, and the increasing role of carbon capture and storage technologies.
Why Buy From Us?
 Framework")
What makes us stand out is that our consultants follows Robust, Refine and Result (RRR) methodology. i.e. Robust for clear definitions, approaches and sanity checking, Refine for differentiating respondents facts and opinions and Result for presenting data with story

We have set a benchmark in the industry by offering our clients with syndicated and customized market research reports featuring coverage of entire market as well as meticulous research and analyst insights.

While we don't replace traditional research, we flip the method upside down. Our dual approach of Top Bottom & Bottom Top ensures quality deliverable by not just verifying company fundamentals but also looking at the sector and macroeconomic factors.

With one step in the future, our research team constantly tries to show you the bigger picture. We help with some of the tough questions you may encounter along the way: How is the industry positioned? Best marketing channel? KPI's of competitors? By aligning every element, we help maximize success.

Our report gives you instant access to the answers and sources that other companies might choose to hide. We elaborate each steps of research methodology we have used and showcase you the sample size to earn your trust.

If you need any support, we are here! We pride ourselves on universe strength, data quality, and quick, friendly, and professional service.