
US Tractor and Combine Harvesters Market Outlook to 2024
By Tractor Type (2WD and 4WD), By Tractor HP (<40 HP, 40-100 HP and >100 HP) and By Combine Harvester HP (Upto 250 HP, 250-350 HP and Above 350 HP)
Region:North America
Product Code:KR916
Region:North America
Product Code:KR916
November 2019
109
By Tractor Type
By Tractor HP (For Two-Wheel Drive Tractors)
By Combine Harvesters HP
2.1. Market Definitions
2.2. Abbreviations
2.3. Market Sizing and Modeling
2.4. Market Sizing- Agricultural Equipment
2.5. Variables (Dependent and Independent)
2.6. Correlation Matrix
2.7. Regression Matrix
2.8. Limitations & Final Conclusions
2.9Limitations
2.10Final Conclusion
3.1. Evolution of US Agricultural Equipment Market
Supply Side Evolution
Demand side evolution
3.2. Overview of Agricultural Pattern in US, 2018
3.3. US Farming Overview
3.3.1. Contribution of Agriculture in US GDP
3.3.2. Land Under Cultivation And Distribution Of Major Crops
3.3.3. Change in Cropping Pattern
3.3.4. Farm Holding Structure/ Nature Of Ownership
5.1Value Chain Flow chart for importing brands, 2018
5.2Value chain flow chart for market with domestic oem’s, 2018
5.3Role & Overview Of Various Entities, 2018
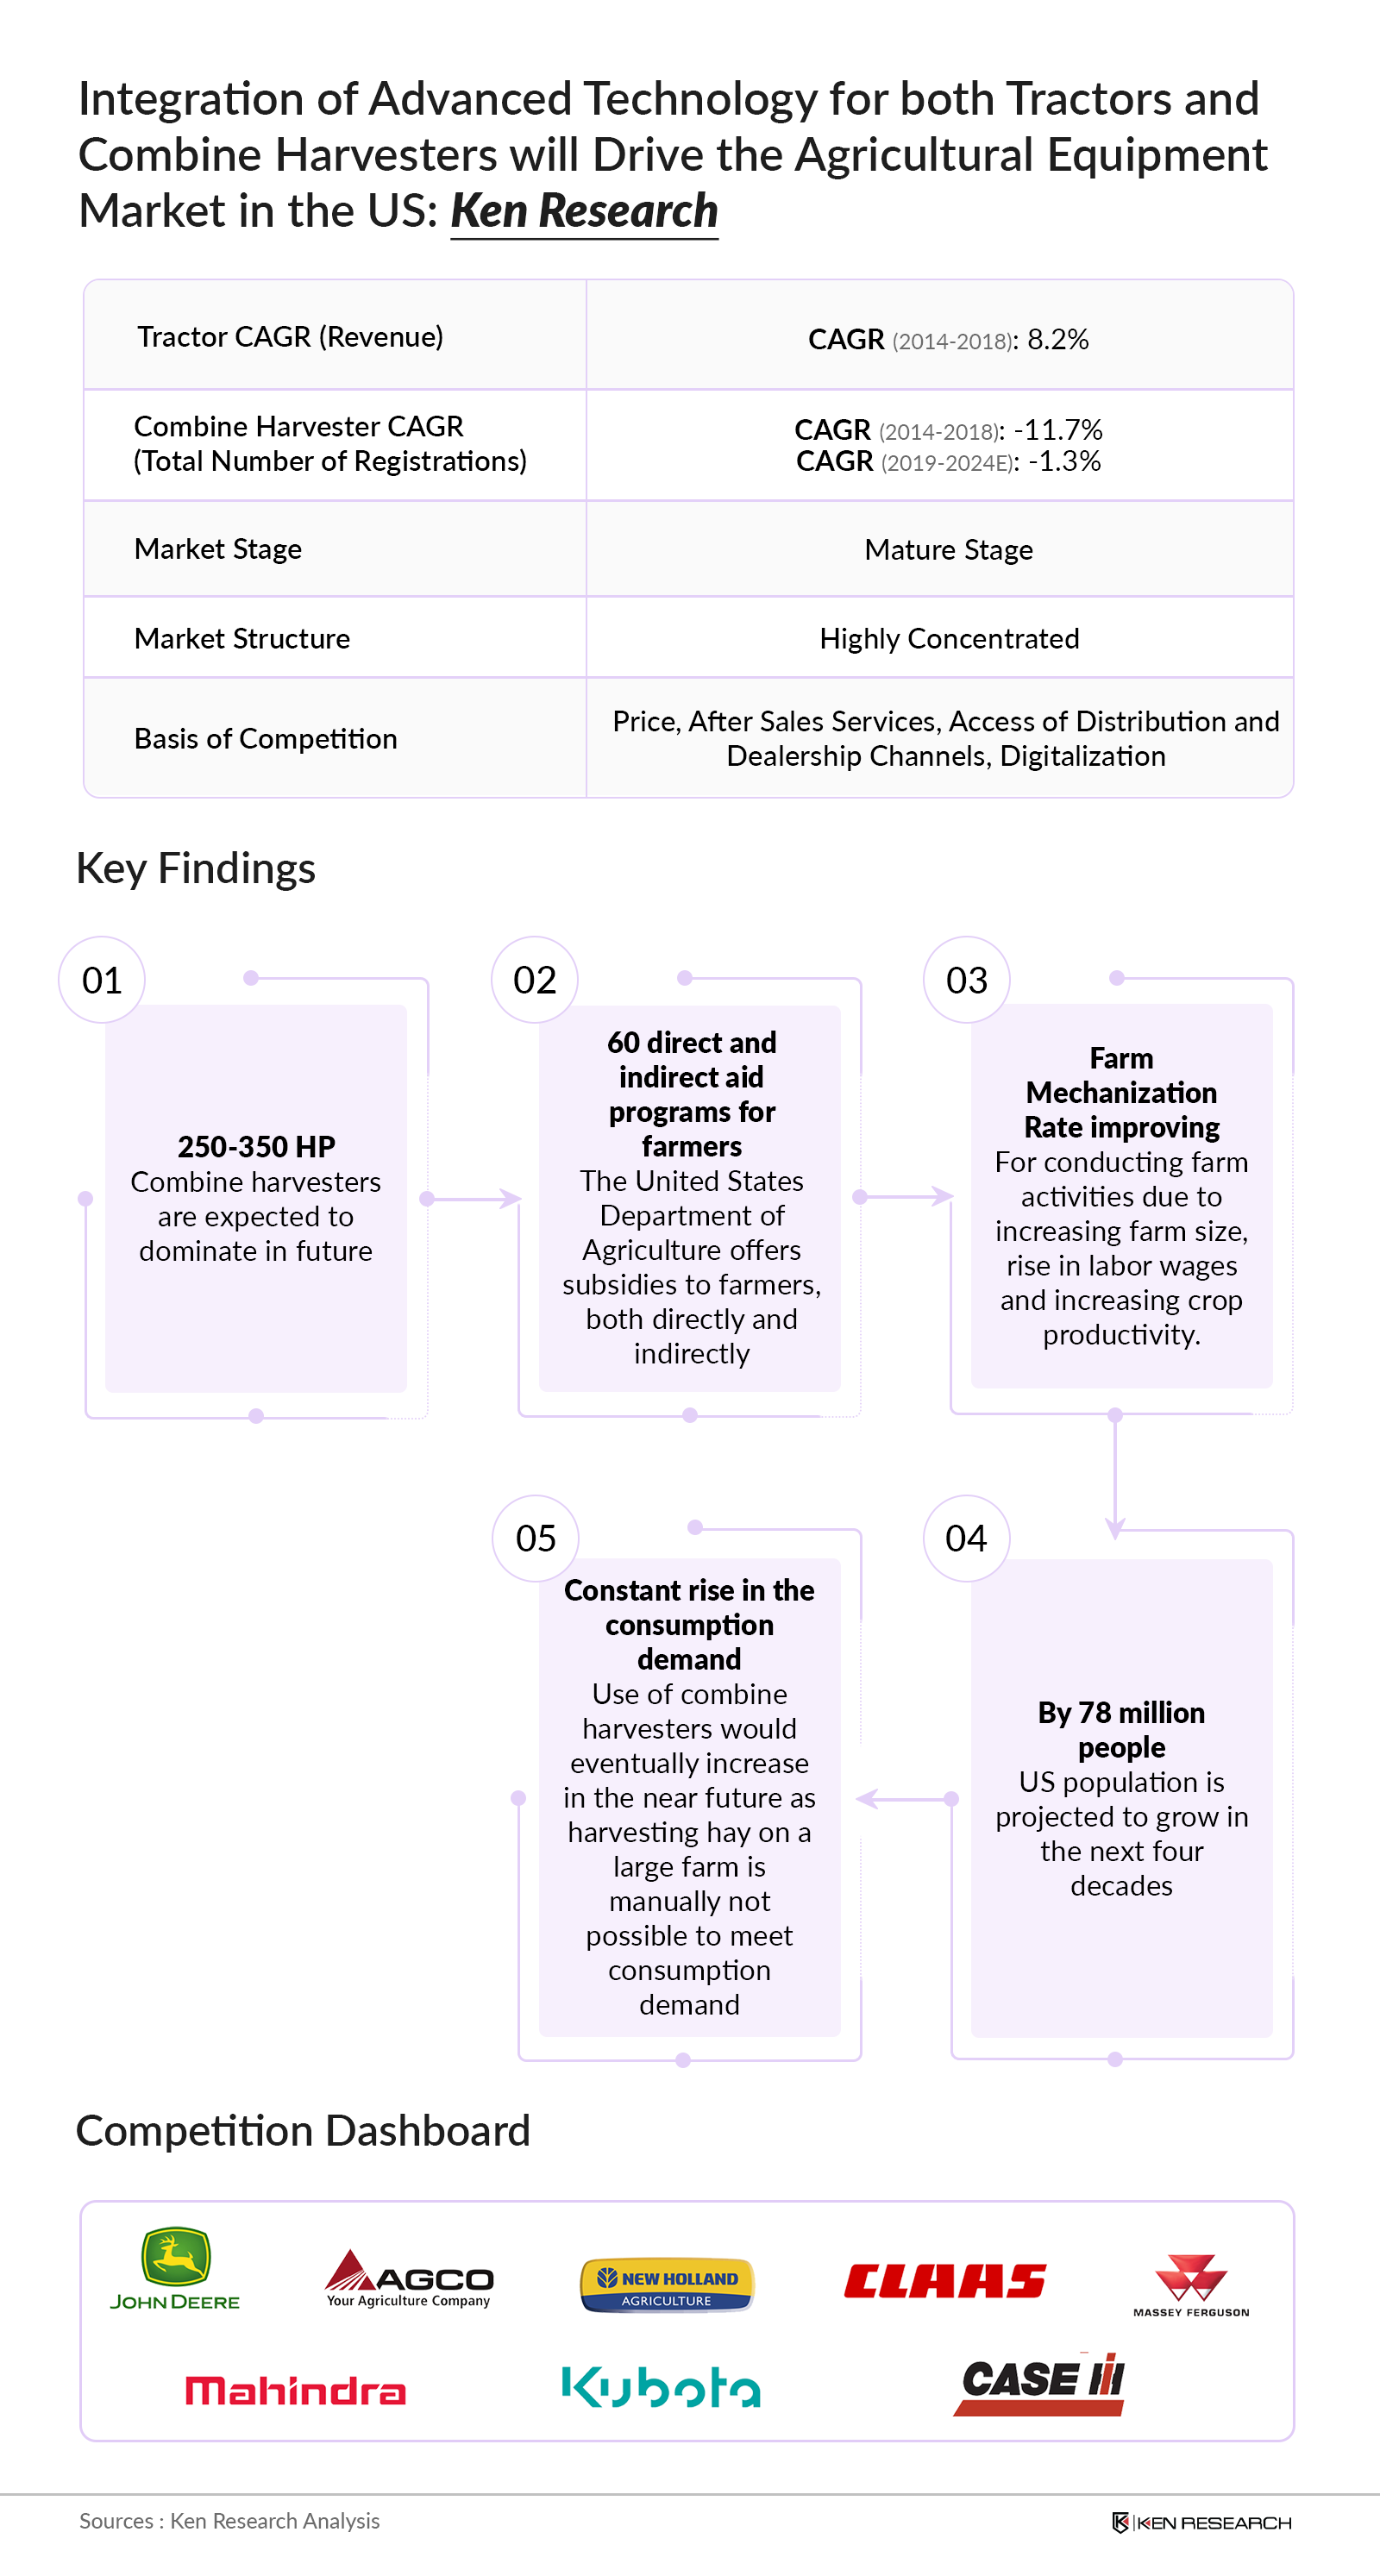
6.1. US Tractor Market Size, 2014-2018
6.2. Best Selling Tractor Model, 2018
6.3. US Tractor Market Segmentation (By Wheel Type & HP), 2014-2018
2 Wheel Drive Tractors further Market Segmentation By HP (6.4. US Tractor Market Trade Scenario
(Import and Export Value), 2014-2018
6.5. Us Tractor Market Future Outlook And Projections, 2019-2024
7.1. US Combine Harvesters Market Size, 2014-2018
7.2. US Combine Harvester Market Segmentation By HP (Up to 250 HP, 250-350 HP & Above 350 HP),
2018
7.3. US Combine Harvesters Market, Trade Scenario, 2014-2018
7.4. US Combine Harvester Market Future Outlook and Projections, 2019-2024E
9.1Decision Making Parameter For Tractors, 2018
9.2Decision Making Parameters For Combine Harvesters, 2018
9.3Pain Points Of Farmers, 2018
10.1. Snapshot of Agriculture Equipment Second Hand Market, 2014-2024
10.2. US Agriculture Equipment Financing Market, 2014-2024
10.3. US Agriculture Equipment Rental Market, 2014-2024
10.4. US Agriculture Equipment After Market Services, 2014-2024
11.1. Competition Scenario in US Tractors & Combine Harvesters Market, 2018
11.2. Market Share of Major Players Operating in US Tractors Market (By Sales Volume), 2014-
2018
11.3. Market Share of Major Players Operating in US Combine Harvesters Market (By Sales
Volume), 2014-2018
11.4. Strengths and Weaknesses Of Major Players, 2018
11.5. Company Profiling Of Major Players Operating in US Tractor & Harvester Market
11.5.1. John Deere
11.5.2. CNH Industrial
11.5.3. AGCO
11.5.4. Kubota
11.5.5. Claas
11.5.6. Mahindra
11.5.7. Other Players (Kioti, Yanmar, Zetor, Ventrac, Farmtrac, Deutz Fahr, Challenger,
International Harvester, MacDon and Colombo), 2018
 Framework")
What makes us stand out is that our consultants follows Robust, Refine and Result (RRR) methodology. i.e. Robust for clear definitions, approaches and sanity checking, Refine for differentiating respondents facts and opinions and Result for presenting data with story

We have set a benchmark in the industry by offering our clients with syndicated and customized market research reports featuring coverage of entire market as well as meticulous research and analyst insights.

While we don't replace traditional research, we flip the method upside down. Our dual approach of Top Bottom & Bottom Top ensures quality deliverable by not just verifying company fundamentals but also looking at the sector and macroeconomic factors.

With one step in the future, our research team constantly tries to show you the bigger picture. We help with some of the tough questions you may encounter along the way: How is the industry positioned? Best marketing channel? KPI's of competitors? By aligning every element, we help maximize success.

Our report gives you instant access to the answers and sources that other companies might choose to hide. We elaborate each steps of research methodology we have used and showcase you the sample size to earn your trust.

If you need any support, we are here! We pride ourselves on universe strength, data quality, and quick, friendly, and professional service.