
USA Amusement Parks Market Outlook to 2030
Region:United States
Author(s):Meenakshi Bisht
Product Code:KROD7889
Region:United States
Author(s):Meenakshi Bisht
Product Code:KROD7889
December 2024
82
Listen to the audio summary
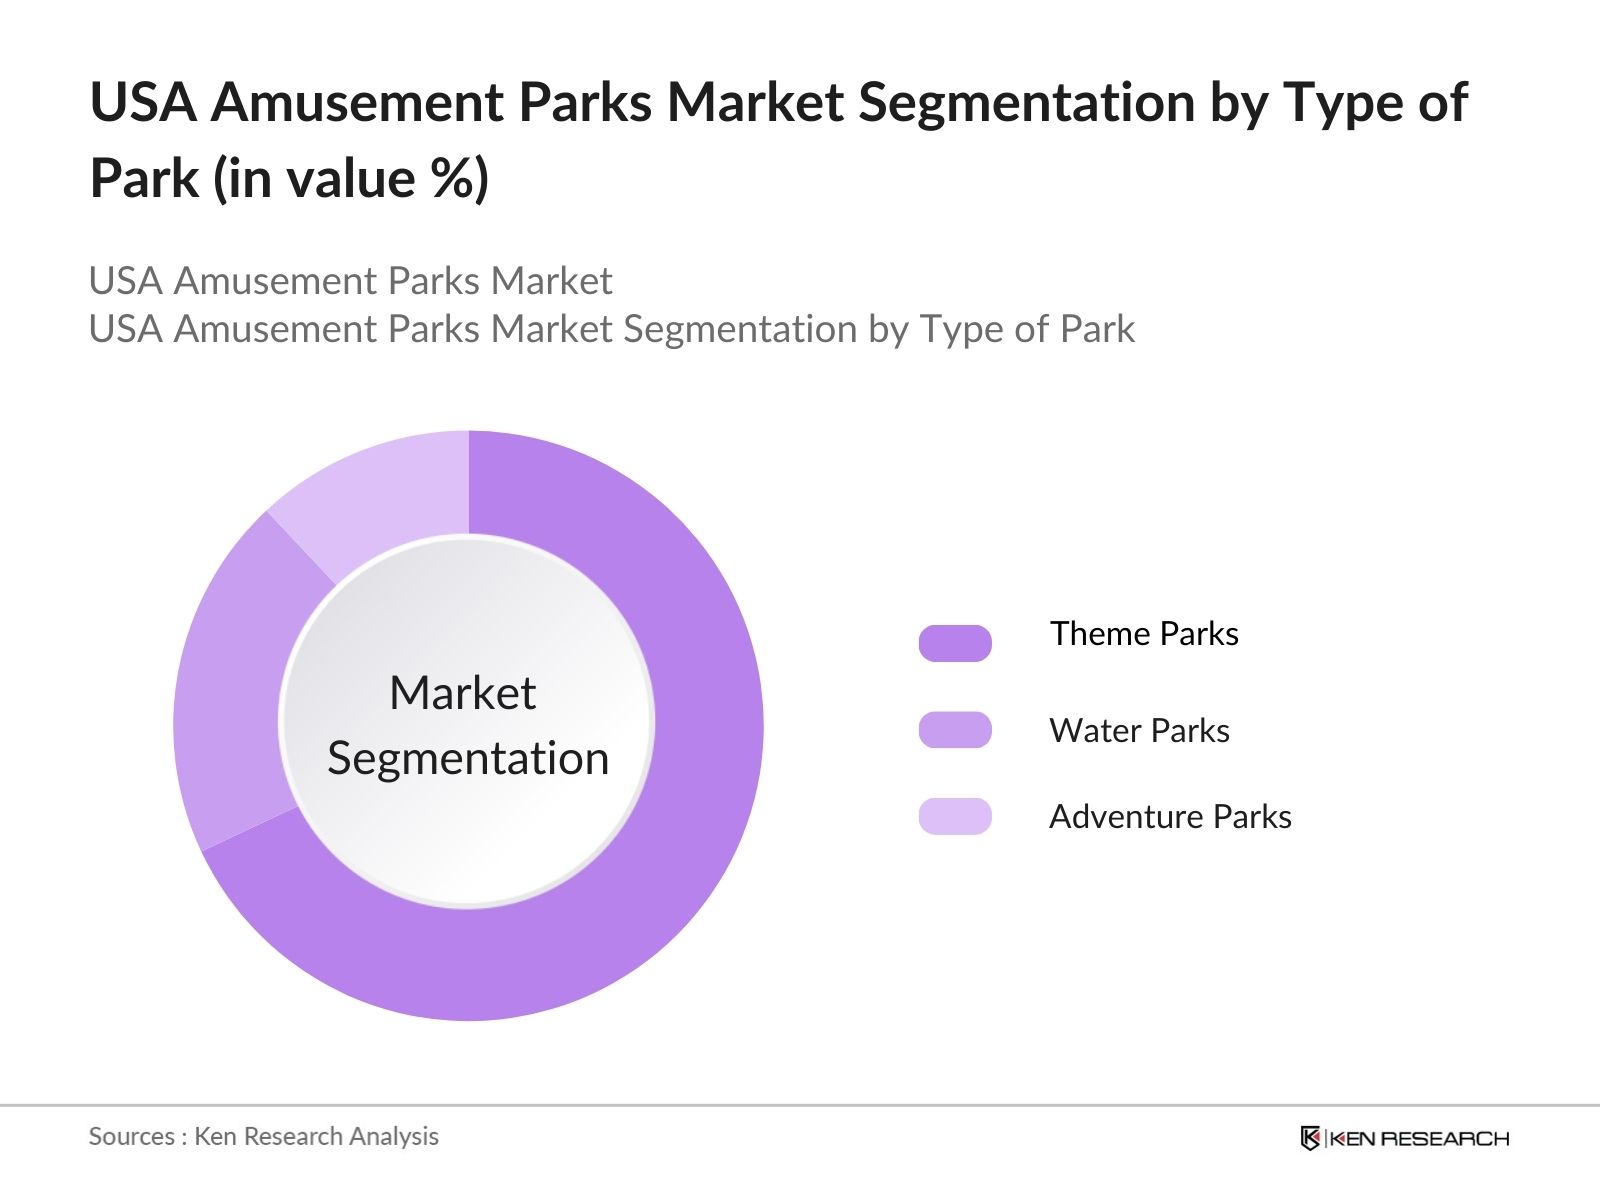
By Type of Park: The USA amusement parks market is segmented by type of park into theme parks, water parks, and adventure parks. Theme parks have a dominant market share, owing to their strong branding, immersive themed experiences, and continuous innovations in ride technologies. Major parks like Disneyland, Universal Studios, and Six Flags focus on delivering unique narratives and integrating high-tech entertainment options, making them extremely popular. In contrast, water parks are seeing growth due to rising consumer interest in summer recreational activities, but they lag behind theme parks in terms of revenue.
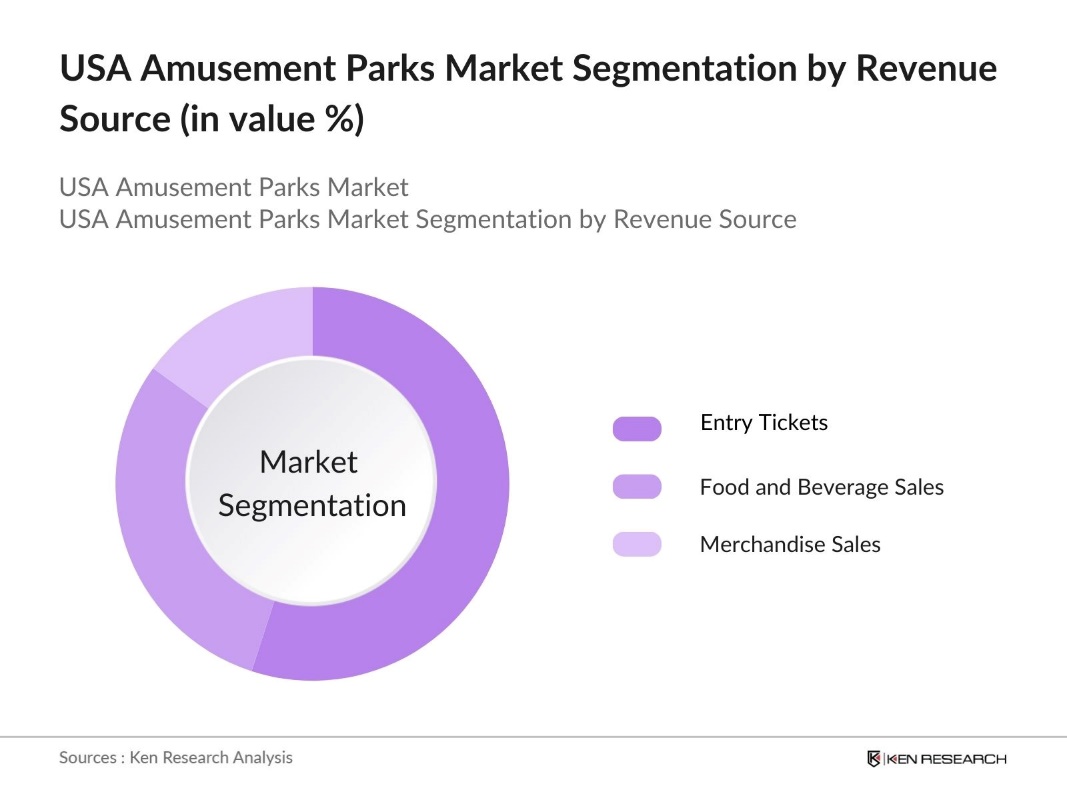
By Revenue Source: The market is also segmented by revenue source into entry tickets, food and beverage sales, and merchandise sales. Entry tickets remain the largest source of revenue for amusement parks, contributing significantly due to rising ticket prices, the introduction of multi-day passes, and fast pass options. Parks like Disney and Universal continue to attract millions of visitors annually, securing revenue through ticket sales. Additionally, food and beverage sales contribute significantly as parks expand their dining options with gourmet, themed, and diverse offerings, enhancing the overall guest experience.
The USA amusement parks market is dominated by key players who have established a strong presence through a combination of brand recognition, innovative attractions, and superior customer experiences. Major players include The Walt Disney Company and Universal Parks & Resorts, which lead the market due to their extensive range of parks, global brand equity, and ability to attract millions of tourists annually. Other notable players include Six Flags, Cedar Fair, and SeaWorld, which cater to both thrill-seekers and families.
|
Company Name |
Establishment Year |
Headquarters |
No. of Parks |
Annual Visitor Footfall |
Revenue (USD Billion) |
Key Attractions |
Seasonality |
Ride Technology |
|
The Walt Disney Company |
1923 |
Burbank, California |
||||||
|
Universal Parks & Resorts |
1964 |
Orlando, Florida |
||||||
|
Six Flags Entertainment |
1961 |
Arlington, Texas |
||||||
|
Cedar Fair Entertainment |
1983 |
Sandusky, Ohio |
||||||
|
SeaWorld Parks & Entertainment |
1964 |
Orlando, Florida |
Over the next five years, the USA amusement parks market is expected to experience substantial growth, driven by technological advancements, increased tourist influx, and a growing emphasis on sustainability. The integration of augmented reality (AR) and virtual reality (VR) attractions, coupled with the use of app-based guest services like virtual queuing, is expected to revolutionize the guest experience. Parks will also continue to prioritize eco-friendly practices, from renewable energy usage to waste management systems, in response to increasing environmental concerns.
|
By Type of Park |
Theme Parks Water Parks Adventure Parks |
|
By Type of Visitor |
Domestic Visitors International Visitors |
|
By Revenue Source |
Entry Tickets Food and Beverage Sales Merchandise Sales |
|
By Age Group |
Children Teens Adults |
|
By Region |
West Coast East Coast Midwest South |
1.1. Definition and Scope
1.2. Market Taxonomy
1.3. Market Growth Rate (Annual Visitor Growth, Park Expansion Rate)
1.4. Market Segmentation Overview
2.1. Historical Market Size
2.2. Year-On-Year Growth Analysis
2.3. Key Market Developments and Milestones (New Ride Installations, Park Expansions)
3.1. Growth Drivers
3.1.1. Tourism Growth
3.1.2. Increase in Disposable Income
3.1.3. Technological Innovations in Attractions (Augmented Reality Rides, Immersive Experiences)
3.1.4. Seasonal Promotions and Ticketing Offers
3.2. Market Challenges
3.2.1. High Operational Costs (Energy, Labor)
3.2.2. Environmental Regulations (Carbon Footprint Management)
3.2.3. Insurance Costs and Safety Regulations
3.3. Opportunities
3.3.1. Increasing Demand for Themed Attractions (IP-based, Hollywood Collaborations)
3.3.2. Expanding Presence in Non-Urban Areas (Suburban Parks)
3.3.3. Enhanced Guest Experience through Technology (App-based Queuing, Virtual Reality Enhancements)
3.4. Trends
3.4.1. Adoption of Eco-Friendly Practices (Solar Energy, Waste Reduction)
3.4.2. Rise of Virtual Queuing Systems
3.4.3. Increasing Popularity of Hybrid Parks (Indoor-Outdoor Experiences)
3.5. Government Regulation
3.5.1. Safety Regulations (OSHA, Ride Safety Audits)
3.5.2. Zoning and Land Use Regulations
3.5.3. Environmental Impact Assessment Laws
3.6. SWOT Analysis
3.7. Stakeholder Ecosystem (Park Owners, Concessionaires, Vendors)
3.8. Porters Five Forces Analysis (Buyer Bargaining Power, Supplier Power, Threat of Substitutes)
3.9. Competition Ecosystem
4.1. By Type of Park (In Value %)
4.1.1. Theme Parks
4.1.2. Water Parks
4.1.3. Adventure Parks
4.2. By Type of Visitor (In Value %)
4.2.1. Domestic Visitors
4.2.2. International Visitors
4.3. By Revenue Source (In Value %)
4.3.1. Entry Tickets
4.3.2. Food and Beverage Sales
4.3.3. Merchandise Sales
4.4. By Age Group (In Value %)
4.4.1. Children
4.4.2. Teens
4.4.3. Adults
4.5. By Region (In Value %)
4.5.1. West Coast
4.5.2. East Coast
4.5.3. Midwest
4.5.4. South
5.1. Detailed Profiles of Major Companies
5.1.1. The Walt Disney Company
5.1.2. Universal Parks & Resorts
5.1.3. Six Flags Entertainment Corporation
5.1.4. Cedar Fair Entertainment Company
5.1.5. SeaWorld Parks & Entertainment
5.1.6. Merlin Entertainments
5.1.7. Herschend Family Entertainment
5.1.8. Legoland
5.1.9. Busch Gardens
5.1.10. Knotts Berry Farm
5.1.11. Dollywood
5.1.12. Great Wolf Lodge
5.1.13. Silver Dollar City
5.1.14. Schlitterbahn Waterparks
5.1.15. Kings Dominion
5.2. Cross Comparison Parameters (Revenue, Number of Parks, Key Attractions, Visitor Numbers, Ticket Prices, Seasonal Operations, Key Technologies, Sustainability Practices)
5.3. Market Share Analysis
5.4. Strategic Initiatives
5.5. Mergers and Acquisitions
5.6. Investment Analysis
5.7. Venture Capital and Private Equity Involvement
5.8. Government Grants and Subsidies
6.1. Safety and Health Regulations
6.2. Environmental Compliance (Waste Management, Energy Use)
6.3. Zoning Laws and Licensing
7.1. Future Market Size Projections
7.2. Key Factors Driving Future Growth (Sustainability Practices, Emerging Technologies)
8.1. By Type of Park (In Value %)
8.2. By Type of Visitor (In Value %)
8.3. By Revenue Source (In Value %)
8.4. By Age Group (In Value %)
8.5. By Region (In Value %)
9.1. TAM/SAM/SOM Analysis
9.2. Guest Experience Optimization (Loyalty Programs, App Integration)
9.3. Marketing and Promotional Strategies
9.4. White Space Opportunity Analysis
Disclaimer Contact UsThis stage begins by constructing a comprehensive ecosystem of all major stakeholders within the USA Amusement Parks Market. Through detailed desk research and secondary data collection, we map the key variables influencing market behavior, including revenue sources, seasonality, and park attendance patterns.
During this phase, historical data related to park visitation, ticket prices, and the popularity of different ride types is analyzed. This includes examining revenue contributions from different sources such as ticket sales and in-park spending, providing insights into market trends and demand drivers.
Market hypotheses are developed and validated through consultations with industry experts and representatives from leading parks. These insights allow us to refine data accuracy and account for practical challenges and operational insights from industry insiders.
In this final stage, the gathered data is synthesized to provide a comprehensive analysis of market dynamics. Further, engagement with park operators helps validate our findings, ensuring accurate representation of the current market landscape and projections for the future.
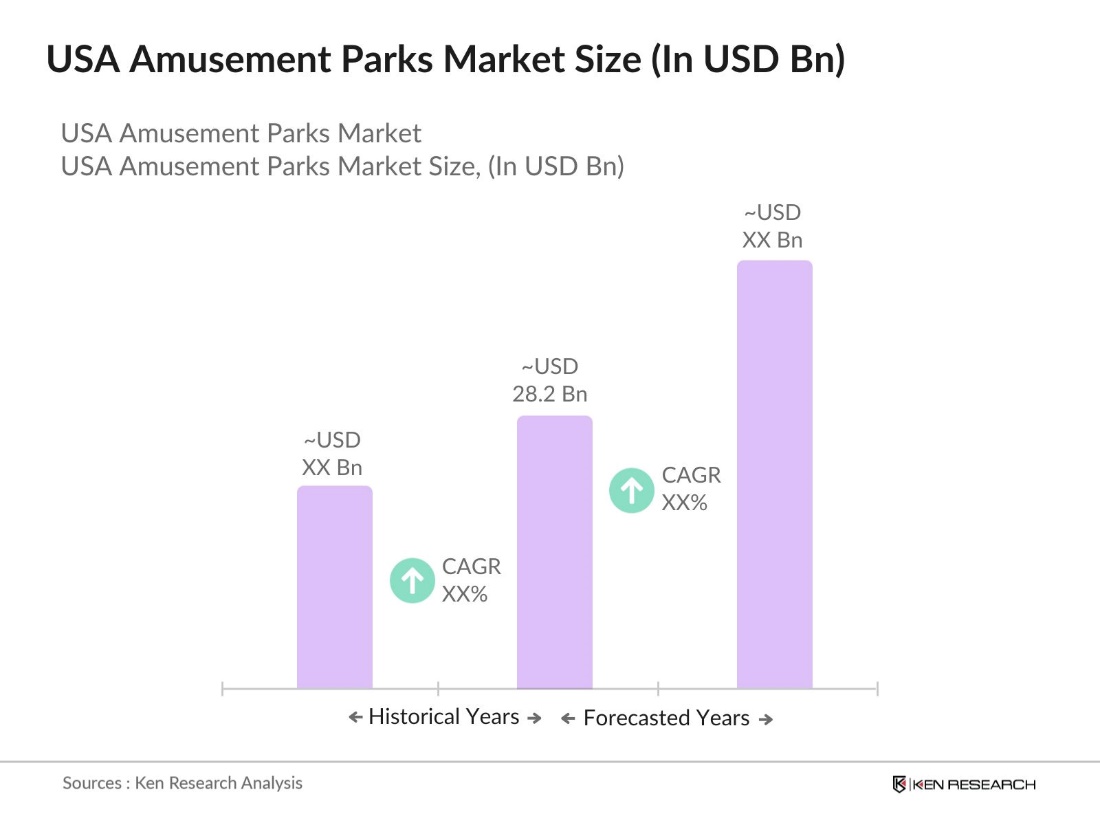
The USA Amusement Parks Market is valued at USD 28.2 billion. This valuation is driven by factors like rising disposable incomes, technological advancements in park attractions, and a growing tourist base.
Key challenges in USA Amusement Parks Market include high operational costs, stringent safety and environmental regulations, and the seasonal nature of many parks, which can lead to fluctuations in revenue.
Major players in USA Amusement Parks Market include The Walt Disney Company, Universal Parks & Resorts, Six Flags Entertainment Corporation, Cedar Fair Entertainment Company, and SeaWorld Parks & Entertainment, all of which dominate due to strong brand presence and extensive park networks.
The USA Amusement Parks Market growth is driven by increasing demand for unique, immersive experiences, advancements in ride technology, and enhanced guest services through digital platforms like mobile apps for ticketing and queuing.
 Framework")
What makes us stand out is that our consultants follows Robust, Refine and Result (RRR) methodology. i.e. Robust for clear definitions, approaches and sanity checking, Refine for differentiating respondents facts and opinions and Result for presenting data with story

We have set a benchmark in the industry by offering our clients with syndicated and customized market research reports featuring coverage of entire market as well as meticulous research and analyst insights.

While we don't replace traditional research, we flip the method upside down. Our dual approach of Top Bottom & Bottom Top ensures quality deliverable by not just verifying company fundamentals but also looking at the sector and macroeconomic factors.

With one step in the future, our research team constantly tries to show you the bigger picture. We help with some of the tough questions you may encounter along the way: How is the industry positioned? Best marketing channel? KPI's of competitors? By aligning every element, we help maximize success.

Our report gives you instant access to the answers and sources that other companies might choose to hide. We elaborate each steps of research methodology we have used and showcase you the sample size to earn your trust.

If you need any support, we are here! We pride ourselves on universe strength, data quality, and quick, friendly, and professional service.