


USA AR Market Outlook to 2030
Region:North America
Author(s):Shubham Kashyap
Product Code:KROD11269
June 2025
80
About the Report
USA AR Market Overview
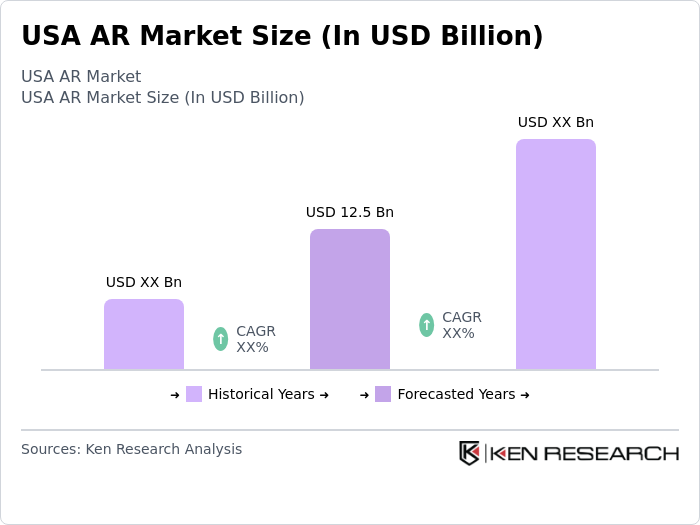
- The USA AR market is currently valued at approximately USD 12.5 billion, reflecting robust growth over the past five years. This expansion is propelled by rapid technological advancements, increased adoption of AR across industries, and strong consumer demand for immersive digital experiences. Both private and public sector investments have played a pivotal role in driving innovation and market growth.
- Key technology hubs such as San Francisco, New York, and Seattle remain dominant in the AR market due to their robust tech ecosystems, access to venture capital, and concentration of skilled talent. The presence of leading technology companies and innovative startups in these regions continues to foster the development and commercialization of advanced AR solutions.
- Recent regulatory efforts in the USA have focused on promoting the safe and ethical use of augmented reality technologies. These include updated guidelines for data privacy, user safety, and compliance with existing digital laws, aiming to balance innovation with consumer protection and responsible technology deployment.
USA AR Market Segmentation
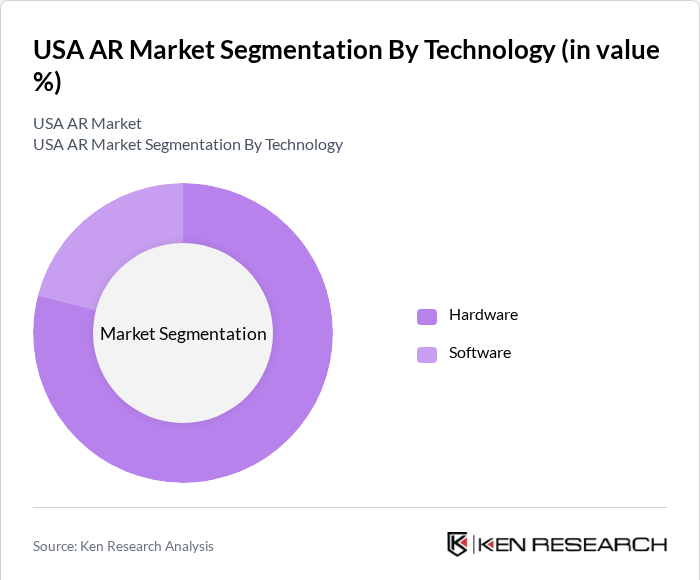
By Technology: The AR market is segmented into hardware and software. The hardware segment, encompassing AR glasses, headsets, and related devices, currently holds the largest market share. This is attributed to rising demand for immersive experiences in sectors such as gaming, healthcare, and enterprise training. The software segment, which includes AR development platforms and applications, is experiencing rapid growth as developers expand the ecosystem with new and innovative AR solutions.
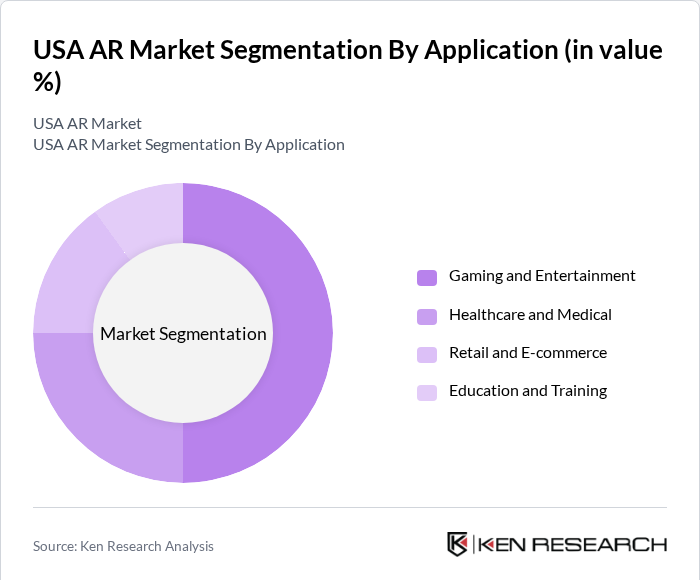
By Application: The AR market is segmented by application into gaming and entertainment, healthcare and medical, retail and e-commerce, and education and training. Gaming and entertainment lead the market, driven by the popularity of interactive AR games and experiences. Healthcare and medical applications are growing rapidly, with AR being used for surgical visualization, diagnostics, and patient education. Retail and e-commerce leverage AR to enhance customer engagement and drive sales, while education and training sectors adopt AR for immersive learning and simulation.
[Source: ]
USA AR Market Competitive Landscape
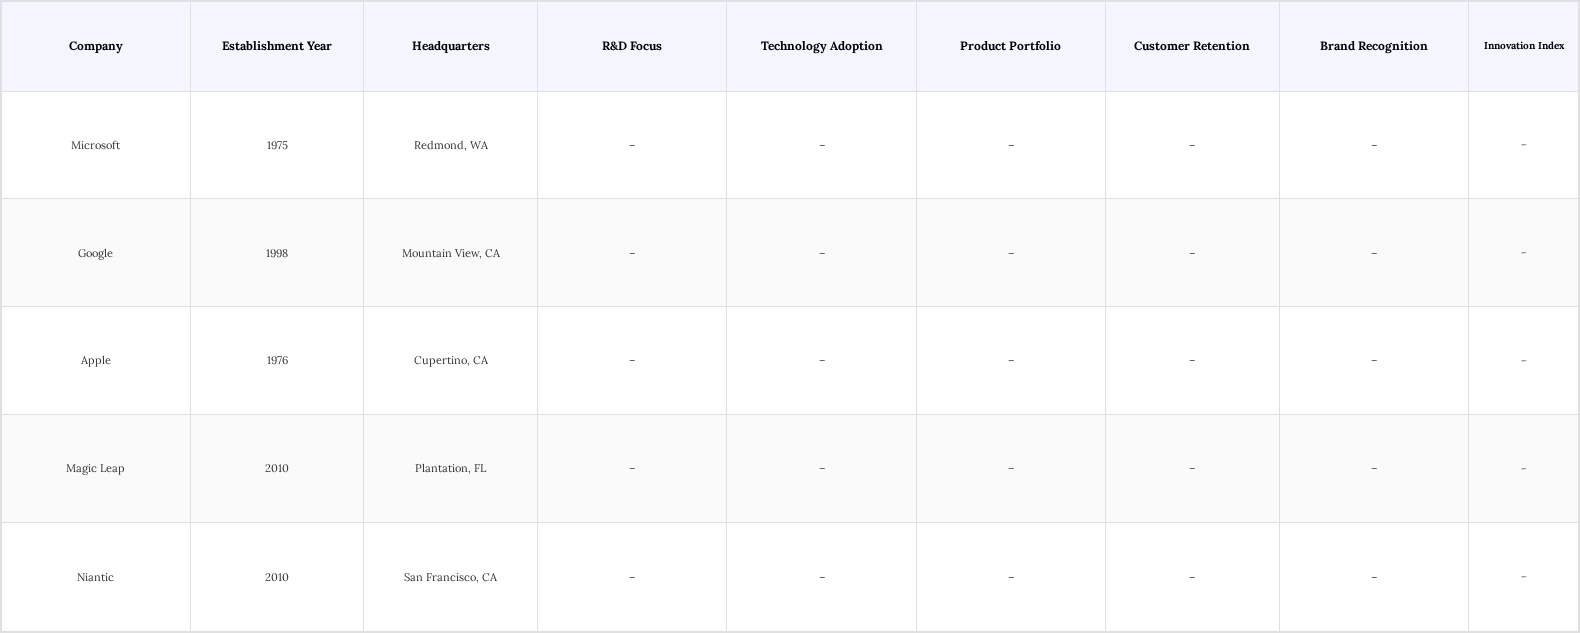
The USA AR market is characterized by a competitive landscape with several key players driving innovation and market growth. Companies such as Microsoft, Google, and Apple are at the forefront, leveraging their technological expertise to develop advanced AR solutions. The market is also witnessing the emergence of startups that focus on niche applications, contributing to a dynamic and rapidly evolving environment.
USA AR Market Industry Analysis
Growth Drivers
- Increasing Adoption of AR in Retail: The retail sector is projected to invest approximately $19.2 billion in AR technologies by 2024, driven by the need for enhanced customer experiences. Retailers are leveraging AR to create immersive shopping environments, allowing consumers to visualize products in their own space. This trend is supported by a 15% increase in online shopping, as consumers seek interactive and engaging experiences. The integration of AR in retail is expected to boost sales and customer satisfaction significantly.
- Rising Demand for AR in Healthcare: The healthcare industry is anticipated to allocate billions to AR solutions by 2024, focusing on training and patient engagement. AR technologies are being utilized for surgical simulations and patient education, enhancing the overall quality of care. A report from the World Health Organization indicates that 70% of healthcare professionals believe AR can improve training outcomes, driving further investment in this sector. This growing demand is a key driver for AR market expansion.
- Technological Advancements in AR Solutions: Continuous advancements in AR hardware and software are driving market growth by reducing costs and enhancing accessibility. Innovations like lightweight smart glasses, improved sensors, and more intuitive software platforms are making AR increasingly user-friendly and practical across industries such as healthcare, retail, and education. Industry reports show that about 60% of companies plan to adopt AR technologies within the next two years, reflecting strong corporate interest. Additionally, integration with AI and 5G networks is further boosting AR’s capabilities and adoption rates
Market Challenges
- High Development Costs: The initial investment required for developing AR solutions poses a significant barrier for small to medium enterprises. These high costs are often driven by the need for specialized talent and advanced technology. Financial constraints can slow overall market growth and limit innovation in the sector, especially for businesses with limited budgets.
- Limited Consumer Awareness: Despite the growing potential of AR, consumer awareness remains relatively low. Many individuals are still unfamiliar with AR applications, which can hinder adoption. Concerns about usability and the perceived complexity of the technology may further affect consumer engagement. Overcoming this challenge is essential for unlocking broader market opportunities and driving long-term growth.
USA AR Market Future Outlook
The USA AR market is poised for significant growth as technological advancements continue to enhance user experiences and broaden application areas. With increasing investments in AR by various sectors, including retail and healthcare, the market is expected to evolve rapidly. Additionally, the integration of AR with emerging technologies like AI and 5G will further drive innovation. As consumer awareness improves and development costs decrease, the AR market is likely to witness a surge in adoption, creating new opportunities for businesses and consumers alike.
Market Opportunities
- Expansion in Education: The education sector is increasingly adopting AR for interactive learning experiences, with investments projected to reach USD 3 billion by 2024. AR can enhance engagement and retention rates among students, making learning more effective. Schools and universities are exploring AR applications to create immersive educational content, presenting a significant opportunity for AR developers to cater to this growing demand.
- Growth in Gaming and Entertainment: The gaming industry is expected to invest over $8 billion in AR technologies by 2024, driven by the popularity of immersive gaming experiences. As AR games gain traction, developers have the opportunity to create innovative content that captivates users. This growth in the gaming sector presents a lucrative market for AR applications, with potential for substantial returns on investment.
Scope of the Report
| By Technology |
Hardware Software |
| By Application |
Gaming and Entertainment Healthcare and Medical Retail and E-Commerce Education and Training |
| By End-User |
Consumer Enterprise Government |
| By Region |
North America Europe Asia-Pacific Latin America Middle East & Africa |
| By Distribution Channel |
Online Offline |
| By Device Type |
Smartphones Tablets Smart Glasses Head-Mounted Displays |
Products
Key Target Audience
Investors and Venture Capitalist Firms
Government and Regulatory Bodies (e.g., Federal Communications Commission, National Institute of Standards and Technology)
Manufacturers and Producers
Distributors and Retailers
Technology Providers
Industry Associations (e.g., Consumer Technology Association, Augmented Reality Developers Association)
Financial Institutions
Telecommunications Companies
Companies
Players Mentioned in the Report:
Microsoft
Google
Apple
Magic Leap
Niantic
VividAR
HoloVista
Augmentify
RealityForge
Immersive Innovations
Table of Contents
1. USA AR Market Overview
1.1. Definition and Scope
1.2. Market Taxonomy
1.3. Market Growth Rate
1.4. Market Segmentation Overview
2. USA AR Market Size (In USD Bn)
2.1. Historical Market Size
2.2. Year-On-Year Growth Analysis
2.3. Key Market Developments and Milestones
3. USA AR Market Analysis
3.1. Growth Drivers
3.1.1. Increasing Adoption of AR in Retail for Enhanced Customer Experience
3.1.2. Rising Demand for AR in Healthcare for Training and Patient Engagement
3.1.3. Technological Advancements in AR Hardware and Software Solutions
3.2. Market Challenges
3.2.1. High Development Costs Associated with AR Solutions
3.2.2. Limited Awareness and Understanding of AR Technology Among Consumers
3.2.3. Privacy and Security Concerns Related to AR Applications
3.3. Opportunities
3.3.1. Expansion of AR in Education for Interactive Learning Experiences
3.3.2. Growth of AR in Gaming and Entertainment Sectors
3.3.3. Potential for AR in Real Estate for Virtual Property Tours
3.4. Trends
3.4.1. Integration of AI with AR for Enhanced User Experiences
3.4.2. Increasing Use of AR in Remote Work and Collaboration Tools
3.4.3. Development of 5G Technology to Support AR Applications
3.5. Government Regulation
3.5.1. Overview of Federal Regulations Impacting AR Technology
3.5.2. State-Level Initiatives Supporting AR Development
3.5.3. Compliance with Data Protection Laws in AR Applications
3.5.4. Standards for Safety and Performance in AR Devices
3.6. SWOT Analysis
3.7. Stake Ecosystem
3.8. Porter’s Five Forces
3.9. Competition Ecosystem
4. USA AR Market Segmentation
4.1. By Technology
4.1.1. Hardware
4.1.2. Software
4.2. By Application
4.2.1. Gaming and Entertainment
4.2.2. Healthcare and Medical
4.2.3. Retail and E-Commerce
4.2.4. Education and Training
4.3. By End-User
4.3.1. Consumer
4.3.2. Enterprise
4.3.3. Government
4.4. By Region
4.4.1. North America
4.4.2. Europe
4.4.3. Asia-Pacific
4.4.4. Latin America
4.4.5. Middle East & Africa
4.5. By Distribution Channel
4.5.1. Online
4.5.2. Offline
4.6. By Device Type
4.6.1. Smartphones
4.6.2. Tablets
4.6.3. Smart Glasses
4.6.4. Head-Mounted Displays
5. USA AR Market Competitive Analysis
5.1. Detailed Profiles of Major Companies
5.1.1. Microsoft
5.1.2. Google
5.1.3. Apple
5.1.4. Magic Leap
5.1.5. Niantic
5.1.6. VividAR
5.1.7. HoloVista
5.1.8. Augmentify
5.1.9. RealityForge
5.1.10. Immersive Innovations
5.2. Cross Comparison Parameters
5.2.1. Market Share
5.2.2. Revenue Growth Rate
5.2.3. Product Portfolio Diversity
5.2.4. Geographic Presence
5.2.5. R&D Investment
5.2.6. Customer Satisfaction Ratings
5.2.7. Strategic Partnerships and Collaborations
5.2.8. Innovation and Technology Adoption
6. USA AR Market Regulatory Framework
6.1. Environmental Standards
6.2. Compliance Requirements
6.3. Certification Processes
7. USA AR Market Future Market Size (In USD Bn)
7.1. Future Market Size Projections
7.2. Key Factors Driving Future Market Growth
8. USA AR Market Future Market Segmentation
8.1. By Technology
8.1.1. Hardware
8.1.2. Software
8.2. By Application
8.2.1. Gaming and Entertainment
8.2.2. Healthcare and Medical
8.2.3. Retail and E-Commerce
8.2.4. Education and Training
8.3. By End-User
8.3.1. Consumer
8.3.2. Enterprise
8.3.3. Government
8.4. By Region
8.4.1. North America
8.4.2. Europe
8.4.3. Asia-Pacific
8.4.4. Latin America
8.4.5. Middle East & Africa
8.5. By Distribution Channel
8.5.1. Online
8.5.2. Offline
8.6. By Device Type
8.6.1. Smartphones
8.6.2. Tablets
8.6.3. Smart Glasses
8.6.4. Head-Mounted Displays
9. USA AR Market Analysts’ Recommendations
9.1. TAM/SAM/SOM Analysis
9.2. Customer Cohort Analysis
9.3. Marketing Initiatives
9.4. White Space Opportunity Analysis
Research Methodology
Step 1: Identification of Key Variables
The initial phase involves constructing an ecosystem map encompassing all major stakeholders within the USA AR Market. This step is underpinned by extensive desk research, utilizing a combination of secondary and proprietary databases to gather comprehensive industry-level information. The primary objective is to identify and define the critical variables that influence market dynamics.
Step 2: Market Analysis and Construction
In this phase, we will compile and analyze historical data pertaining to the USA AR Market. This includes assessing market penetration, the ratio of marketplaces to service providers, and the resultant revenue generation. Furthermore, an evaluation of service quality statistics will be conducted to ensure the reliability and accuracy of the revenue estimates.
Step 3: Hypothesis Validation and Expert Consultation
Market hypotheses will be developed and subsequently validated through computer-assisted telephone interviews (CATIs) with industry experts representing a diverse array of companies. These consultations will provide valuable operational and financial insights directly from industry practitioners, which will be instrumental in refining and corroborating the market data.
Step 4: Research Synthesis and Final Output
The final phase involves direct engagement with multiple manufacturers to acquire detailed insights into product segments, sales performance, consumer preferences, and other pertinent factors. This interaction will serve to verify and complement the statistics derived from the bottom-up approach, thereby ensuring a comprehensive, accurate, and validated analysis of the USA AR Market.
Frequently Asked Questions
01. How big is the USA AR Market?
The USA AR Market is valued at USD 12.5 billion, driven by factors such as increasing demand, technological advancements, and supportive government initiatives.
02. What are the key challenges in the USA AR Market?
Key challenges in the USA AR Market include intense competition, regulatory complexities, and infrastructure limitations affecting market dynamics.
03. Who are the major players in the USA AR Market?
Major players in the USA AR Market include Microsoft, Google, Apple, Magic Leap, Niantic, among others.
04. What are the growth drivers for the USA AR Market?
The primary growth drivers for the USA AR Market are increasing consumer demand, favorable policies, innovation, and substantial investment inflows.
Why Buy From Us?
 Framework")
What makes us stand out is that our consultants follows Robust, Refine and Result (RRR) methodology. i.e. Robust for clear definitions, approaches and sanity checking, Refine for differentiating respondents facts and opinions and Result for presenting data with story

We have set a benchmark in the industry by offering our clients with syndicated and customized market research reports featuring coverage of entire market as well as meticulous research and analyst insights.

While we don't replace traditional research, we flip the method upside down. Our dual approach of Top Bottom & Bottom Top ensures quality deliverable by not just verifying company fundamentals but also looking at the sector and macroeconomic factors.

With one step in the future, our research team constantly tries to show you the bigger picture. We help with some of the tough questions you may encounter along the way: How is the industry positioned? Best marketing channel? KPI's of competitors? By aligning every element, we help maximize success.

Our report gives you instant access to the answers and sources that other companies might choose to hide. We elaborate each steps of research methodology we have used and showcase you the sample size to earn your trust.

If you need any support, we are here! We pride ourselves on universe strength, data quality, and quick, friendly, and professional service.