


USA Augmented and Virtual Reality Market Outlook to 2030
Region:North America
Author(s):Sanjeev
Product Code:KROD2463
October 2024
100
About the Report
USA Augmented and Virtual Reality Market Overview
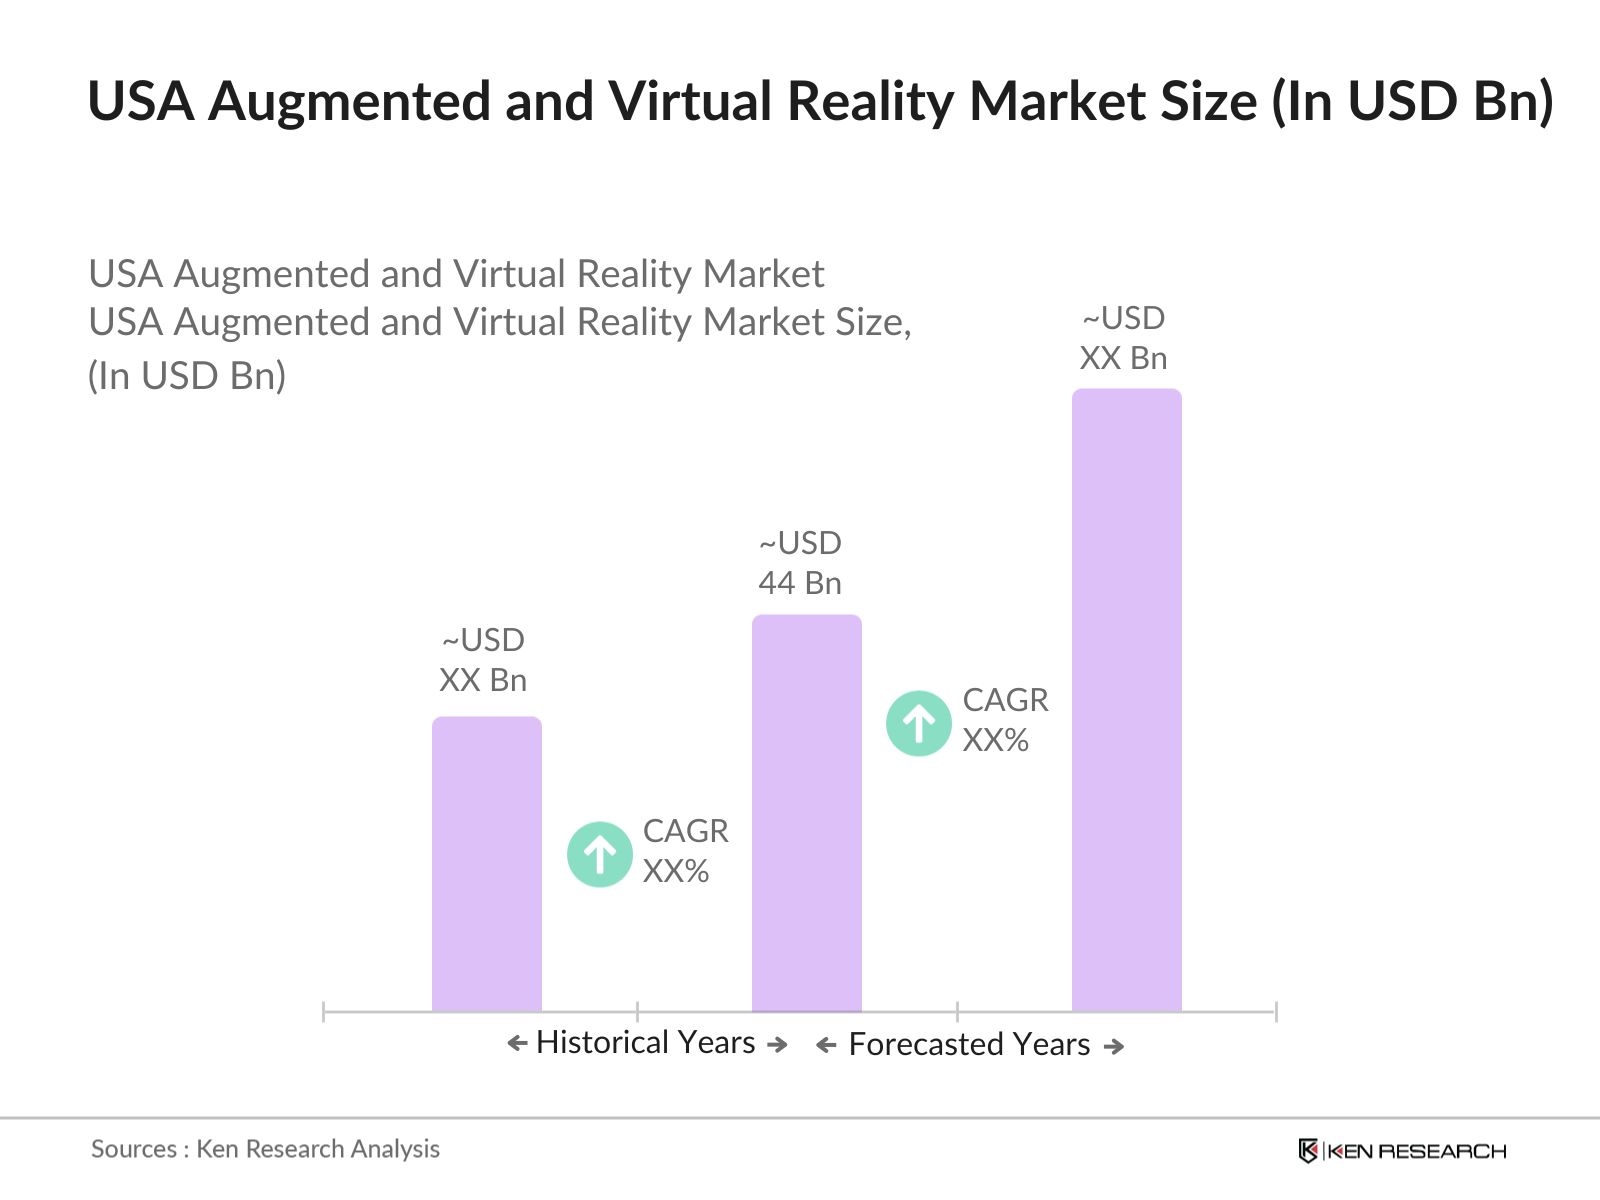
- The USA Augmented and Virtual Reality Market is valued at USD 44 billion, driven by the increasing integration of AR and VR technologies in various sectors such as gaming, healthcare, and education. This market growth is supported by advancements in hardware, including headsets and sensors, along with rising consumer demand for immersive experiences. The acceleration of digital transformation and improvements in connectivity, particularly with the rollout of 5G technology, also contribute significantly to market expansion. Sources such as the International Data Corporation (IDC) highlight the substantial investments being made in AR and VR solutions across industries.
- Major cities such as San Francisco, New York, and Los Angeles dominate the USA augmented and virtual reality market due to their vibrant technology ecosystems and substantial investments from venture capital firms. San Francisco stands out as a hub for AR and VR startups, benefiting from the presence of tech giants and innovative firms. New York's robust media and entertainment sector further fuels the demand for immersive experiences, while Los Angeles, with its strong focus on entertainment, drives the adoption of AR and VR in film and gaming industries.
- Data privacy regulations are becoming increasingly important in the AR/VR market, as consumer concerns over data security grow. In 2023, the Federal Trade Commission reported that 70% of consumers expressed worries about how their data is collected and used in AR/VR applications. Consequently, new regulations are being introduced to safeguard user data, with compliance requirements becoming more stringent. Companies must navigate these evolving laws to ensure consumer trust and avoid potential legal issues, highlighting the importance of data privacy in market growth.
USA Augmented and Virtual Reality Market Segmentation
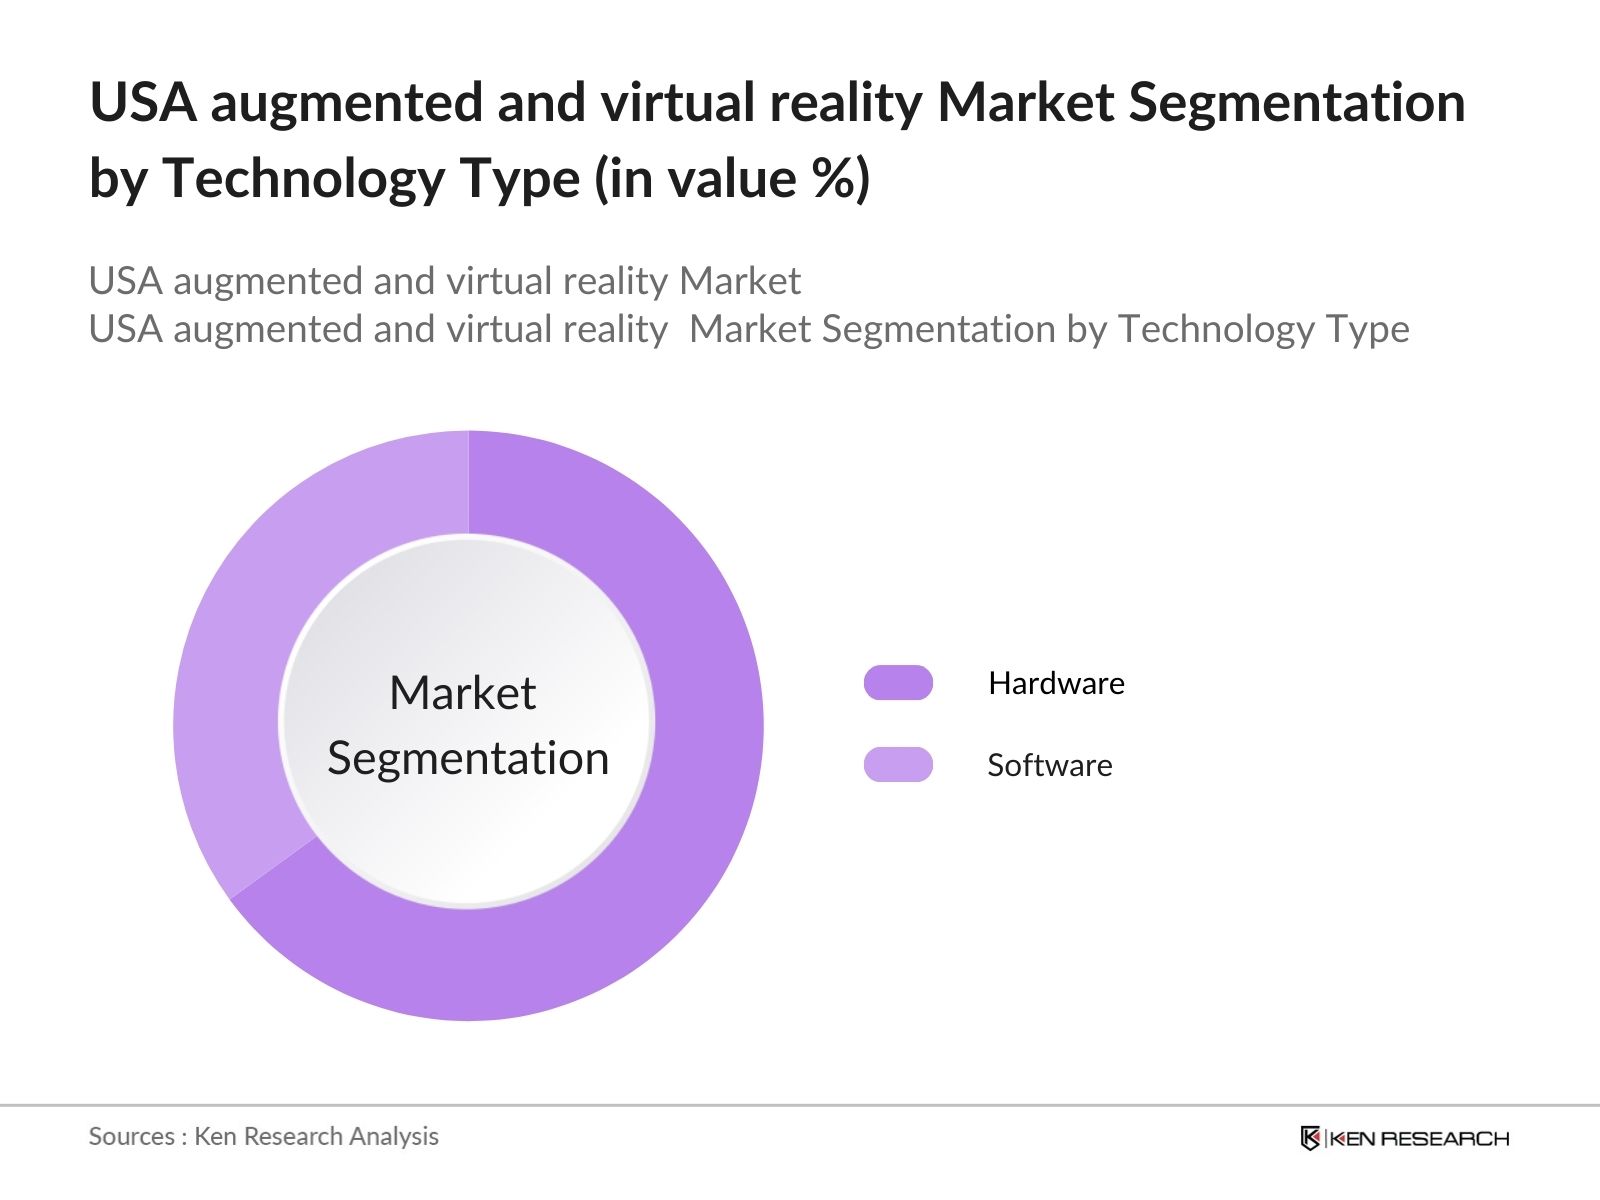
- By Technology Type: The market is segmented by technology type into hardware and software. The hardware segment currently dominates the market, largely due to the increasing adoption of advanced headsets, motion sensors, and controllers that enhance user experience. As more consumers and enterprises invest in immersive technologies, the demand for high-quality hardware has surged. Major manufacturers are continuously innovating their product lines, ensuring that the hardware segment remains at the forefront of market development.
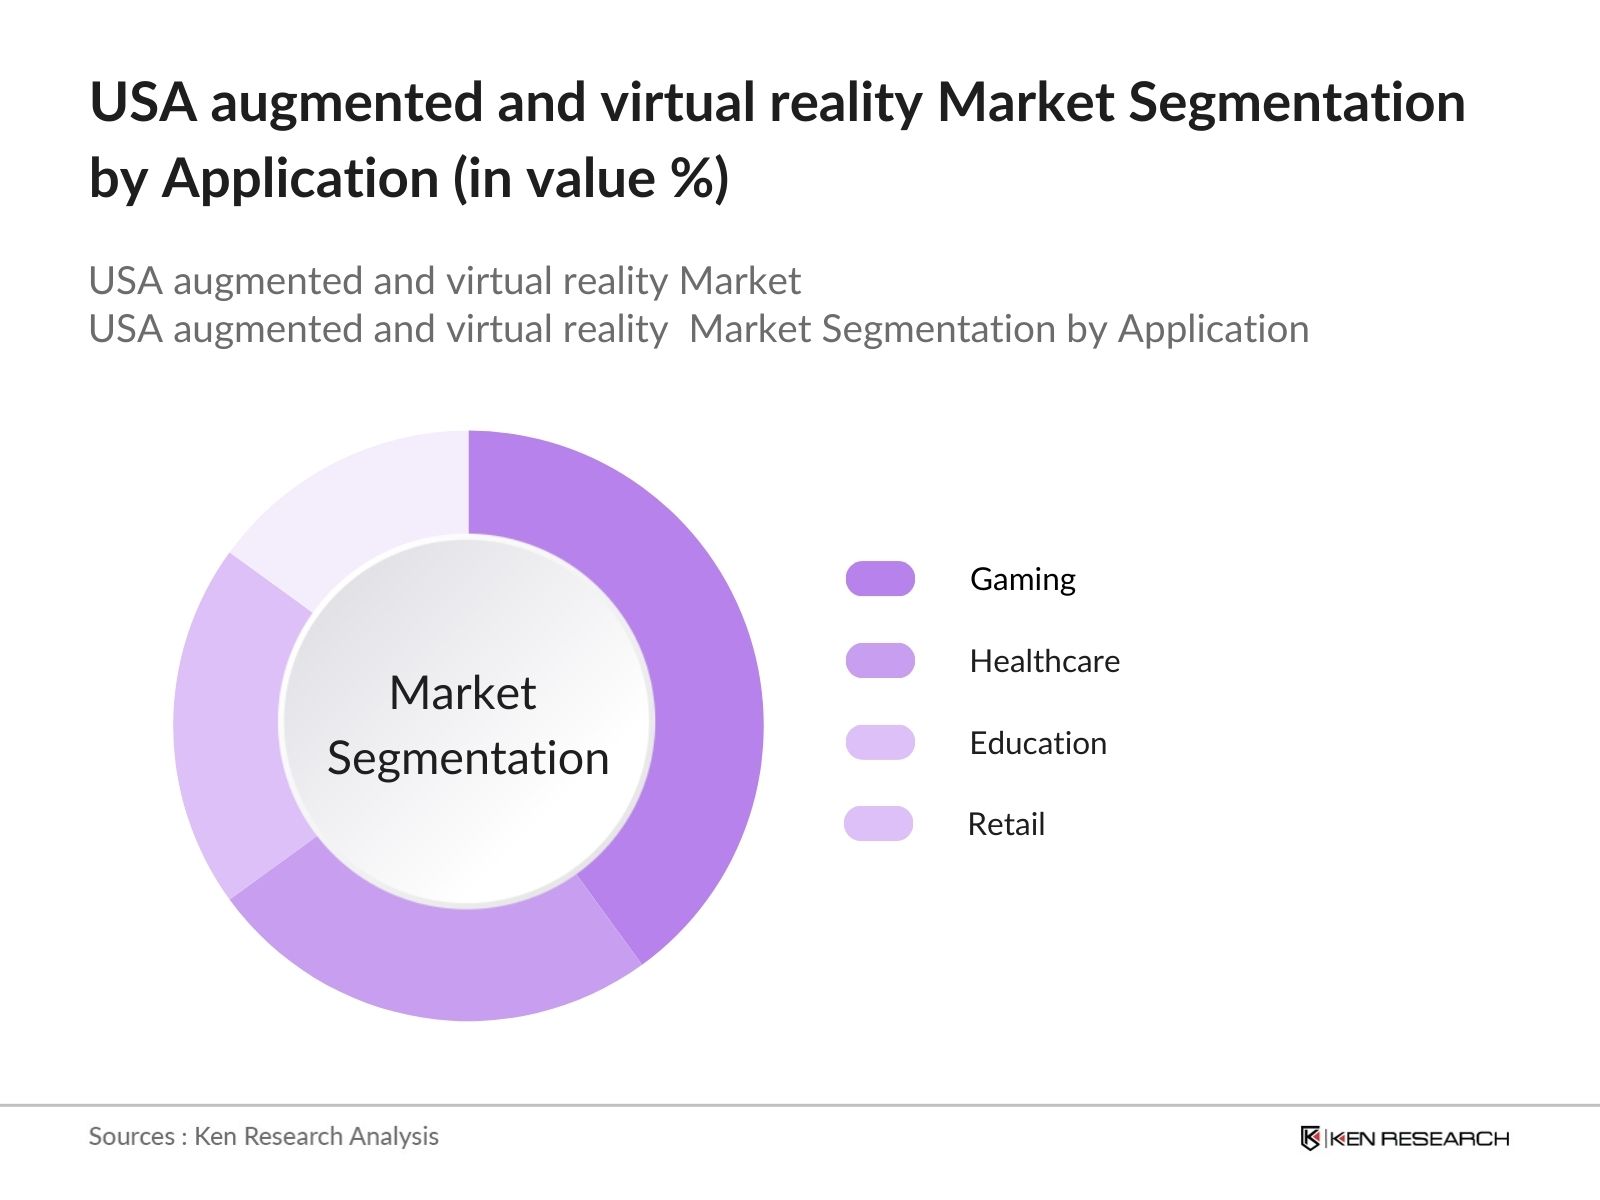
- By Application: The market is also segmented by application into gaming, healthcare, education, and retail. The gaming segment leads in market share, driven by the growing popularity of immersive gaming experiences and the launch of innovative VR titles. Major gaming platforms are incorporating AR and VR features, attracting a broader audience. This trend is expected to continue as consumers seek more engaging and interactive entertainment options, thereby solidifying gaming as the dominant application segment.
USA Augmented and Virtual Reality Market Competitive Landscape
The USA augmented and virtual reality market is highly competitive, with players focusing on technological innovations and strategic partnerships. Major companies such as Oculus VR, HTC Corporation, and Sony Interactive Entertainment lead the market, capitalizing on their extensive experience, large customer bases, and continuous investment in research and development.
|
Company |
Established |
Headquarters |
Number of Employees |
Revenue (USD Bn) |
Product Portfolio |
Key Partnerships |
|
Oculus VR (Meta Platforms) |
2012 |
Menlo Park, CA |
||||
|
HTC Corporation |
1997 |
Taoyuan, Taiwan |
||||
|
Sony Interactive Entertainment |
1993 |
San Mateo, CA |
||||
|
Microsoft Corporation |
1975 |
Redmond, WA |
||||
|
Magic Leap, Inc. |
2010 |
Plantation, FL |
USA Augmented and Virtual Reality Industry Analysis
Growth Drivers
- Increased Adoption in Gaming: The gaming industry is experiencing a significant boost in augmented and virtual reality (AR/VR) technology adoption. In 2023, revenue from AR/VR gaming reached approximately $3.6 billion, driven by popular titles and immersive experiences. According to a report by the Entertainment Software Association, around 45% of gamers have expressed interest in AR/VR content, indicating a robust demand for such technologies. This interest is further supported by a forecasted 20% increase in gaming-related AR/VR hardware sales, reflecting consumer enthusiasm for enhanced gaming experiences. Such data underscores the market's growth potential within the gaming sector.
- Expanding Use in Healthcare: AR/VR technologies are making strides in the healthcare sector, particularly for training and patient treatment. A 2023 study indicated that 30% of medical schools have integrated AR/VR into their curricula, enhancing the training of healthcare professionals. Additionally, VR is being utilized in therapy, with around 75% of patients reporting reduced anxiety during treatment. The total investment in healthcare AR/VR solutions reached $1.2 billion in 2023, highlighting the sector's commitment to adopting innovative technologies for better outcomes. These figures illustrate the significant role AR/VR plays in revolutionizing healthcare practices.
- Enhanced Learning and Training Solutions: The demand for AR/VR in educational settings is on the rise, with 65% of educators believing that these technologies enhance student engagement. In 2023, the investment in AR/VR educational tools surpassed $800 million, indicating a growing commitment to innovative learning solutions. Schools using AR/VR have reported a 30% increase in knowledge retention among students. This data highlights the effectiveness of AR/VR in making learning more interactive and effective, positioning it as a key driver in the education sector. The trend reflects a strong shift towards technology integration in learning environments.
Market Challenges
- High Implementation Costs: Deploying advanced AR and VR solutions can be financially challenging, particularly for smaller businesses and public institutions. The initial investment for hardware, software, and infrastructure can be substantial, leading to hesitation in adoption. Many organizations struggle to justify these expenses, particularly in sectors where the return on investment may not be immediately evident.
- Privacy and Security Concerns: As AR and VR technologies often require extensive data collection, concerns surrounding user privacy and data security persist. Consumers and businesses are wary of potential breaches and misuse of sensitive information, creating a barrier to widespread adoption. Establishing robust security protocols and addressing privacy concerns are essential for building trust in AR and VR applications.
USA Augmented and Virtual Reality Market Future Outlook
Over the next five years, the USA augmented and virtual reality market is expected to experience significant growth, driven by technological advancements and increasing consumer interest in immersive experiences. Continuous improvements in hardware and software, along with rising applications in sectors like healthcare and education, will further propel market development. Additionally, increasing collaboration between technology firms and content creators will enhance the quality and availability of AR and VR content.
Future Market Opportunities
- Integration with AI: The integration of artificial intelligence (AI) into AR/VR applications presents significant growth opportunities. In 2023, 45% of AR/VR developers reported incorporating AI for personalized experiences and real-time analytics, enhancing user engagement. The combined market for AI in AR/VR was valued at approximately $900 million, reflecting the growing interest in this synergy. As AI continues to evolve, its potential to transform AR/VR applications into more interactive and adaptive experiences offers a promising avenue for market expansion. This trend is likely to drive further investment and innovation in the sector.
- Rise of Remote Collaboration Tools: The shift towards remote work has accelerated the demand for AR/VR collaboration tools, offering innovative solutions for virtual meetings and team interactions. In 2023, the number of remote collaboration tool users reached 5 million, with AR/VR applications gaining popularity for their immersive experiences. Organizations reported a 25% increase in productivity when using AR/VR tools for remote collaboration. This trend indicates a growing market opportunity as companies seek effective ways to enhance teamwork and communication in virtual settings.
Scope of the Report
|
By Technology Type |
Hardware Software |
|||
|
By Application |
Gaming Healthcare Education Retail |
|||
|
By Region |
North East West South |
|||
|
By End User |
|
|||
|
By Device Type |
|
Products
Key Target Audience
Government and Regulatory Bodies (Federal Communications Commission, National Telecommunications and Information Administration)
Corporations in Healthcare
Educational Institutions and Training Providers
Gaming Companies
Retail Enterprises
Advertising Agencies
Banks and Financial Institutes
Investments and Venture Capitalist Firms
Cloud Service Providers
Companies
List of Major Players in the USA Augmented and Virtual Reality Market
-
Oculus VR (Meta Platforms Inc.)
HTC Corporation
Sony Interactive Entertainment
Microsoft Corporation
Magic Leap, Inc.
Unity Technologies
Niantic, Inc.
PTC Inc.
VIVEPORT
Varjo Technologies
EON Reality, Inc.
Unreal Engine (Epic Games)
Daqri, Inc.
Roblox Corporation
8th Wall, Inc.
Table of Contents
1. USA Augmented and Virtual Reality Market Overview
1.1. Definition and Scope
1.2. Market Taxonomy
1.3. Market Dynamics
1.4. Market Segmentation Overview
2. USA Augmented and Virtual Reality Market Size (In USD Bn)
2.1. Historical Market Size
2.2. Year-On-Year Growth Analysis
2.3. Key Market Developments and Milestones
3. USA Augmented and Virtual Reality Market Analysis
3.1. Growth Drivers
3.1.1. Increased Adoption in Gaming
3.1.2. Expanding Use in Healthcare
3.1.3. Enhanced Learning and Training Solutions
3.2. Market Challenges
3.2.1. High Initial Costs
3.2.2. Technological Limitations
3.2.3. User Experience Issues
3.3. Opportunities
3.3.1. Integration with AI
3.3.2. Rise of Remote Collaboration Tools
3.3.3. Expansion in E-Commerce
3.4. Trends
3.4.1. Evolution of Wearable AR Devices
3.4.2. Cross-Platform Compatibility
3.4.3. Growth of 5G Technology
3.5. Government Regulation
3.5.1. Data Privacy Laws
3.5.2. Standards for AR/VR Content
3.5.3. Funding for Technological Innovation
3.6. SWOT Analysis
3.7. Stake Ecosystem
3.8. Porters Five Forces
3.9. Competition Ecosystem
4. USA Augmented and Virtual Reality Market Segmentation
4.1. By Technology Type (In Value %)
4.1.1. Hardware
4.1.2. Software
4.2. By Application (In Value %)
4.2.1. Gaming
4.2.2. Healthcare
4.2.3. Education
4.2.4. Retail
4.3. By End User (In Value %)
4.3.1. Consumer
4.3.2. Enterprise
4.4. By Region (In Value %)
4.4.1. North
4.4.2. West
4.4.3. South
4.4.4. East
4.5. By Device Type (In Value %)
4.5.1. Head-Mounted Displays
4.5.2. Smart Glasses
5. USA Augmented and Virtual Reality Market Competitive Analysis
5.1. Detailed Profiles of Major Companies
5.1.1. Oculus VR (Meta Platforms Inc.)
5.1.2. HTC Corporation
5.1.3. Sony Interactive Entertainment
5.1.4. Microsoft Corporation
5.1.5. Magic Leap, Inc.
5.1.6. Unity Technologies
5.1.7. Niantic, Inc.
5.1.8. PTC Inc.
5.1.9. VIVEPORT
5.1.10. Varjo Technologies
5.1.11. EON Reality, Inc.
5.1.12. Unreal Engine (Epic Games)
5.1.13. Daqri, Inc.
5.1.14. Roblox Corporation
5.1.15. 8th Wall, Inc.
5.2. Cross Comparison Parameters (No. of Employees, Headquarters, Inception Year, Revenue, Market Focus, Technology Stack, Customer Segments, Strategic Partnerships)
5.3. Market Share Analysis
5.4. Strategic Initiatives
5.5. Mergers and Acquisitions
5.6. Investment Analysis
5.7. Venture Capital Funding
5.8. Government Grants
5.9. Private Equity Investments
6. USA Augmented and Virtual Reality Market Regulatory Framework
6.1. Data Protection Regulations
6.2. Compliance Standards
6.3. Certification Processes
7. USA Augmented and Virtual Reality Future Market Size (In USD Bn)
7.1. Future Market Size Projections
7.2. Key Factors Driving Future Market Growth
8. USA Augmented and Virtual Reality Future Market Segmentation
8.1. By Technology Type (In Value %)
8.2. By Application (In Value %)
8.3. By End User (In Value %)
8.4. By Region (In Value %)
8.5. By Device Type (In Value %)
9. USA Augmented and Virtual Reality Market Analysts Recommendations
9.1. TAM/SAM/SOM Analysis
9.2. Customer Cohort Analysis
9.3. Marketing Initiatives
9.4. White Space Opportunity Analysis
Research Methodology
Step 1: Identification of Key Variables
The research begins with identifying key variables that influence the USA Augmented and Virtual Reality Market, such as technological advancements, consumer adoption patterns, and regulatory requirements. Extensive desk research, along with analysis of government and industry reports, is conducted to map these variables.
Step 2: Market Analysis and Construction
In this step, historical data is analyzed to evaluate the market's growth trajectory. Market penetration and the ratio of AR/VR solutions to industries are assessed. Data from reputable sources such as IDC is utilized to ensure the accuracy of revenue estimates.
Step 3: Hypothesis Validation and Expert Consultation
To validate market assumptions, expert interviews are conducted with AR and VR solution providers, government officials, and industry professionals. These consultations help refine market hypotheses and provide insights into operational and financial challenges faced by the industry.
Step 4: Research Synthesis and Final Output
The final synthesis involves consolidating insights from multiple stakeholders, including industry experts and solution providers. This step ensures that the final market analysis is accurate, comprehensive, and aligned with the current trends in the USA Augmented and Virtual Reality Market.
Frequently Asked Questions
01. How big is the USA Augmented and Virtual Reality Market?
The USA Augmented and Virtual Reality Market is valued at USD 44 billion, driven by advancements in technology and rising consumer demand for immersive experiences across various sectors.
02. What are the challenges in the USA Augmented and Virtual Reality Market?
Key challenges include high implementation costs for businesses and concerns over data privacy and security, which may deter some organizations from adopting AR and VR solutions.
03. Who are the major players in the USA Augmented and Virtual Reality Market?
Major players include Oculus VR, HTC Corporation, Sony Interactive Entertainment, Microsoft Corporation, and Magic Leap. These companies lead the market due to their strong brand presence and technological expertise.
04. What are the growth drivers of the USA Augmented and Virtual Reality Market?
The market is driven by the adoption of immersive technologies, increased applications in corporate training, and the growing interest in AR and VR for gaming and entertainment.
05. Which application type dominates the USA Augmented and Virtual Reality Market?
The gaming application dominates the market due to the increasing popularity of immersive gaming experiences and the launch of innovative VR gaming titles.
Why Buy From Us?
 Framework")
What makes us stand out is that our consultants follows Robust, Refine and Result (RRR) methodology. i.e. Robust for clear definitions, approaches and sanity checking, Refine for differentiating respondents facts and opinions and Result for presenting data with story

We have set a benchmark in the industry by offering our clients with syndicated and customized market research reports featuring coverage of entire market as well as meticulous research and analyst insights.

While we don't replace traditional research, we flip the method upside down. Our dual approach of Top Bottom & Bottom Top ensures quality deliverable by not just verifying company fundamentals but also looking at the sector and macroeconomic factors.

With one step in the future, our research team constantly tries to show you the bigger picture. We help with some of the tough questions you may encounter along the way: How is the industry positioned? Best marketing channel? KPI's of competitors? By aligning every element, we help maximize success.

Our report gives you instant access to the answers and sources that other companies might choose to hide. We elaborate each steps of research methodology we have used and showcase you the sample size to earn your trust.

If you need any support, we are here! We pride ourselves on universe strength, data quality, and quick, friendly, and professional service.