
USA Baseball Equipment Market Outlook to 2030
Region:North America
Author(s):Shubham Kashyap
Product Code:KROD8778
December 2024
86
About the Report
USA Baseball Equipment Market Overview
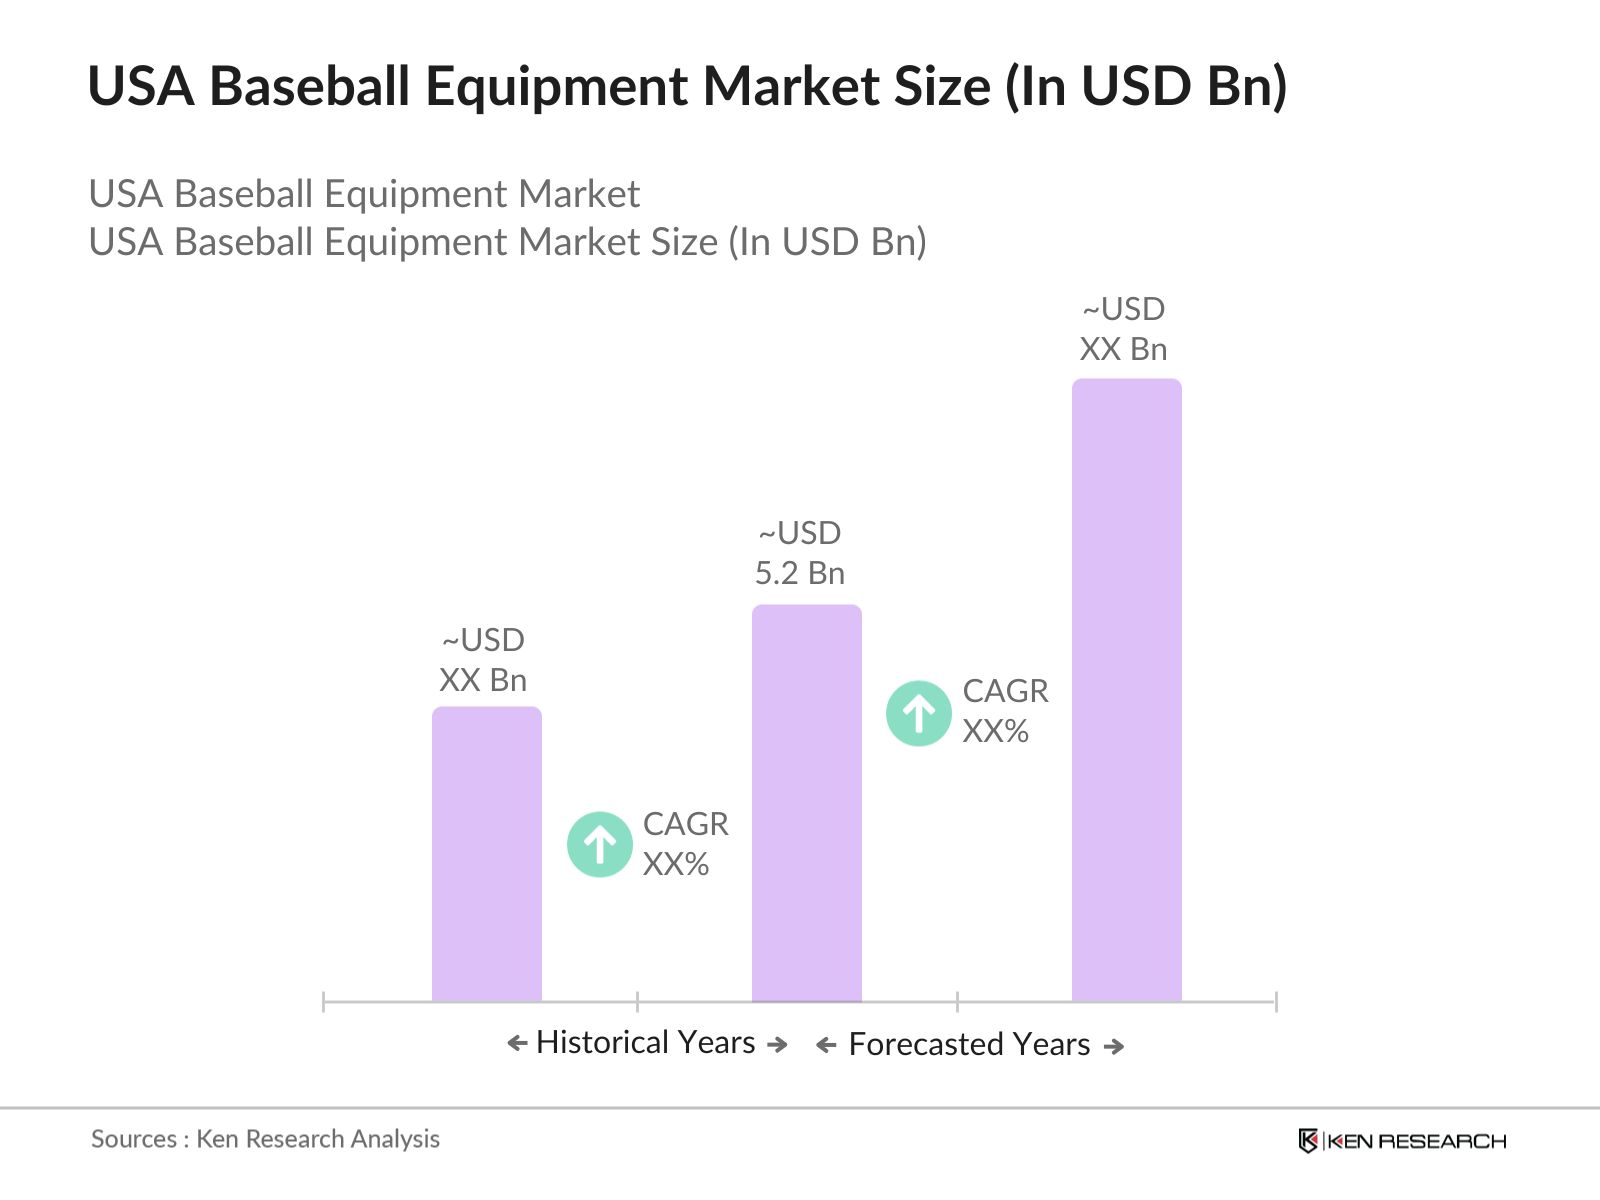
- The USA baseball equipment market is valued at USD 5.2 billion, primarily driven by the increasing youth participation in baseball, technological innovations in equipment design, and a growing emphasis on health and fitness. The market sees steady growth as families invest in sports activities for their children, and leagues expand at local and national levels. Key factors such as advancements in materials, rising disposable incomes, and the popularity of baseball as a leisure activity contribute to the markets stability and long-term expansion, solidifying the USA as a leading market for baseball equipment globally.
- Major demand centers for baseball equipment in the USA include cities like New York, Los Angeles, and Chicago. The U.S. dominates due to its extensive sports infrastructure, high engagement in youth baseball programs, and significant investments in athletic facilities. These urban centers have well-established systems for player development, including training academies and competitive leagues, which drive demand for quality baseball equipment. Furthermore, states such as California and Texas also contribute significantly to the market, supported by favorable climates and a strong cultural association with baseball.
- In the United States, the federal government launched the National Youth Sports Strategy, the first federal roadmap with actionable strategies to increase participation in youth sports, including baseball. This strategy emphasizes the importance of sports in youth development and provides guidelines for increasing access and participation. Additionally, Major League Baseball (MLB) has committed significant resources to promote diversity and inclusion within the sport. In 2020, MLB pledged up to USD 150 million over ten years to the Players Alliance, supporting programs focused on participation, mentorship, and professional development in baseball
USA Baseball Equipment Market Segmentation
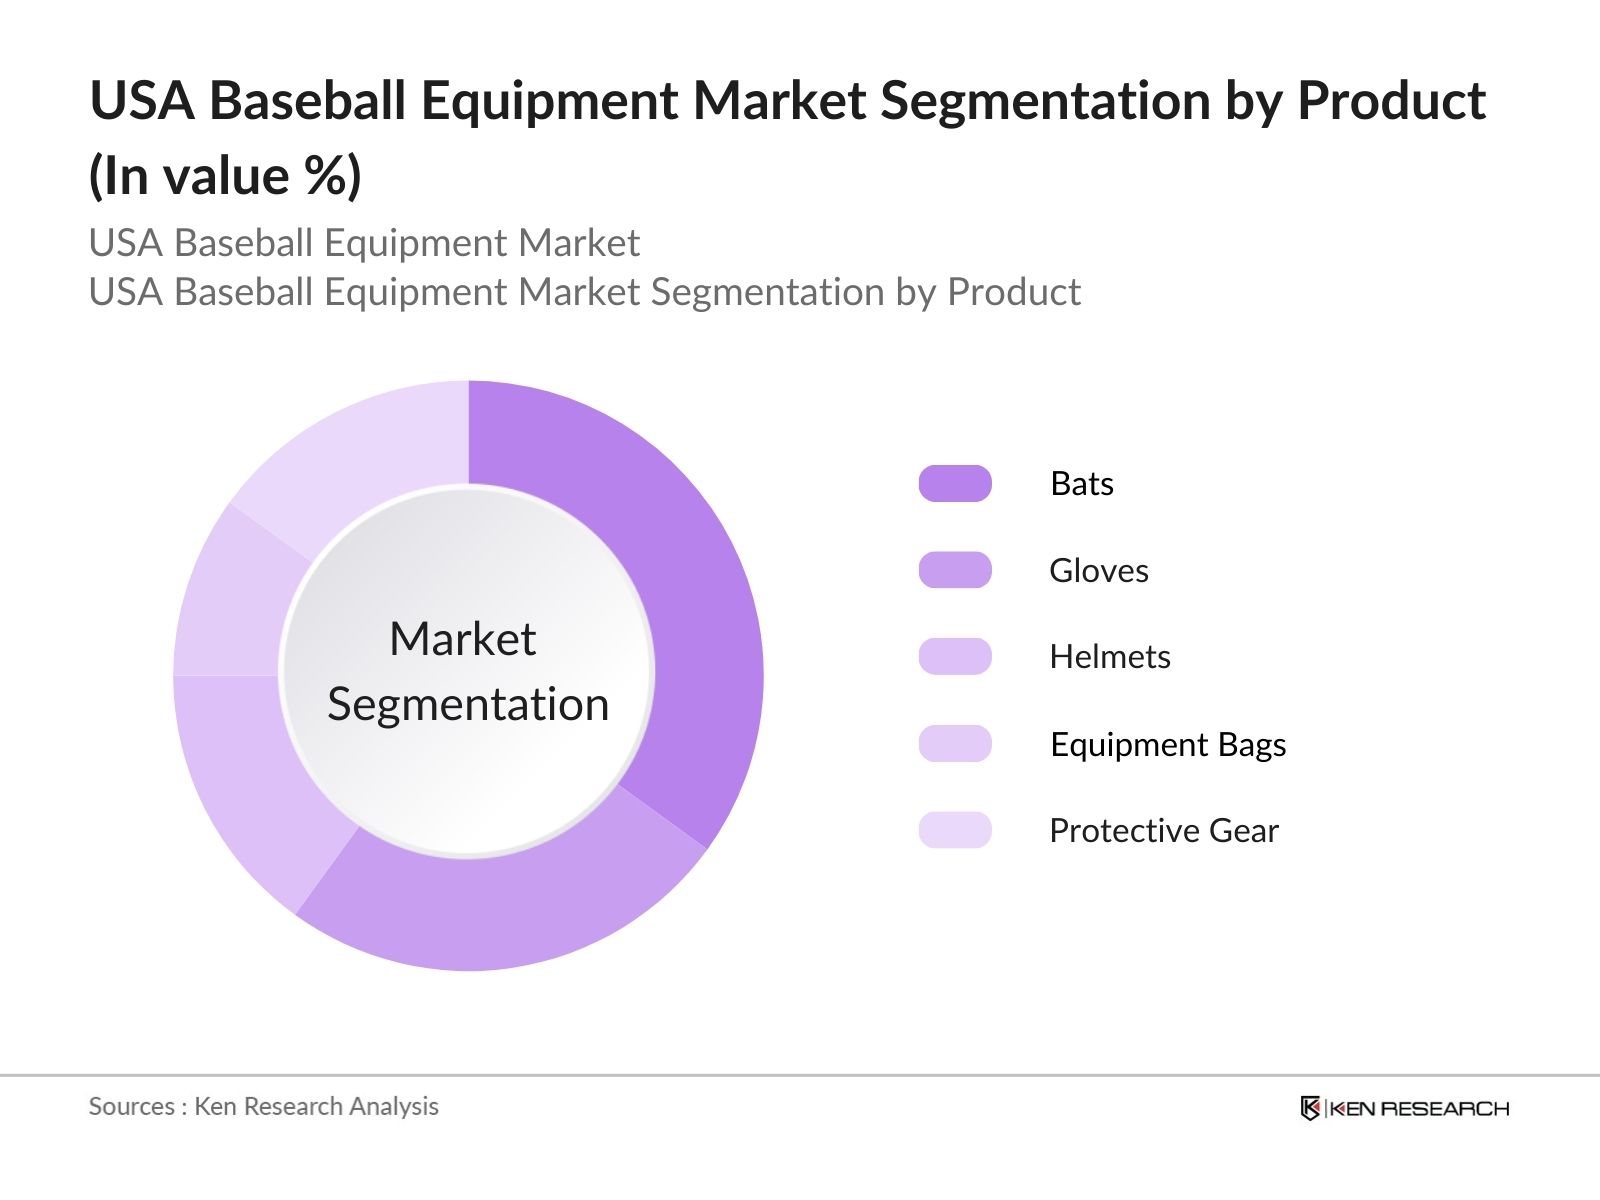
- By Product Type: The market is segmented by product type into bats, gloves, helmets, equipment bags, and protective gear. Recently, bats hold a dominant market share within this segmentation, accounting for majority of market share in 2023. This dominance is attributed to the essential role bats play in the game and the continuous demand from players at all levels, from amateur to professional. The expanding availability of a variety of bat materials, such as composite, wood, and aluminum, which satisfy different league regulations and personal preferences, further contributes to the market expansion.
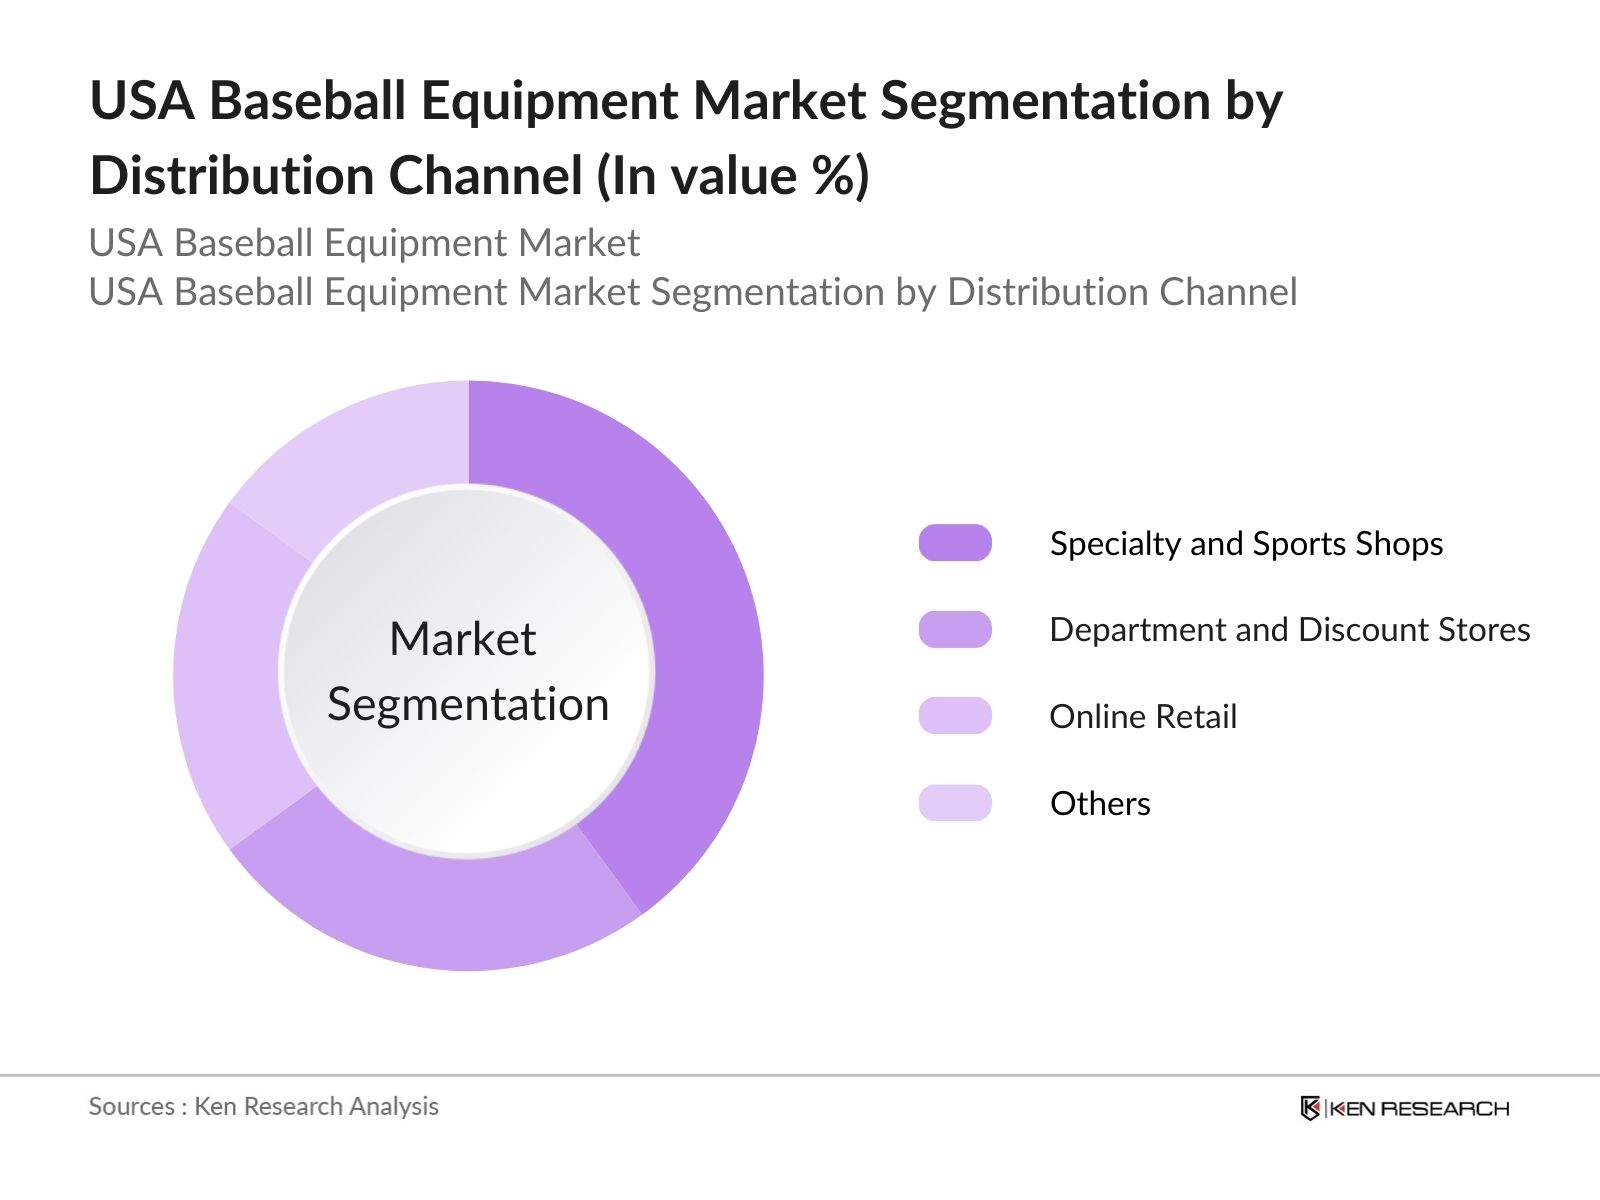
- By Distribution Channel: The market is segmented by distribution channels, including specialty and sports shops, department and discount stores, online retail, and others. Specialty and sports shops lead this segment, holding majority of the market share in 2023. These stores offer a wide range of baseball equipment and apparel, including gloves, bats, cleats, uniforms, protective gear, and more. In addition to selling baseball equipment, specialty and sports shops may also offer services such as equipment repair and customization, as well as hosting events such as product launches, player signings, or instructional clinics.
USA Baseball Equipment Market Competitive Landscape
The USA baseball equipment market is dominated by a few major players, including Rawlings Sporting Goods, Wilson Sporting Goods, Mizuno Corporation, Easton Diamond Sports, and Marucci Sports. These companies leverage strong brand recognition, extensive distribution channels, and continuous investment in technological innovation to maintain their market leadership positions. 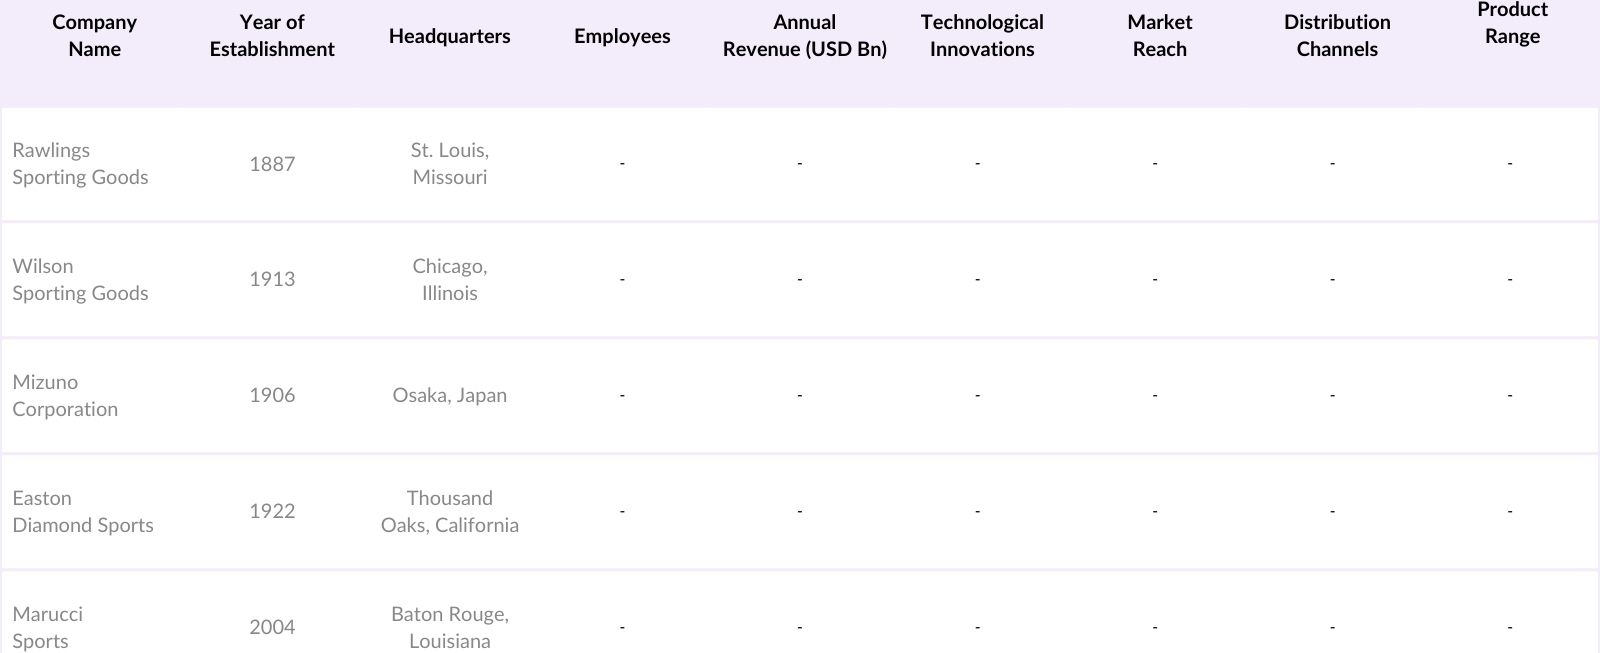
USA Baseball Equipment Market Analysis
Growth Drivers
- Rising Participation Rates: In 2023, the United States saw over 15 million individuals actively participating in baseball, reflecting a steady increase in engagement across various age groups. This surge is attributed to the sport's deep-rooted cultural significance and the proliferation of youth leagues nationwide. The National Federation of State High School Associations reported that baseball had 482,740 high school participants in the 2022-2023 academic year, underscoring its popularity among younger demographics. Additionally, Major League Baseball (MLB) initiatives, such as the "Play Ball" program, have been instrumental in promoting grassroots participation, further bolstering these numbers.
- Technological Advancements in Equipment: The baseball equipment industry has embraced technological innovations to enhance player performance and safety. For instance, the introduction of smart bats equipped with embedded sensors provides real-time data on swing mechanics, aiding players in refining their techniques. Similarly, advancements in materials have led to the development of lighter and more durable protective gear, reducing injury risks. These innovations have been widely adopted at both amateur and professional levels, reflecting the industry's commitment to integrating technology for improved athletic outcomes.
- Government Initiatives Promoting Baseball: Governments at various levels have implemented programs to encourage baseball participation. In 2023, the U.S. Department of Education allocated over 500 million towards extracurricular sports programs, including baseball, to promote physical activity among youth. Additionally, local municipalities have invested in building and upgrading baseball facilities, making the sport more accessible to communities nationwide. These efforts aim to foster community engagement and promote healthy lifestyles through increased participation in baseball.
Challenges
- High Cost of Quality Equipment: While quality baseball equipment is essential for performance, the high costs associated with premium products can be a barrier for some consumers. Families with budget constraints may opt for lower-quality alternatives, potentially impacting the market share of established brands. Despite the availability of more affordable options, the perception that higher-priced equipment offers superior performance often influences purchasing decisions, potentially limiting participation among lower-income groups.
- Intense Market Competition: The baseball equipment market is highly competitive, with numerous brands vying for consumer attention. Established companies continually innovate and market new products, making it challenging for smaller or newer entrants to gain market share. This competition drives rapid product cycles and necessitates significant investment in research and development, marketing, and endorsements to maintain relevance and attract consumers.
USA Baseball Equipment Market Future Outlook
The USA baseball equipment market is poised for robust growth, supported by increasing youth participation, continuous advancements in technology, and a growing emphasis on health and fitness. As businesses continue to prioritize product innovation, the integration of smart technologies and personalized equipment options will likely enhance the consumer experience. The ongoing shift to e-commerce and online retail platforms further emphasizes the markets dynamic growth prospects, setting a positive trajectory for future expansion.
Future Market Opportunities
- Expansion into Emerging Markets: There is substantial potential for growth as baseball gains popularity in regions traditionally less associated with the sport. Countries in Latin America and Asia are increasingly adopting baseball, creating new opportunities for manufacturers and retailers. Establishing partnerships with local organizations and investing in grassroots programs can facilitate entry into these emerging markets, offering growth potential for the baseball equipment industry.
- Growth of E-commerce Channels: The rise of e-commerce has transformed retail landscapes, providing baseball equipment manufacturers with direct access to consumers. In 2023, online sales accounted for a substantial portion of total sporting goods sales in the U.S., reflecting a shift in consumer purchasing behavior. Leveraging online platforms allows companies to reach a broader audience, offer personalized shopping experiences, and gather valuable consumer data to inform product development and marketing strategies.
Scope of the Report
|
By Product Type |
Bats |
|
By Distribution Channel |
Specialty and Sports Shops |
|
By End-User |
Professional Players |
|
By Material Type |
Wood |
|
By Region |
North America |
Products
Key Target Audience
Baseball Equipment Manufacturers
Sports Retailers and Distributors
Professional Baseball Teams and Associations
Amateur and Youth Baseball Leagues
Investors and Venture Capitalist Firms
Banks and Financial Institutions
Government and Regulatory Bodies (e.g., U.S. Consumer Product Safety Commission)
Sports Training and Coaching Centers
Companies
Players Mentioned in the Report
Rawlings Sporting Goods
Wilson Sporting Goods
Mizuno Corporation
Easton Diamond Sports
Marucci Sports
Nike, Inc.
Under Armour, Inc.
Franklin Sports
Louisville Slugger
DeMarini Sports
Nokona American Ball Gloves
Akadema Inc.
All-Star Sporting Goods
EvoShield
Champro Sports
Table of Contents
1. Market Overview
1.1 Definition and Scope
1.2 Market Taxonomy
1.3 Market Growth Rate
1.4 Market Segmentation Overview
2. Market Size (USD Million)
2.1 Historical Market Size
2.2 Year-On-Year Growth Analysis
2.3 Key Market Developments and Milestones
3. Market Analysis
3.1 Growth Drivers
3.1.1 Rising Participation Rates
3.1.2 Technological Advancements in Equipment
3.1.3 Government Initiatives Promoting Baseball
3.1.4 Increasing Health and Fitness Awareness
3.2 Market Challenges
3.2.1 High Cost of Premium Equipment
3.2.2 Intense Market Competition
3.2.3 Fluctuating Raw Material Prices
3.3 Opportunities
3.3.1 Expansion into Emerging Markets
3.3.2 Growth of E-commerce Channels
3.3.3 Customization and Personalization Trends
3.4 Trends
3.4.1 Adoption of Smart Equipment
3.4.2 Eco-friendly and Sustainable Materials
3.4.3 Integration with Digital Platforms
3.5 Government Regulations
3.5.1 Safety Standards and Compliance
3.5.2 Import and Export Policies
3.5.3 Youth Sports Funding Programs
3.6 SWOT Analysis
3.7 Stakeholder Ecosystem
3.8 Porters Five Forces Analysis
3.9 Competitive Landscape
4. Market Segmentation
4.1 By Product Type (Value %)
4.1.1 Bats
4.1.2 Helmets
4.1.3 Gloves
4.1.4 Equipment Bags
4.1.5 Protective Gear
4.2 By Distribution Channel (Value %)
4.2.1 Specialty and Sports Shops
4.2.2 Department and Discount Stores
4.2.3 Online Retail
4.2.4 Others
4.3 By End-User (Value %)
4.3.1 Professional Players
4.3.2 Recreational Players
4.3.3 Institutional Buyers
4.4 By Material Type (Value %)
4.4.1 Wood
4.4.2 Aluminum
4.4.3 Composite
4.4.4 Others
4.5 By Region (Value %)
4.5.1 North America
4.5.2 Europe
4.5.3 Asia-Pacific
4.5.4 Latin America
4.5.5 Middle East and Africa
5. Competitive Analysis
5.1 Detailed Profiles of Major Companies
5.1.1 Adidas AG
5.1.2 Nike, Inc.
5.1.3 Franklin Sports Inc.
5.1.4 Amer Sports Corporation
5.1.5 Mizuno Corporation
5.1.6 BRG Sports
5.1.7 Wilson Sporting Goods Co.
5.1.8 Marucci Sports
5.1.9 Rawlings Sporting Goods Company, Inc.
5.1.10 Majestic Athletic
5.1.11 Easton Diamond Sports, LLC
5.1.12 Under Armour, Inc.
5.1.13 New Balance Athletics, Inc.
5.1.14 DeMarini Sports, Inc.
5.1.15 Louisville Slugger
5.2 Cross Comparison Parameters (Revenue, Market Share, Product Portfolio, Distribution Network, R&D Investment, Strategic Initiatives, Geographical Presence, Brand Equity)
5.3 Market Share Analysis
5.4 Strategic Initiatives
5.5 Mergers and Acquisitions
5.6 Investment Analysis
5.6.1 Venture Capital Funding
5.6.2 Government Grants
5.6.3 Private Equity Investments
6. Regulatory Framework
6.1 Safety Standards and Certifications
6.2 Compliance Requirements
6.3 Certification Processes
7. Future Market Size (USD Million)
7.1 Future Market Size Projections
7.2 Key Factors Driving Future Market Growth
8. Future Market Segmentation
8.1 By Product Type (Value %)
8.2 By Distribution Channel (Value %)
8.3 By End-User (Value %)
8.4 By Material Type (Value %)
8.5 By Region (Value %)
9. Market Analysts Recommendations
9.1 Total Addressable Market (TAM), Serviceable Available Market (SAM), Serviceable Obtainable Market (SOM) Analysis
9.2 Customer Cohort Analysis
9.3 Marketing Initiatives
9.4 White Space Opportunity Analysis
Disclaimer Contact UsResearch Methodology
Step 1: Identification of Key Variables
The initial phase involves constructing an ecosystem map encompassing all major stakeholders within the USA Baseball Equipment Market. This step is underpinned by extensive desk research, utilizing a combination of secondary and proprietary databases to gather comprehensive industry-level information. The primary objective is to identify and define the critical variables that influence market dynamics.
Step 2: Market Analysis and Construction
In this phase, we compile and analyze historical data pertaining to the USA Baseball Equipment Market. This includes assessing market penetration, the ratio of marketplaces to service providers, and the resultant revenue generation. Furthermore, an evaluation of service quality statistics is conducted to ensure the reliability and accuracy of the revenue estimates.
Step 3: Hypothesis Validation and Expert Consultation
Market hypotheses are developed and subsequently validated through consultations with industry experts representing a diverse array of companies. These consultations provide valuable operational and financial insights directly from industry practitioners, which will be instrumental in refining and corroborating the market data.
Step 4: Research Synthesis and Final Output
The final phase involves direct engagement with multiple baseball equipment manufacturers to acquire detailed insights into product segments, sales performance, consumer preferences, and other pertinent factors. This interaction will serve to verify and complement the statistics derived from the bottom-up approach, thereby ensuring a comprehensive, accurate, and validated analysis of the USA Baseball Equipment Market.
Frequently Asked Questions
How big is the USA Baseball Equipment Market?
The USA baseball equipment market is valued at USD 5.2 billion, driven by increasing youth participation and technological innovations in equipment design.
What are the growth drivers of the USA Baseball Equipment Market?
The growth of the USA baseball equipment market is propelled by increasing youth participation in baseball and continuous advancements in equipment technology, catering to the needs of players at all levels.
Who are the major players in the USA Baseball Equipment Market?
Key players in the USA baseball equipment market include Rawlings Sporting Goods, Wilson Sporting Goods, Mizuno Corporation, and Easton Diamond Sports, known for their strong brand recognition and product innovation.
What challenges does the USA Baseball Equipment Market face?
The USA baseball equipment market faces challenges such as high costs of quality equipment, which can deter purchases, and seasonal demand variability that affects sales throughout the year.
Why Buy From Us?
 Framework")
What makes us stand out is that our consultants follows Robust, Refine and Result (RRR) methodology. i.e. Robust for clear definitions, approaches and sanity checking, Refine for differentiating respondents facts and opinions and Result for presenting data with story

We have set a benchmark in the industry by offering our clients with syndicated and customized market research reports featuring coverage of entire market as well as meticulous research and analyst insights.

While we don't replace traditional research, we flip the method upside down. Our dual approach of Top Bottom & Bottom Top ensures quality deliverable by not just verifying company fundamentals but also looking at the sector and macroeconomic factors.

With one step in the future, our research team constantly tries to show you the bigger picture. We help with some of the tough questions you may encounter along the way: How is the industry positioned? Best marketing channel? KPI's of competitors? By aligning every element, we help maximize success.

Our report gives you instant access to the answers and sources that other companies might choose to hide. We elaborate each steps of research methodology we have used and showcase you the sample size to earn your trust.

If you need any support, we are here! We pride ourselves on universe strength, data quality, and quick, friendly, and professional service.