
USA Bubble Tea Market Outlook to 2030
Region:North America
Author(s):Yogita Sahu
Product Code:KROD6031
November 2024
88
About the Report
USA Bubble Tea Market Overview
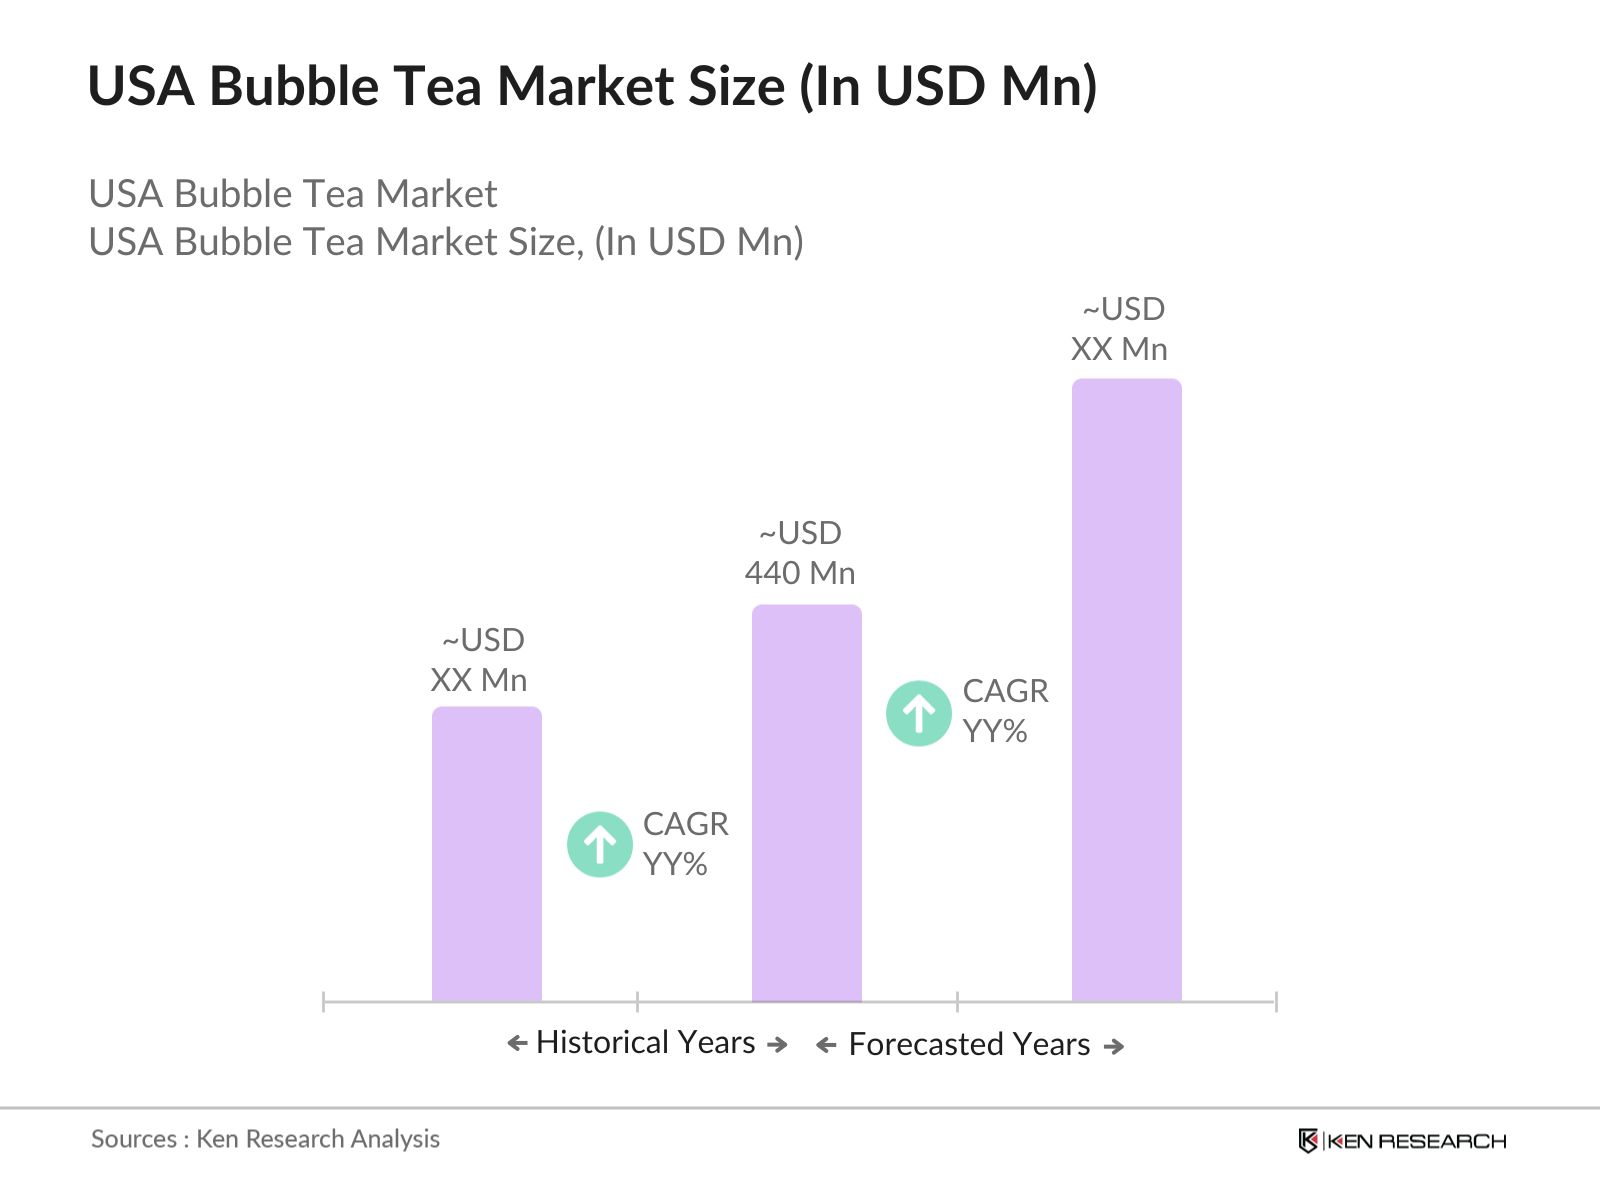
- The USA Bubble Tea market is valued at USD 440 million, driven by the growing popularity of specialty beverages among younger consumers. The markets expansion can be attributed to a strong preference for customizable drinks, where consumers can mix flavors and add toppings like tapioca pearls, popping boba, and jelly.
- Cities such as Los Angeles, New York, and San Francisco dominate the market due to their diverse, multicultural populations, which have embraced bubble tea as a cultural and trendy beverage. These cities also have a dense network of bubble tea stores and cafes, allowing greater accessibility and driving consumption.
- In 2023, the U.S. Food and Drug Administration (FDA) intensified its scrutiny of added sugar in beverages, leading to new recommendations on sugar labeling for tea-based drinks. Bubble tea vendors now need to comply with these regulations, which could affect product formulations. With the FDA promoting the reduction of daily sugar intake to 50 grams or less, bubble tea businesses are exploring sugar substitutes and lower-calorie options to align with regulatory shifts.
USA Bubble Tea Market Segmentation
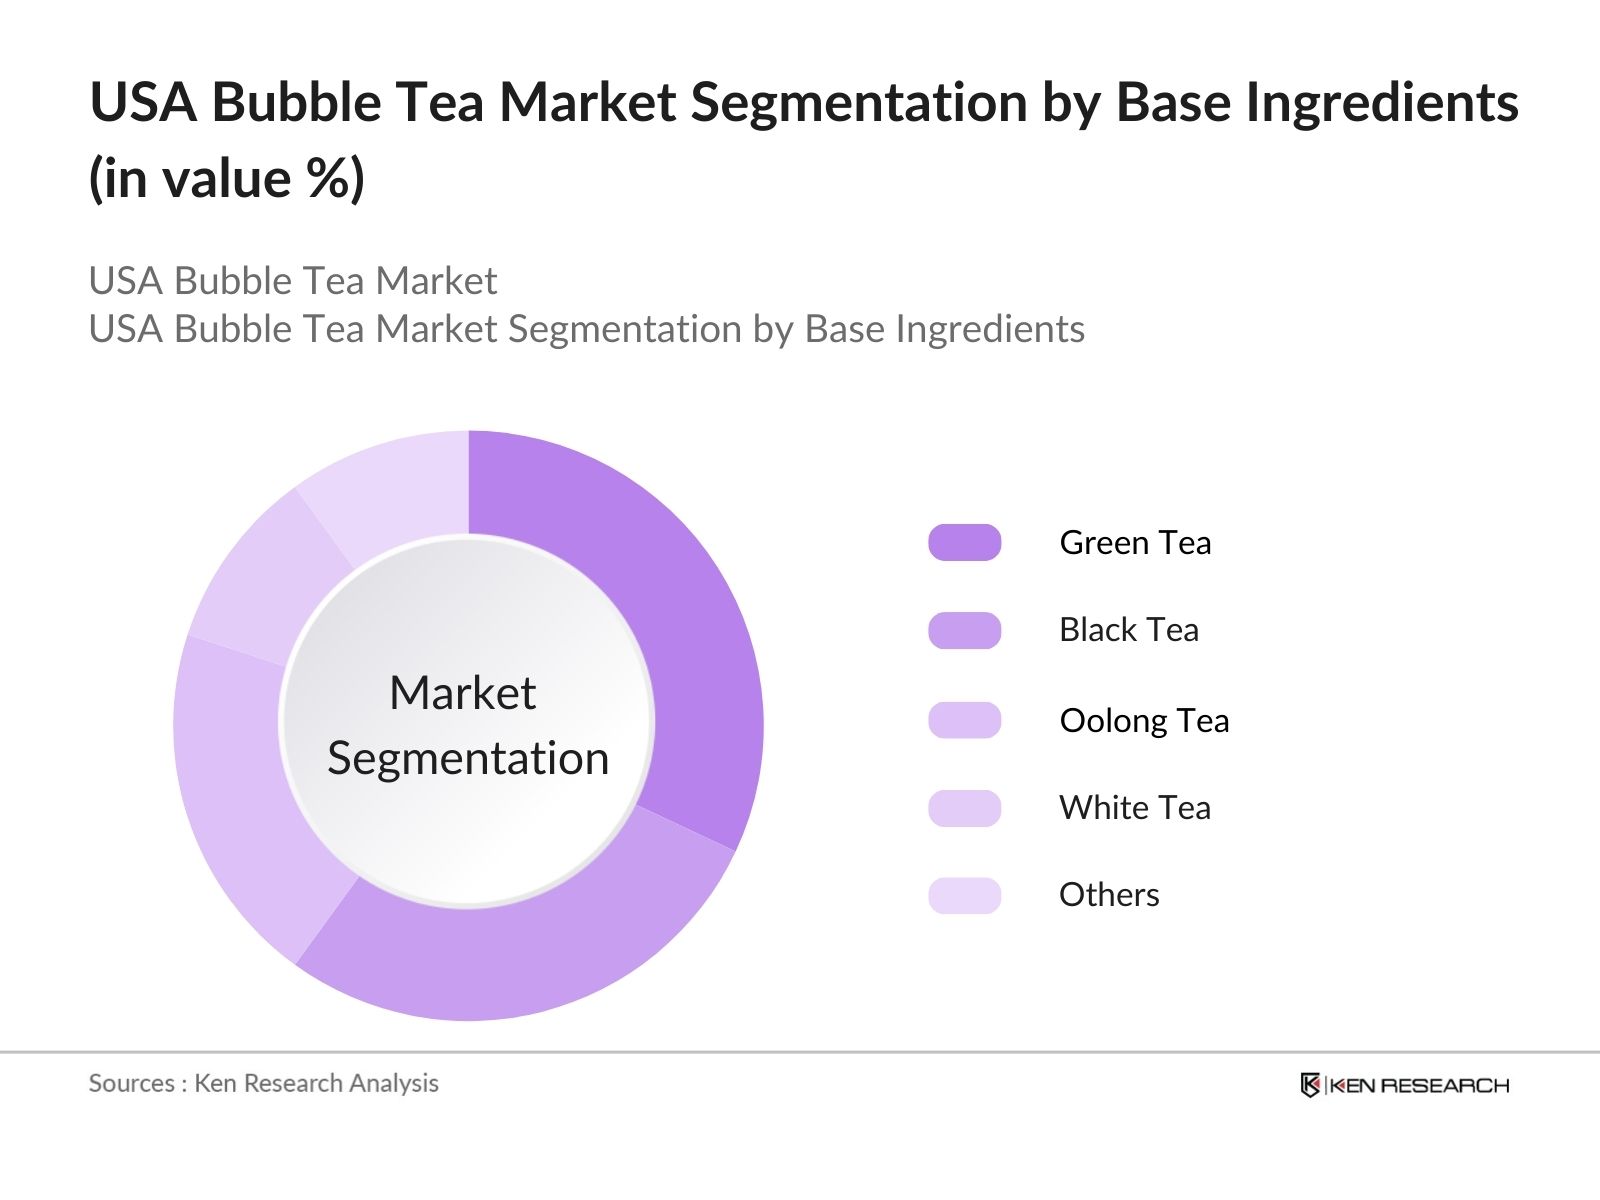
By Base Ingredient: The market is segmented by base ingredient into Green Tea, Black Tea, Oolong Tea, White Tea, and Others. Green tea has recently dominated the market share due to its perceived health benefits. Many consumers associate green tea with antioxidants and detoxifying properties, making it a popular choice among health-conscious individuals.
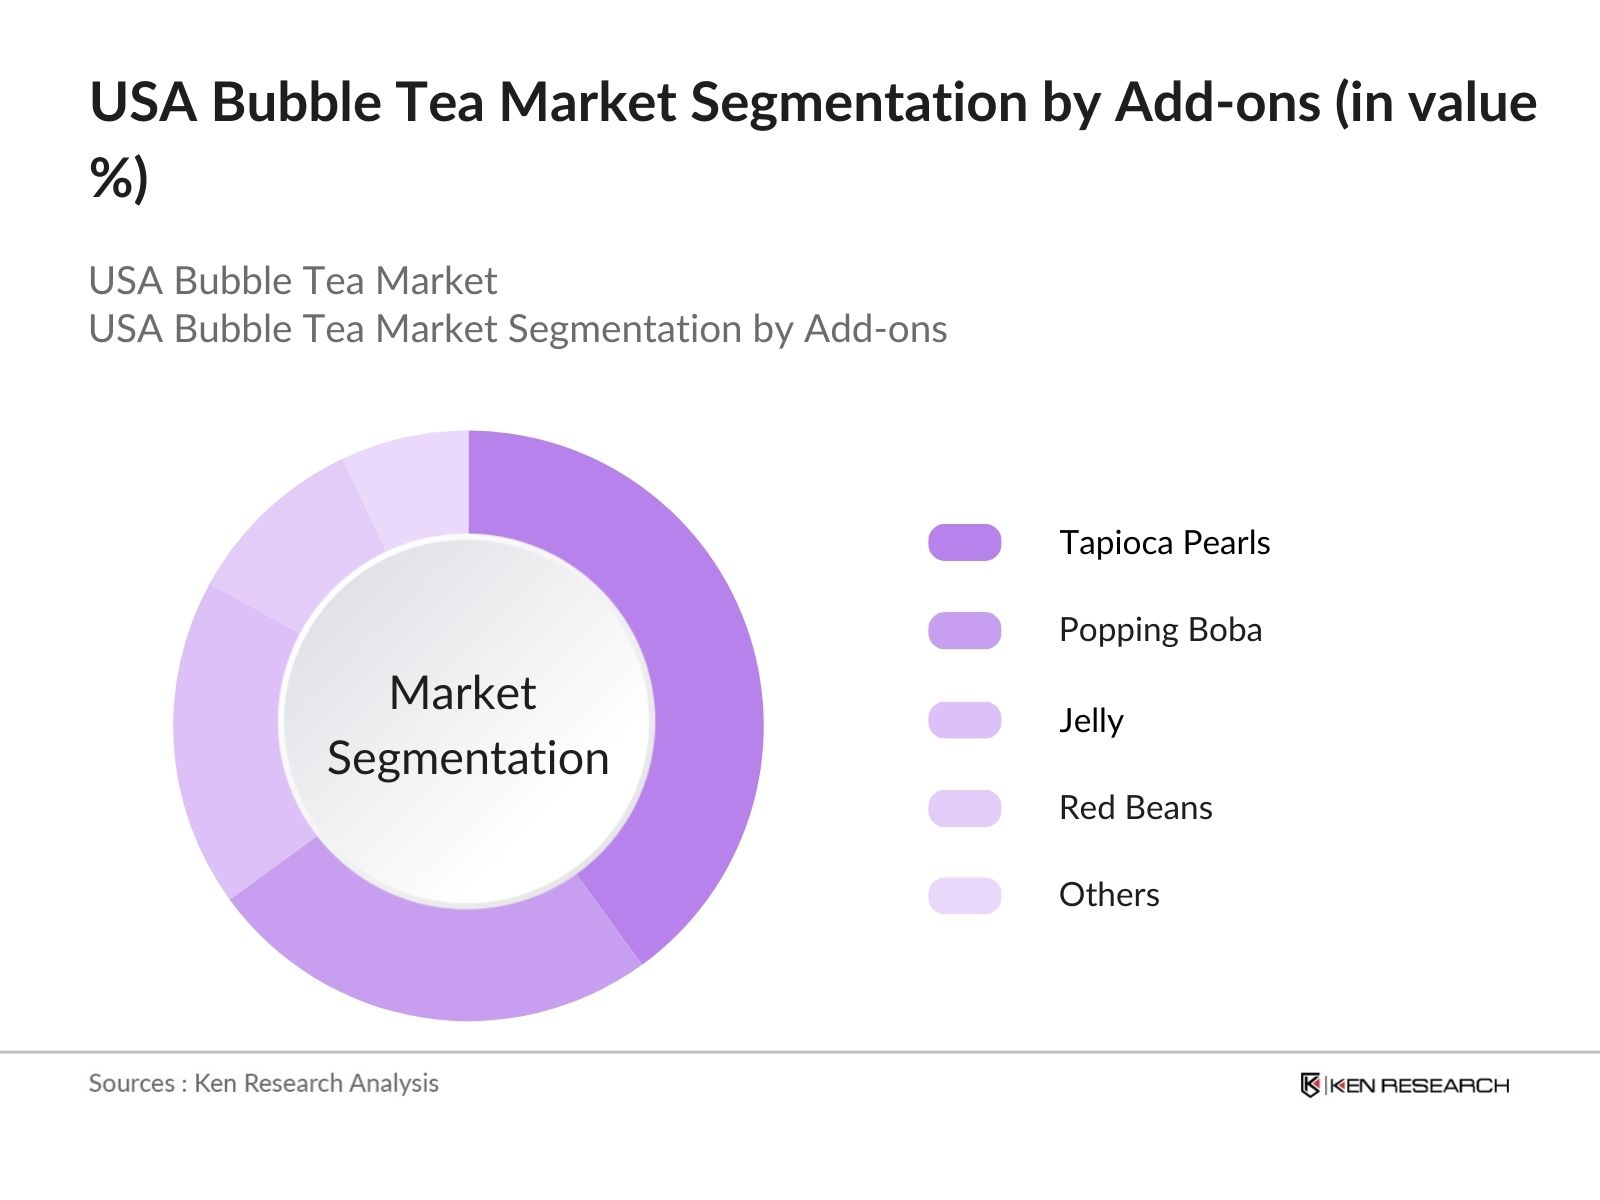
By Add-ons: The market is also segmented by add-ons into Tapioca Pearls, Popping Boba, Jelly (Aloe Vera, Grass Jelly), Red Beans, and Others. Tapioca pearls hold a dominant market share, owing to their long-standing popularity as the classic add-on for bubble tea. Consumers are drawn to the unique texture and chewy consistency, which has become a defining characteristic of bubble tea. Despite the rise of other add-ons, tapioca pearls continue to be the top choice for consumers.
USA Bubble Tea Market Competitive Landscape
The market is consolidated with a few key players dominating the industry. Major competitors have a strong national and regional presence, leveraging brand loyalty and innovative product offerings to maintain their market position.
|
Company Name |
Establishment Year |
Headquarters |
Number of Stores |
Revenue (USD Mn) |
Brand Loyalty |
Innovation Index |
Marketing Spend |
Geographical Reach |
Product Customization |
|
Kung Fu Tea |
2010 |
New York, USA |
|||||||
|
CoCo Fresh Tea & Juice |
1997 |
Taiwan |
|||||||
|
Boba Guys |
2011 |
San Francisco, USA |
|||||||
|
Gong Cha USA |
2006 |
Taiwan |
|||||||
|
Sharetea |
1992 |
Taiwan |
USA Bubble Tea Market Analysis
Market Growth Drivers
- Increasing Demand for Customizable Bubble Tea Options: The rise in consumer preference for customizable beverages is driving growth in the market. Consumers are opting for a variety of toppings such as boba, fruit jellies, and flavored syrups. For instance, the number of bubble tea shops in urban areas across the USA has seen substantial growth, with New York City alone recording over 250 new bubble tea stores in 2023.
- Rising Health Awareness and Demand for Healthier Options: With increasing health consciousness among consumers, there has been a demand for healthier versions of bubble tea. Organic and low-sugar variants have seen a notable rise in sales, with approximately 550,000 units of low-calorie bubble tea sold in 2024. This aligns with the macroeconomic shift in health-focused diets across the USA, where food and beverage sectors catering to this trend have seen consumer expenditure exceeding $25 billion annually.
- Expansion of Bubble Tea Franchises in Suburban Areas: The expansion of established bubble tea franchises into suburban and smaller metropolitan areas has been a key growth driver in 2024. Previously concentrated in major cities, bubble tea chains have opened over 400 new stores in suburban areas like Arizona, Texas, and North Carolina. These newly opened outlets have reported a combined revenue of $45 million in the first two quarters of 2024, signaling strong demand and market penetration in non-urban areas.
Market Challenges
- Supply Chain Disruptions for Key Ingredients: The market faced supply chain disruptions in 2024 due to geopolitical tensions affecting the sourcing of tapioca pearls from Taiwan and Thailand. Import delays caused a shortfall in supplies, leading to an estimated loss of $15 million in revenue for retailers in Q1 2024. This supply chain instability has emerged as a major challenge, affecting product availability and pricing for bubble tea operators.
- Increased Competition from Local Beverage Brands: Local beverage brands are offering similar products at lower prices, posing a significant challenge to bubble tea businesses. With approximately 200 local beverage startups entering the USA market in 2024, bubble tea chains have seen a drop in sales by approximately 100,000 units in competitive regions such as California and Florida. This rise in competition has intensified market saturation, especially in densely populated states.
USA Bubble Tea Market Future Outlook
Over the next five years, the USA Bubble Tea industry is expected to show growth, driven by continuous consumer demand for customizable beverages, the introduction of healthier tea options, and the expansion of bubble tea chains into suburban and rural areas.
Future Market Opportunities
- Increased Adoption of Health-Conscious Bubble Tea Products: Over the next five years, the market will likely see a growing trend in health-conscious product lines. By 2029, the market is expected to introduce an estimated 1,000 new low-sugar and organic bubble tea varieties as consumer preferences shift toward healthier options. This will contribute to an estimated $80 million increase in annual sales for businesses adopting these innovations.
- Expansion of Delivery-Only Bubble Tea Models: As online food ordering continues to rise, the market will likely see growth in delivery-only stores. By 2029, it is projected that over 500 bubble tea brands will operate through cloud kitchens, driving over $100 million in annual revenue. This business model will allow retailers to reach a broader audience while reducing overhead costs associated with physical stores.
Scope of the Report
|
Base Ingredient |
Green Tea Black Tea Oolong Tea White Tea Others |
|
Flavor |
Classic Fruit-based Chocolate-based Matcha Others |
|
Add-ons |
Tapioca Pearls Popping Boba Jelly (Aloe Vera, Grass Jelly) Red Beans, Others |
|
Distribution Channel |
Offline (Specialty Stores, Cafes, Restaurants) Online |
|
Region |
North East South West |
Products
Key Target Audience Organizations and Entities Who Can Benefit by Subscribing This Report:
Investor and Venture Capitalist Firms
Banks and Financial Institution
Government and Regulatory Bodies (FDA, USDA)
Beverage Equipment Manufacturers
Private Equity Firms
Tea Manufacturers Companies
Companies
Players Mentioned in the Report:
Kung Fu Tea
CoCo Fresh Tea & Juice
Boba Guys
Gong Cha USA
The Alley
Tiger Sugar
Sharetea
Yi Fang Taiwan Fruit Tea
Happy Lemon
Vivi Bubble Tea
Teaspoon
Ding Tea USA
Lollicup Fresh
Koi Th USA
Hokkaido Bubble Tea
Table of Contents
USA Bubble Tea Market Overview
1.1. Definition and Scope
1.2. Market Taxonomy
1.3. Market Growth Rate (USD Value Growth)
1.4. Market Segmentation Overview
USA Bubble Tea Market Size (In USD Mn)
2.1. Historical Market Size
2.2. Year-On-Year Growth Analysis
2.3. Key Market Developments and Milestones
USA Bubble Tea Market Analysis
3.1. Growth Drivers
3.1.1. Rising Consumer Preference for Specialty Beverages
3.1.2. Increasing Availability of Customizable Flavor Options
3.1.3. Expansion of Bubble Tea Franchises and Chains
3.1.4. Health Conscious Consumers Opting for Alternative Tea Blends
3.2. Market Challenges
3.2.1. High Sugar Content Impacting Health-Conscious Demographics
3.2.2. Fluctuation in Raw Material Prices (Tea, Tapioca Pearls)
3.2.3. Increasing Competition from Other Specialty Beverages
3.2.4. Supply Chain Disruptions in Tapioca and Flavor Ingredients
3.3. Opportunities
3.3.1. Integration of Healthier Ingredient Options (Sugar Alternatives, Organic)
3.3.2. Expansion into Untapped Markets (Rural and Tier 2/3 Cities)
3.3.3. Introduction of Ready-to-Drink (RTD) Bubble Tea Products
3.3.4. Innovative Marketing Strategies for Millennial and Gen Z Consumers
3.4. Trends
3.4.1. Rise in Vegan and Dairy-Free Bubble Tea Options
3.4.2. Adoption of Sustainable Packaging in Bubble Tea Stores
3.4.3. Increasing Use of Exotic Flavors (Lychee, Matcha, Taro)
3.4.4. Customizable Add-ins (Popping Boba, Aloe Vera, Grass Jelly)
3.5. Government Regulation
3.5.1. FDA Regulations on Food and Beverage Safety
3.5.2. Local Health Guidelines for Beverage Shops
3.5.3. Tax Incentives for Small Business Owners in the Beverage Industry
3.5.4. Regulations on Labeling and Nutritional Information
3.6. SWOT Analysis
3.7. Stakeholder Ecosystem
3.8. Porters Five Forces
3.9. Competitive Landscape
USA Bubble Tea Market Segmentation
4.1. By Base Ingredient (In Value %)
4.1.1. Green Tea
4.1.2. Black Tea
4.1.3. Oolong Tea
4.1.4. White Tea
4.1.5. Others
4.2. By Flavor (In Value %)
4.2.1. Classic
4.2.2. Fruit-based
4.2.3. Chocolate-based
4.2.4. Matcha
4.2.5. Others
4.3. By Add-ons (In Value %)
4.3.1. Tapioca Pearls
4.3.2. Popping Boba
4.3.3. Jelly (Aloe Vera, Grass Jelly)
4.3.4. Red Beans
4.3.5. Others
4.4. By Distribution Channel (In Value %)
4.4.1. Offline (Specialty Stores, Cafes, Restaurants)
4.4.2. Online
4.5. By Region (In Value %)
4.5.1. North
4.5.2. East
4.5.3. South
4.5.4. West
USA Bubble Tea Market Competitive Analysis
5.1. Detailed Profiles of Major Competitors
5.1.1. Kung Fu Tea
5.1.2. Chatime USA
5.1.3. CoCo Fresh Tea & Juice
5.1.4. Boba Guys
5.1.5. Gong Cha USA
5.1.6. The Alley
5.1.7. Tiger Sugar
5.1.8. Yi Fang Taiwan Fruit Tea
5.1.9. Sharetea
5.1.10. Koi Th USA
5.1.11. Vivi Bubble Tea
5.1.12. Happy Lemon
5.1.13. Ding Tea USA
5.1.14. Teaspoon
5.1.15. Lollicup Fresh
5.2. Cross Comparison Parameters (Revenue, Number of Stores, Region Presence, Brand Recognition, Marketing Spend, Product Customization, Customer Reviews, Market Share)
5.3. Market Share Analysis
5.4. Strategic Initiatives
5.5. Mergers and Acquisitions
5.6. Investment Analysis
5.7. Venture Capital Funding
5.8. Private Equity Investments
USA Bubble Tea Market Regulatory Framework
6.1. Food Safety Standards
6.2. Labeling Requirements for Nutritional Information
6.3. Certifications for Organic and Health-Conscious Ingredients
USA Bubble Tea Future Market Size (In USD Mn)
7.1. Future Market Size Projections
7.2. Key Factors Driving Future Market Growth
USA Bubble Tea Future Market Segmentation
8.1. By Base Ingredient
8.2. By Flavor
8.3. By Add-ons
8.4. By Distribution Channel
8.5. By Region
USA Bubble Tea Market Analysts Recommendations
9.1. TAM/SAM/SOM Analysis
9.2. Consumer Demographics and Preferences
9.3. Product Innovation and Differentiation Strategies
9.4. Marketing Initiatives for Brand Growth
Research Methodology
Step 1: Identification of Key Variables
The initial step involves constructing an ecosystem map of the USA Bubble Tea Market, encompassing key stakeholders such as tea suppliers, tapioca producers, and cafe owners. Data from both secondary and proprietary databases were leveraged to identify crucial variables that impact the market, including consumer preferences and supply chain challenges.
Step 2: Market Analysis and Construction
In this phase, historical data on sales, market penetration, and product preferences were analyzed to estimate the USA Bubble Tea Market's current and potential revenue. The market analysis also included a review of store expansion patterns and regional dominance to understand geographical dynamics.
Step 3: Hypothesis Validation and Expert Consultation
We developed several market hypotheses based on consumer behavior, raw material availability, and competitive strategies. These hypotheses were validated through in-depth interviews with key industry experts, cafe owners, and supply chain managers to ensure accuracy and credibility of the data.
Step 4: Research Synthesis and Final Output
The final step involved synthesizing data from industry experts and market reports to generate a comprehensive view of the USA Bubble Tea Market. The insights from this research were then consolidated to form accurate market size and segmentation estimates, ensuring the reports relevance for business professionals.
Frequently Asked Questions
How big is the USA Bubble Tea Market?
The USA Bubble Tea Market was valued at USD 400 million, driven by rising consumer demand for customizable and specialty beverages across urban centers.
What are the challenges in the USA Bubble Tea Market?
Challenges in the USA Bubble Tea Market include fluctuating raw material prices, particularly for tapioca and tea leaves, and the increasing competition from other beverage categories like specialty coffees and smoothies.
Who are the major players in the USA Bubble Tea Market?
Major players in the USA Bubble Tea Market include Kung Fu Tea, CoCo Fresh Tea & Juice, Boba Guys, Gong Cha USA, and Sharetea, all of whom have established a strong brand presence across major cities.
What are the growth drivers of the USA Bubble Tea Market?
The USA Bubble Tea Market growth is driven by consumer preferences for customizable beverages, the increasing availability of healthier tea options, and the rise of bubble tea chains expanding into new markets.
Which regions dominate the USA Bubble Tea Market?
Cities like Los Angeles, New York, and San Francisco dominate the USA Bubble Tea Market due to their multicultural population and a strong cafe culture that embraces specialty beverages.
Why Buy From Us?
 Framework")
What makes us stand out is that our consultants follows Robust, Refine and Result (RRR) methodology. i.e. Robust for clear definitions, approaches and sanity checking, Refine for differentiating respondents facts and opinions and Result for presenting data with story

We have set a benchmark in the industry by offering our clients with syndicated and customized market research reports featuring coverage of entire market as well as meticulous research and analyst insights.

While we don't replace traditional research, we flip the method upside down. Our dual approach of Top Bottom & Bottom Top ensures quality deliverable by not just verifying company fundamentals but also looking at the sector and macroeconomic factors.

With one step in the future, our research team constantly tries to show you the bigger picture. We help with some of the tough questions you may encounter along the way: How is the industry positioned? Best marketing channel? KPI's of competitors? By aligning every element, we help maximize success.

Our report gives you instant access to the answers and sources that other companies might choose to hide. We elaborate each steps of research methodology we have used and showcase you the sample size to earn your trust.

If you need any support, we are here! We pride ourselves on universe strength, data quality, and quick, friendly, and professional service.