USA Business Intelligence Market Outlook to 2030
Region:United States
Author(s):Shubham Kashyap
Product Code:KROD2005
Region:United States
Author(s):Shubham Kashyap
Product Code:KROD2005
June 2025
90
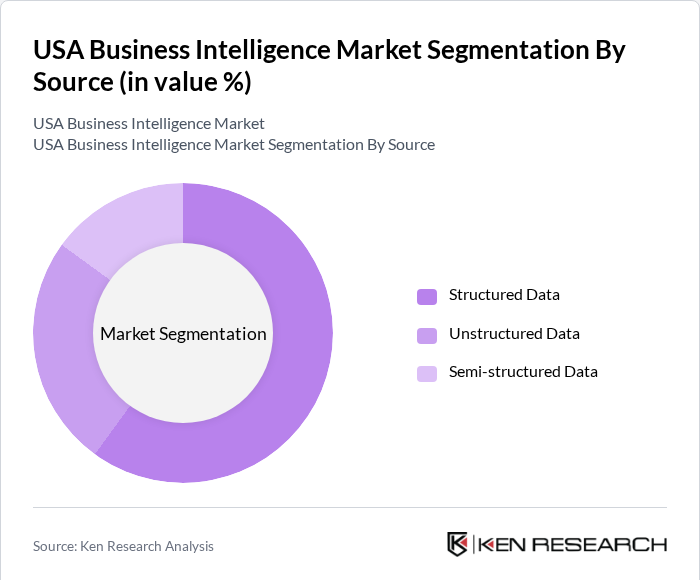
By Source:The market is segmented by source into Structured Data and Unstructured Data. Structured Data dominates because most organizations rely on well-defined, relational databases—such as ERP, CRM, and financial reporting systems—to feed their BI platforms. These systems provide consistent, high-quality information that underpins dashboards, scorecards, and predefined reporting workflows. As enterprises prioritize accuracy, compliance, and ease of integration, they continue to invest heavily in extracting insights from structured repositories, leaving unstructured sources—such as emails, social media, and free-text clinical notes still emerging in terms of BI adoption.
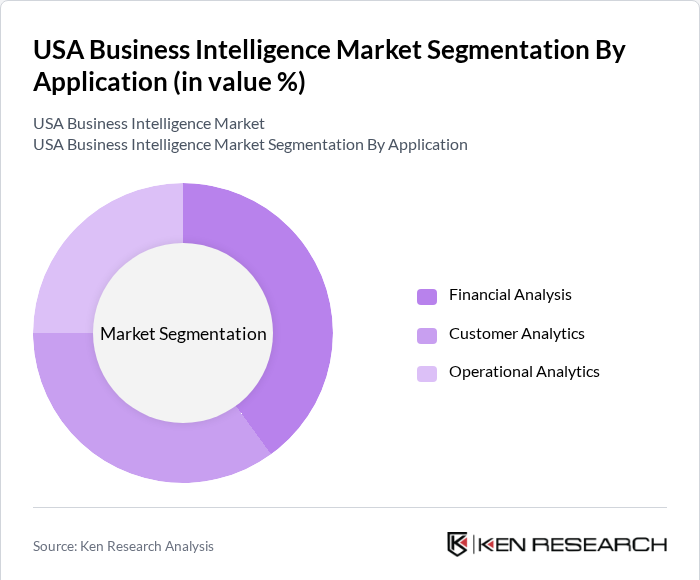
By Application: The market is segmented by application into Financial Analytics, Operational Analytics, Marketing Analytics, and Fraud Detection. Financial Analytics dominates because companies place the highest priority on revenue forecasting, budgeting, and profitability analysis. BI tools that consolidate general ledger, accounts payable/receivable, and cash-flow data enable CFOs and finance teams to produce timely, accurate financial reports and projections. As regulatory requirements tighten and investor scrutiny increases, organizations have focused their BI investments on financial modules, driving this segment’s leadership over operational, marketing, and fraud-detection applications.
The competitive environment features intensified focus on AI-powered analytics, with Microsoft and Tableau recently introducing natural language processing capabilities for business users. Cloud migration continues to reshape delivery models, with majority of new BI implementations now using cloud-first architectures.
The future of the USA Business Intelligence market appears promising, driven by ongoing technological advancements and an increasing emphasis on data-driven strategies. Organizations are expected to continue investing in innovative analytics solutions to enhance operational efficiency and customer engagement.
| By Source |
Structured Data Unstructured Data |
| By Application |
Financial Analytics Operational Analytics Marketing Analytics Fraud Detection |
| By Deployment Mode |
On-Premises Cloud-Based |
| By End-User |
Small and Medium Enterprises (SMEs) Large Enterprises Government |
| By Region |
North America Europe Asia-Pacific Latin America Middle East and Africa |
1.1. Definition and Scope
1.2. Market Taxonomy
1.3. Market Growth Rate
1.4. Market Segmentation Overview
2.1. Historical Market Size
2.2. Year-On-Year Growth Analysis
2.3. Key Market Developments and Milestones
3.1. Growth Drivers
3.1.1. Increasing Demand for Data-Driven Decision Making
3.1.2. Advancements in Data Analytics Technologies
3.1.3. Rising Adoption of Cloud-Based Solutions
3.2. Market Challenges
3.2.1. Data Privacy and Security Concerns
3.2.2. High Implementation Costs
3.2.3. Lack of Skilled Workforce
3.3. Opportunities
3.3.1. Expansion of AI and Machine Learning in BI Tools
3.3.2. Growing Need for Real-Time Analytics
3.3.3. Increasing Focus on Customer Experience Management
3.4. Trends
3.4.1. Integration of BI with IoT Technologies
3.4.2. Rise of Self-Service BI Tools
3.4.3. Enhanced Data Visualization Techniques
3.5. Government Regulation
3.5.1. Compliance with GDPR and CCPA
3.5.2. Regulations on Data Storage and Processing
3.5.3. Industry-Specific Compliance Standards
3.5.4. Impact of Federal Policies on Data Management Practices
3.6. SWOT Analysis
3.7. Stake Ecosystem
3.8. Porter’s Five Forces
3.9. Competition Ecosystem
4.1. By Source
4.1.1. Structured Data
4.1.2. Unstructured Data
4.2. By Application
4.2.1. Financial Analytics
4.2.2. Operational Analytics
4.2.3. Marketing Analytics
4.2.4. Fraud Detection
4.3. By Deployment Mode
4.3.1. On-Premises
4.3.2. Cloud-Based
4.4. By End-User
4.4.1. Small and Medium Enterprises (SMEs)
4.4.2. Large Enterprises
4.4.3. Government
4.5. By Region
4.5.1. North America
4.5.2. Europe
4.5.3. Asia-Pacific
4.5.4. Latin America
4.5.5. Middle East and Africa
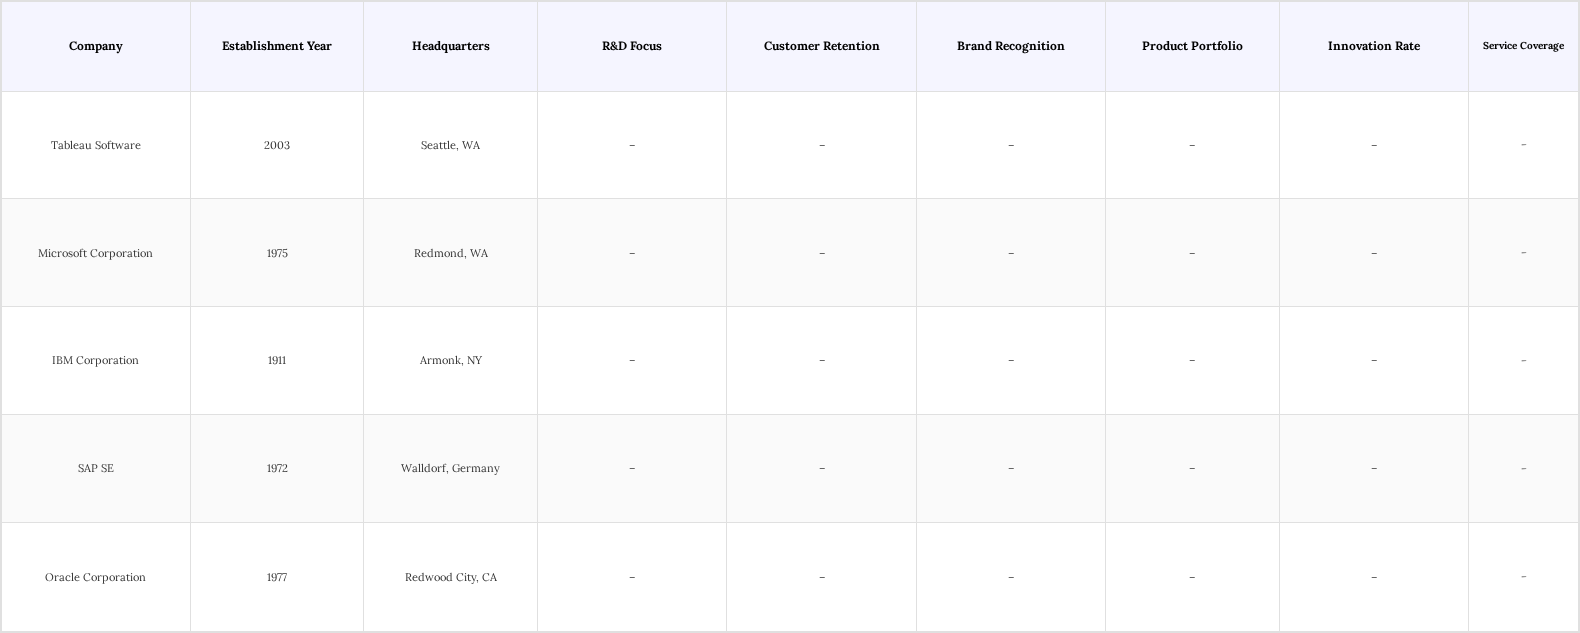
5.1. Detailed Profiles of Major Companies
5.1.1. Tableau Software
5.1.2. Microsoft Corporation
5.1.3. IBM Corporation
5.1.4. SAP SE
5.1.5. Oracle Corporation
5.1.6. QlikTech International AB
5.1.7. Sisense Inc.
5.1.8. Domo, Inc.
5.1.9. TIBCO Software Inc.
5.1.10. MicroStrategy Incorporated
5.2. Cross Comparison Parameters
5.2.1. Market Share Analysis
5.2.2. Revenue Growth Rate
5.2.3. Product Portfolio Diversity
5.2.4. Customer Satisfaction Ratings
5.2.5. Innovation Index
5.2.6. Geographic Presence
5.2.7. Strategic Partnerships and Alliances
5.2.8. Pricing Strategies
6.1. Environmental Standards
6.2. Compliance Requirements
6.3. Certification Processes
7.1. Future Market Size Projections
7.2. Key Factors Driving Future Market Growth
8.1. By Source
8.1.1. Structured Data
8.1.2. Unstructured Data
8.2. By Application
8.2.1. Financial Analytics
8.2.2. Operational Analytics
8.2.3. Marketing Analytics
8.2.4. Fraud Detection
8.3. By Deployment Mode
8.3.1. On-Premises
8.3.2. Cloud-Based
8.4. By End-User
8.4.1. Small and Medium Enterprises (SMEs)
8.4.2. Large Enterprises
8.4.3. Government
8.5. By Region
8.5.1. North America
8.5.2. Europe
8.5.3. Asia-Pacific
8.5.4. Latin America
8.5.5. Middle East and Africa
9.1. TAM/SAM/SOM Analysis
9.2. Customer Cohort Analysis
9.3. Marketing Initiatives
9.4. White Space Opportunity Analysis
The initial phase involves constructing an ecosystem map encompassing all major stakeholders within the USA Business Intelligence Market. This step is underpinned by extensive desk research, utilizing a combination of secondary and proprietary databases to gather comprehensive industry-level information. The primary objective is to identify and define the critical variables that influence market dynamics.
In this phase, we will compile and analyze historical data pertaining to the USA Business Intelligence Market. This includes assessing market penetration, the ratio of marketplaces to service providers, and the resultant revenue generation. Furthermore, an evaluation of service quality statistics will be conducted to ensure the reliability and accuracy of the revenue estimates.
Market hypotheses will be developed and subsequently validated through computer-assisted telephone interviews (CATIS) with industry experts representing a diverse array of companies. These consultations will provide valuable operational and financial insights directly from industry practitioners, which will be instrumental in refining and corroborating the market data.
The final phase involves direct engagement with multiple manufacturers to acquire detailed insights into product segments, sales performance, consumer preferences, and other pertinent factors. This interaction will serve to verify and complement the statistics derived from the bottom-up approach, thereby ensuring a comprehensive, accurate, and validated analysis of the USA Business Intelligence Market.
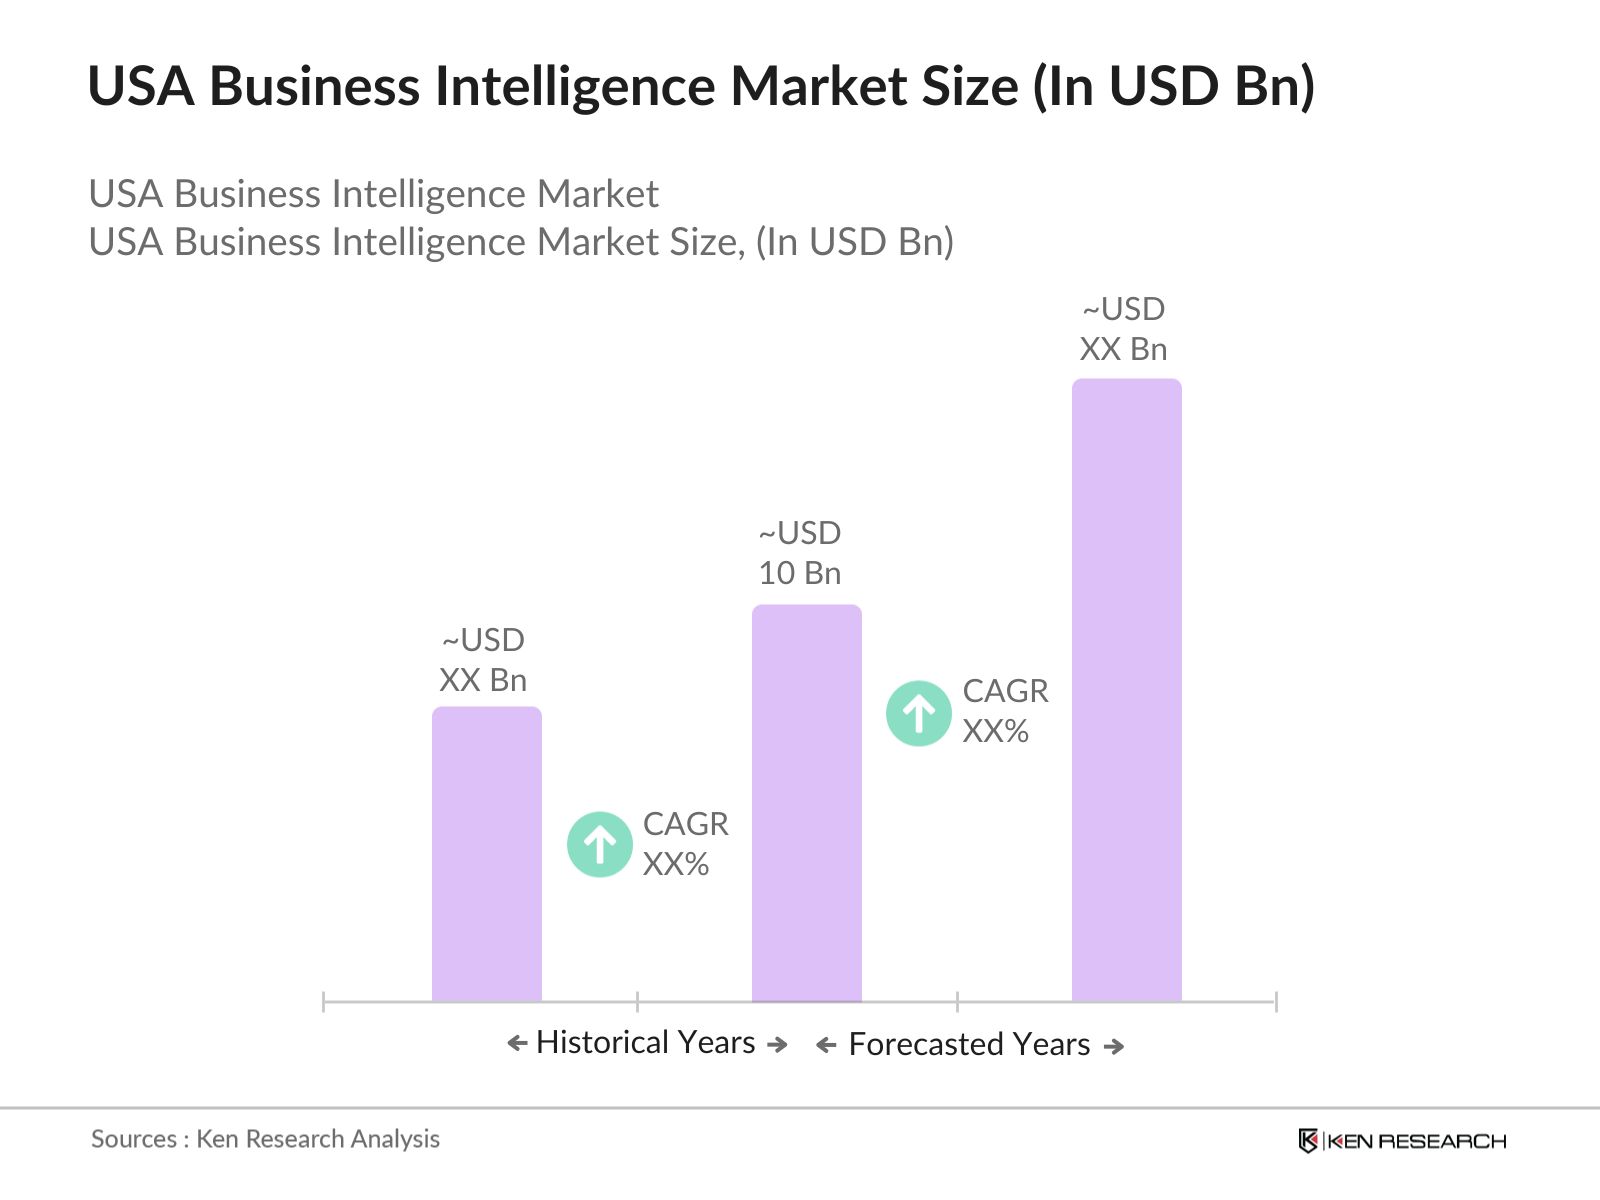
The USA Business Intelligence Market is valued at USD 10 billion, driven by factors such as increasing demand, technological advancements, and supportive government initiatives.
Key challenges in the USA Business Intelligence Market include intense competition, regulatory complexities, and infrastructure limitations affecting market dynamics.
Major players in the USA Business Intelligence Market include Tableau Software, Microsoft Corporation, IBM Corporation, SAP SE, Oracle Corporation, among others.
The primary growth drivers for the USA Business Intelligence Market are increasing consumer demand, favorable policies, innovation, and substantial investment inflows.
 Framework")
What makes us stand out is that our consultants follows Robust, Refine and Result (RRR) methodology. i.e. Robust for clear definitions, approaches and sanity checking, Refine for differentiating respondents facts and opinions and Result for presenting data with story

We have set a benchmark in the industry by offering our clients with syndicated and customized market research reports featuring coverage of entire market as well as meticulous research and analyst insights.

While we don't replace traditional research, we flip the method upside down. Our dual approach of Top Bottom & Bottom Top ensures quality deliverable by not just verifying company fundamentals but also looking at the sector and macroeconomic factors.

With one step in the future, our research team constantly tries to show you the bigger picture. We help with some of the tough questions you may encounter along the way: How is the industry positioned? Best marketing channel? KPI's of competitors? By aligning every element, we help maximize success.

Our report gives you instant access to the answers and sources that other companies might choose to hide. We elaborate each steps of research methodology we have used and showcase you the sample size to earn your trust.

If you need any support, we are here! We pride ourselves on universe strength, data quality, and quick, friendly, and professional service.