CHAPTER 1 - MARKET SUMMARY
Market Overview
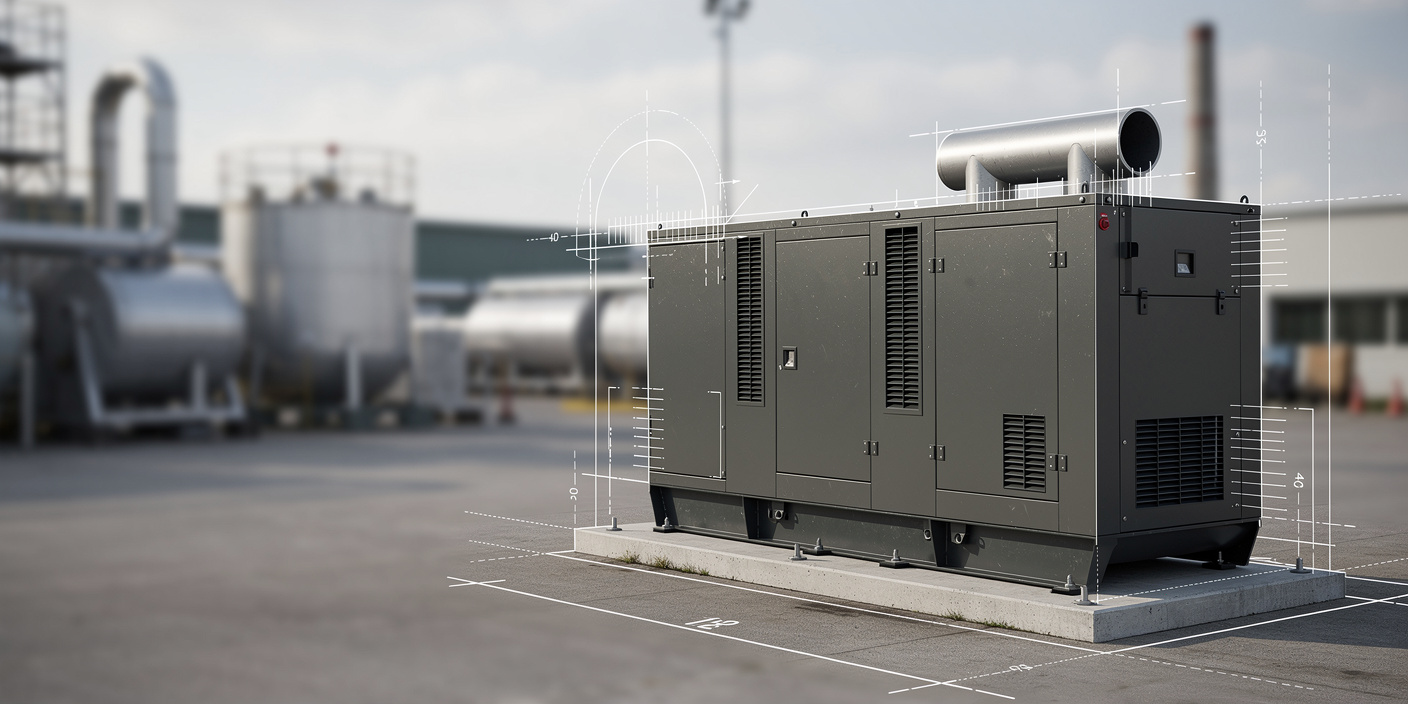
The USA Diesel Generator Market operates through engine and alternator manufacturers, generator-set assemblers, control-system suppliers, authorized dealers, engineering contractors, rental fleets, and facility operators. Demand is primarily linked to outage exposure and continuity requirements. U.S. electricity customers experienced nearly 11 hours of interruption during 2024, reinforcing procurement across hospitals, data centers, utilities, telecommunications sites, and industrial facilities where downtime costs exceed equipment ownership costs.
The South represents the largest demand cluster, accounting for an estimated 33% of 2025 market revenue. Texas and the Gulf Coast combine data center construction, petroleum operations, manufacturing, logistics hubs, severe-weather exposure, and dispersed infrastructure. Florida and the Southeast add hurricane-related resilience spending. This concentration supports dense dealer networks, rental fleets, fuel logistics, and field-service capacity, strengthening regional economics for suppliers with rapid-response capabilities.
Market Value
USD 2,670 Mn
2025
Dominant Region
South, 33% of 2025 revenue
Dominant Segment
Standby Generator Sets, with Hybrid Diesel-Battery Systems fastest growing
Total Number of Players
60
Future Outlook
The USA Diesel Generator Market is projected to increase from USD 2,670 Mn in 2025 to USD 3,418 Mn by 2031, representing a forecast CAGR of 4.2%. Growth will be driven by data center power density, aging grid infrastructure, weather-related outages, industrial reshoring, healthcare continuity requirements, and construction activity. The forecast is more moderate than the 5.9% historical CAGR because pandemic-era supply constraints, inflation, and accelerated replacement demand created a high comparison base. Large standby systems should outperform the overall market as hyperscale, colocation, semiconductor, utility, and institutional customers prioritize modular redundancy and rapid load acceptance.
Volume is projected to rise from approximately 124,000 units in 2025 to 148,000 units in 2031, while the blended average selling price increases from USD 21,530 to USD 23,090 per unit. Above-750-kVA equipment is expected to expand from 29% to 35% of revenue as higher-capacity installations require synchronization, fuel systems, switchgear, emissions packages, and acoustic engineering. Hybrid systems will gain share where batteries can handle short-duration outages and load transitions, while diesel remains valuable for extended runtime. Suppliers with nationwide service, remote monitoring, emissions expertise, and engineered integration should capture the strongest account economics.
4.2%
Forecast CAGR
USD 3,418 Mn
2030 Projection
Base Year
2025
Historical Period
2020-2025
Forecast Period
2026-2031
Historical CAGR
5.9%
CHAPTER 2 - SCOPE OF REPORT
Scope of the Market
CHAPTER 3 - Key Stakeholders
Key Target Audience
Key stakeholders who can leverage from this market analysis for investment, strategy, and operational planning.
Investors
CAGR, recurring service revenue, margins, concentration, technology displacement
Corporates
uptime, installed cost, fuel autonomy, emissions, lifecycle service
Government
resilience, emissions compliance, critical infrastructure, fuel security, permitting
Operators
runtime, load acceptance, maintenance, remote monitoring, spare availability
Financial institutions
project finance, utilization, residual value, covenants, demand stability
CHAPTER 4 - Market Size & Growth
Market Size, Growth Forecast and Trends
This section evaluates the historical market size, analyzes year-over-year growth dynamics, and presents forecast projections supported by market performance indicators and demand-side drivers.
Historical & Projected Market Size ($ Million)
Year-over-Year Growth Rate (%)
Market Value vs Volume Growth (%)
Historical Market Performance (2020-2025)
Historical performance strengthened most sharply in 2022, when market growth reached 9.7% as deferred capital expenditure, high construction activity, supply constraints, equipment inflation, and resilience spending converged. Growth moderated to 4.1% in 2024 as dealer inventories normalized and price escalation eased. Estimated shipments increased from 104,000 units in 2020 to 124,000 units in 2025, while the blended average selling price rose from approximately USD 19,230 to USD 21,530. The strongest revenue concentration occurred in standby applications, high-capacity systems, data centers, commercial facilities, and industrial continuity projects.
Forecast Market Outlook (2026-2031)
The forecast assumes stable 4.2% annual value growth, combining approximately 3.0% unit expansion with 1.1% to 1.2% annual price and mix improvement. Revenue is projected to increase by USD 748 Mn between 2025 and 2031. Shipments rise by approximately 24,000 units, while the blended average selling price reaches USD 23,090. Above-750-kVA equipment increases from 29% to 35% of revenue as data centers, large industrial sites, healthcare campuses, utilities, and engineered microgrids deploy higher-capacity systems. Remote monitoring, emissions packages, renewable diesel compatibility, and battery integration support specification premiums.
CHAPTER 5 - Market Data
Market Breakdown
The USA Diesel Generator Market combines relatively stable replacement demand with project-driven high-capacity installations. Its revenue trajectory is increasingly influenced by data center loads, higher-kVA product mix, emissions engineering, and integrated resilience architectures.
Year | Market Size (USD Mn) | YoY Growth (%) | Shipments (000 Units) | Blended ASP (USD 000/Unit) | Above 750 kVA Revenue Mix (%) | Period |
|---|---|---|---|---|---|---|
| 2020 | $2,000 Mn | +- | 104.0 | 19.23 | Forecast | |
| 2021 | $2,115 Mn | +5.8% | 108.5 | 19.49 | Forecast | |
| 2022 | $2,320 Mn | +9.7% | 116.0 | 20.00 | Forecast | |
| 2023 | $2,459 Mn | +6.0% | 119.5 | 20.58 | Forecast | |
| 2024 | $2,560 Mn | +4.1% | 121.9 | 21.00 | Forecast | |
| 2025 | $2,670 Mn | +4.3% | 124.0 | 21.53 | Forecast | |
| 2026F | $2,782 Mn | +4.2% | 127.7 | 21.79 | Forecast | |
| 2027F | $2,899 Mn | +4.2% | 131.5 | 22.05 | Forecast | |
| 2028F | $3,021 Mn | +4.2% | 135.4 | 22.31 | Forecast | |
| 2029F | $3,148 Mn | +4.2% | 139.5 | 22.57 | Forecast | |
| 2030F | $3,280 Mn | +4.2% | 143.7 | 22.83 | Forecast | |
| 2031F | $3,418 Mn | +4.2% | 148.0 | 23.09 | Forecast |
Generator Shipments
124,000 units, 2025, United States. Shipment growth supports engine, alternator, enclosure, dealer, and installation demand. U.S. construction spending operated at an annualized rate exceeding USD 2.1 trillion in June 2025, sustaining temporary and permanent power requirements.
Blended ASP
USD 21,530 per unit, 2025, United States. ASP is supported by large-kVA equipment, emissions treatment, paralleling controls, transfer systems, acoustic packages, and engineered integration. Higher specification density makes revenue growth less dependent on unit growth alone. Source: Ken Research V02 triangulation, 2026.
Above 750 kVA Revenue Mix
29.0%, 2025, United States. High-capacity mix improves project value but increases engineering and service complexity. Data centers consumed 176 TWh in 2023 and could consume 325-580 TWh by 2028.
CHAPTER 6 - Segmentation
Market Segmentation Framework
Comprehensive analysis across key dimensions providing insights into market structure, buyer requirements, equipment specifications, route-to-market economics, and geographic demand patterns.
No of Segments
7
Dominant Segment
Product Type
Fastest Growing Segment
Technology
Product Type
Power Rating
End-Use Industry
Application
Sales Channel
Technology
Geography
Key Segmentation Takeaways
Comprehensive analysis across all extracted segmentation dimensions provides insight into revenue concentration, buyer decision criteria, equipment scale, technology adoption, and distribution economics.
Product Type
Standby Generator Sets dominate because U.S. hospitals, data centers, commercial buildings, public facilities, telecommunications sites, and industrial plants purchase diesel equipment primarily as emergency infrastructure. Standby systems also carry substantial accessory revenue from controls, enclosures, transfer switches, fuel systems, and installation engineering. Prime power remains important in construction, mining, energy, and remote operations but serves a narrower operating requirement.
Technology
Hybrid Diesel-Battery Systems are the fastest-growing technology category as batteries absorb short-duration outages, frequency events, start-up transitions, and peak loads while diesel equipment provides extended runtime. Renewable-diesel-compatible equipment also expands as fuel supply increases. Market adoption depends on controls interoperability, battery economics, fire-code compliance, fuel certification, service capability, and the ability to demonstrate lifecycle savings without compromising resilience.
CHAPTER 7 - Regional Analysis
Regional Analysis
The United States is the largest diesel generator equipment market among the selected North American and advanced-economy peers. Its position reflects high electricity consumption, extensive data center development, broad industrial activity, severe-weather exposure, and a mature OEM, dealer, rental, and service ecosystem. Peer values use a harmonized equipment-sales scope for comparability.
Focus Country Ranking
1st
Focus Country Market Size
USD 2.67 Bn (2025)
Focus Country CAGR (2026-2031)
4.2%
Focus Country Ranking
1st
Focus Country Market Size
USD 2.67 Bn (2025)
Focus Country CAGR (2026-2031)
4.2%
Regional Analysis (Current Year)
Regional Analysis Comparison
| Metric | United States | Germany | Japan | Canada | Mexico |
|---|---|---|---|---|---|
| Market Size (2025) | USD 2.67 Bn | USD 0.49 Bn | USD 0.47 Bn | USD 0.43 Bn | USD 0.36 Bn |
| CAGR (%) (2026-2031) | 4.2% | 3.4% | 3.2% | 4.0% | 5.6% |
| Annual Electricity Use (TWh) | Approximately 4,100 | Approximately 510 | Approximately 900 | Approximately 580 | Approximately 340 |
| Stationary Compression-Ignition Policy Framework | EPA NSPS, RICE NESHAP and state permits | EU Stage V and national air-quality rules | National nonroad standards and local air rules | Federal compression-ignition rules and provincial permits | NOM emissions standards and local operating permits |
Market Position
The United States ranks first at USD 2.67 Bn in 2025, supported by approximately 4,100 TWh of annual electricity use and the largest data center demand pool among selected peers.
Growth Advantage
The U.S. forecast CAGR of 4.2% exceeds Germany's 3.4% and Japan's 3.2%, but trails Mexico's 5.6%, reflecting a larger installed base and more mature replacement cycle.
Competitive Strengths
The United States combines 176 TWh of data center electricity use, national Tier-certified engine requirements, extensive dealers, and large rental fleets, supporting high-capacity sales and recurring service demand.
CHAPTER 8 - INDUSTRY ANALYSIS
Growth Drivers, Market Challenges & Market Opportunities
Comprehensive analysis of key factors shaping the USA Diesel Generator Market, including growth catalysts, operational challenges, and emerging opportunities across production, distribution, and customer segments.
Growth Drivers
Data Center Power Density and Capacity Expansion
- Data centers represented 4.4% of U.S. electricity consumption (2023, United States), making uptime-sensitive digital infrastructure a major engineered-generator demand pool.
- Data center electricity use could reach 325-580 TWh by 2028 (United States), supporting multi-megawatt generator modules, redundancy, and nationwide field-service capacity.
- The projected share reaches 6.7%-12.0% of U.S. electricity use by 2028, increasing procurement value for controls, emissions systems, fuel infrastructure, and commissioning.
Grid Outages and Extreme-Weather Resilience
- Major events contributed almost 9 outage hours per customer (2024, United States), increasing the value of long-runtime diesel systems during storms, fires, and grid emergencies.
- Non-major interruptions added approximately 2 hours per customer (2024, United States), supporting routine standby investment beyond exceptional disaster years.
- Extended outages favor diesel because stored fuel can support multi-hour or multi-day runtime (critical facilities), while short-duration batteries remain constrained by energy capacity.
Construction, Industrial and Energy Activity
- Large construction pipelines generate demand for 75-375 kVA mobile systems (2025, United States), benefiting rental fleets, dealers, and independent power specialists.
- U.S. crude oil production reached approximately 13.6 million barrels per day in 2025, supporting remote and emergency power across upstream and midstream infrastructure.
- Manufacturing and critical infrastructure represented an estimated 51% of 2025 end-use revenue, supporting engineered equipment, service coverage, and replacement demand.
Market Challenges
Emissions Compliance and Permitted Runtime
- Tier requirements can add DOC, DPF, SCR and DEF systems (regulated U.S. engines), increasing acquisition cost, maintenance complexity, heat rejection, and installation footprint.
- Federal stationary-engine obligations interact with state and local air permits (United States), creating jurisdiction-specific engineering, testing, recordkeeping, and operating constraints.
- Compliance complexity disproportionately affects smaller suppliers because each project may require multiple engine, fuel and operating classifications, reducing quotation speed and margin visibility.
Battery Storage and Alternative Backup Competition
- Planned battery additions approached 18.2 GW for 2025, improving project familiarity, financing access, controls capability, and procurement confidence.
- Batteries compete most directly in seconds-to-hours backup applications, pressuring diesel suppliers to demonstrate extended-runtime, lifecycle, and fuel-security advantages.
- Natural-gas generators also challenge diesel in sites with pipeline access, shifting competition toward fuel resilience, emissions, start performance and permitting rather than equipment price alone.
Fuel Price and Supply Exposure
- U.S. retail diesel averaged approximately USD 3.66 per gallon in 2025, making runtime assumptions important for prime-power and continuous-duty economics.
- The United States consumed approximately 59.56 billion gallons of ultra-low-sulfur diesel in 2025, tying generator fuel access to a much larger transport-fuel system.
- Approximately 84% of U.S. ultra-low-sulfur diesel imports came from Canada, highlighting cross-border logistics exposure despite strong domestic refining output.
Market Opportunities
Hybrid Diesel-Battery Microgrids
- Hybrid systems can monetize generators, batteries, controls, switchgear, commissioning, and service within one integrated resilience project, increasing revenue per customer.
- OEMs, integrators, engineering firms, and critical-facility operators benefit as batteries handle short-duration transitions while diesel supports extended outages and black-start capability.
- Realization requires interoperable controls, standardized testing, bankable warranties, and optimized dispatch across multiple distributed-energy assets.
High-Capacity Data Center Systems and Service Contracts
- Suppliers can bundle generator modules, controls, testing, remote monitoring, maintenance, and parts under multi-year uptime agreements, improving recurring revenue and customer retention.
- OEMs with high-kVA portfolios, national dealers, and rapid field response benefit as campuses require N+1 or 2N redundancy architectures.
- Capacity expansion requires shorter lead times, transformer and switchgear coordination, emissions permitting, and standardized deployment across multiple data center regions.
Renewable Diesel-Compatible Replacement
- Manufacturers can monetize HVO-ready equipment, retrofit assessments, fuel-system reviews, controls calibration, and warranty-backed conversion across existing diesel infrastructure.
- Data centers, public agencies, healthcare systems, and corporations benefit where renewable diesel supports operational carbon targets without replacing standby architecture.
- Broader adoption requires dependable regional supply, transparent lifecycle accounting, OEM approvals, fuel-quality control, and competitive delivered pricing across critical operating locations.
CHAPTER 9 - Competitive Landscape
Competitive Landscape Overview
The market is moderately concentrated around diversified power-system OEMs, supported by specialist generator manufacturers, regional dealers, rental fleets, and integrators. Competition centers on high-kVA coverage, emissions compliance, lead times, nationwide service, digital monitoring, and lifecycle economics.
Market Share Distribution
Top 5 Players
Market Dynamics
8 new entrants in the past 5 years, indicating strong market attractiveness and growth potential.
Company Name | Market Share | Headquarters | Founding Year | Core Market Focus |
|---|---|---|---|---|
Caterpillar Inc. | - | Irving, Texas, United States | 1925 | Industrial and high-capacity diesel generator sets, controls, microgrids, and dealer-supported lifecycle services |
Cummins Inc. | - | Columbus, Indiana, United States | 1919 | Diesel engines, standby and prime generator sets, paralleling systems, controls, and distributed power solutions |
Generac Holdings Inc. | - | Waukesha, Wisconsin, United States | 1959 | Commercial and industrial standby systems, distributed energy technology, controls, and data center solutions |
Rehlko | - | Kohler, Wisconsin, United States | 1920 | Industrial generator sets, critical-power systems, controls, paralleling, and global service support |
Rolls-Royce Power Systems, mtu | - | Friedrichshafen, Germany | 1909 | High-capacity standby and continuous power systems for data centers, healthcare, infrastructure, and industrial sites |
Mitsubishi Heavy Industries Ltd. | - | Tokyo, Japan | 1884 | Large diesel generator systems, engines, distributed power packages, and critical infrastructure applications |
Atlas Copco AB | - | Nacka, Sweden | 1873 | Mobile diesel generators, construction power, hybrid systems, rental applications, and energy-storage integration |
HIMOINSA S.L. | - | San Javier, Spain | 1982 | Industrial diesel generator sets, telecom power, rental equipment, hybrid systems, and engineered projects |
Multiquip Inc. | - | Cypress, California, United States | 1973 | Portable and mobile diesel generators for construction, rental, emergency response, and commercial applications |
Wacker Neuson SE | - | Munich, Germany | 1848 | Portable jobsite generators, construction equipment, dealer distribution, and rental-focused power products |
Cross Comparison Parameters
The report provides detailed cross-comparison of key players across 10 performance parameters to identify competitive strengths and weaknesses.
High-kVA Product Coverage
U.S. Dealer and Service Footprint
Power Systems Revenue Growth
Operating Margin
Analysis Covered
Market Share Analysis:
Estimates revenue positioning across global, domestic, and specialist suppliers
Cross Comparison Matrix:
Benchmarks capacity, service reach, growth, and financial performance indicators
SWOT Analysis:
Evaluates portfolio strengths, channel gaps, risks, and expansion opportunities
Pricing Strategy Analysis:
Compares specification premiums, channel margins, and lifecycle contract structures
Company Profiles:
Reviews market participation, product focus, footprint, and strategic direction
CHAPTER 10 - REPORT TOC
CHAPTER 14 - Table Of Contents
Phase 1Market Assessment Phase
11
Chapters
Supply-side and competitive intelligence covering market sizing, segmentation, competitive dynamics, regulatory landscape, and future forecasts.
Phase 2Go-To-Market Strategy Phase
15
Chapters
Entry strategy evaluation, execution roadmap, partner recommendations, and profitability outlook.
Complete Report Coverage
201+ detailed sections covering every aspect of the market
143
Assessment Sections
58
Strategy Sections
CHAPTER 11 - Our Approach
Research Methodology
Desk Research
- Mapped diesel generator product portfolios
- Reviewed engine emissions regulations nationwide
- Analyzed data center power demand
- Benchmarked construction and industrial indicators
Primary Research
- Interviewed power systems product managers
- Consulted generator dealer business principals
- Engaged critical facility operations directors
- Surveyed industrial equipment procurement managers
Validation and Triangulation
- Validated findings across 350 respondents
- Reconciled shipment and pricing estimates
- Cross-checked channel revenue allocation assumptions
- Stress-tested high-capacity demand projections
CHAPTER 12 - FAQ
FAQs
Still have questions?
Our research team is here to help you find the right solution
CHAPTER 13 - Related Research
Explore Related Reports
Expand your market intelligence with complementary research across regions and adjacent markets.
Regional/Country ReportsRelated market analysis across key regions
Related market analysis across key regions
No regional reports found.
Adjacent ReportsRelated markets and complementary research
Related markets and complementary research
500+
Market Research Reports
50+
Countries Covered
15+
Industry Verticals