
USA Digital Signage Market Outlook to 2030
Region:North America
Author(s):Meenakshi
Product Code:KROD4978
October 2024
83
About the Report
USA Digital Signage Market Overview
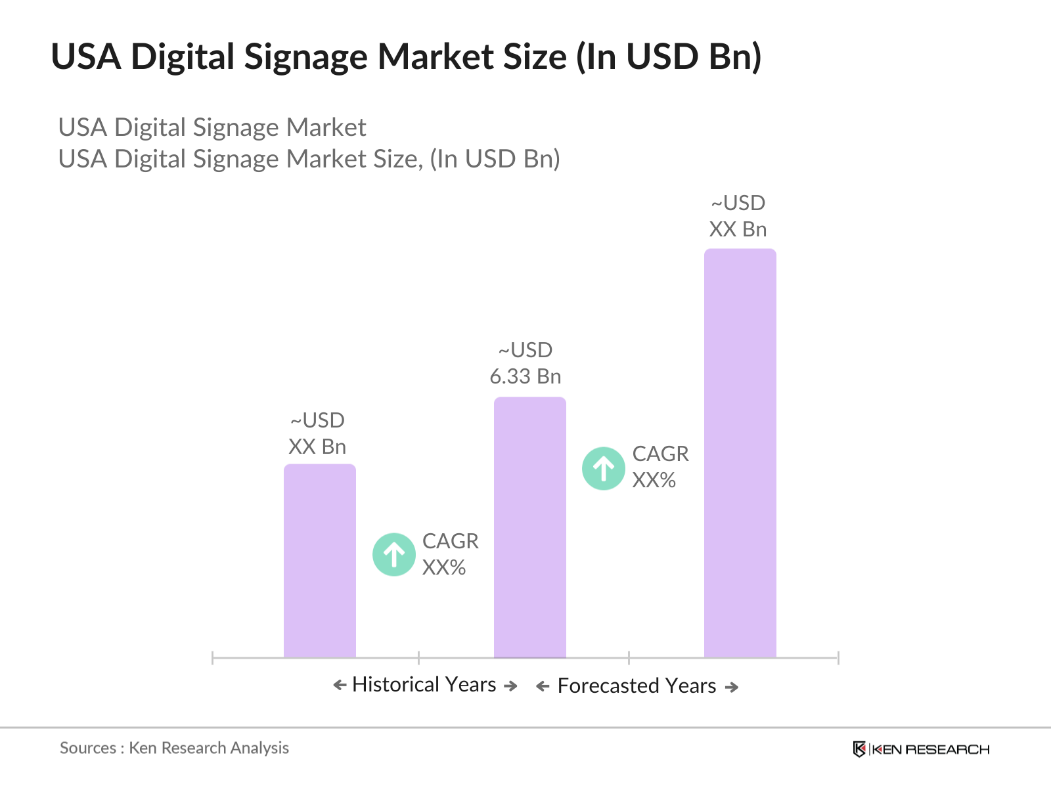
- The USA Digital Signage market is valued at USD 6.33 billion based on a five-year historical analysis. This growth is primarily driven by the increasing adoption of interactive displays and video walls across multiple sectors, such as retail, hospitality, and corporate environments. The rise in digital advertising, fueled by innovations in display technology, including the integration of 4K and 8K screens, has significantly boosted market growth
- The market is dominated by major cities such as New York, Los Angeles, and Chicago due to their advanced infrastructure and high consumer demand for digital advertising. These cities are key commercial hubs, hosting large retail chains, corporate offices, and entertainment venues that extensively use digital signage. The presence of tech giants and major advertising agencies further strengthens their dominance. In addition, these regions are at the forefront of adopting smart city technologies, further driving the demand for interactive and connected digital signage solutions.
- The FCC's new broadband map, launched in 2022, offers a more detailed view of broadband availability across the U.S. by mapping service at the level of individual structures rather than broad census blocks. This will guide the allocation of $42 billion in federal funds under the Broadband Equity, Access, and Deployment (BEAD) program. However, concerns remain about the accuracy and speed of improvements to the map, as missing locations could impact funding distribution.
USA Digital Signage Market Segmentation
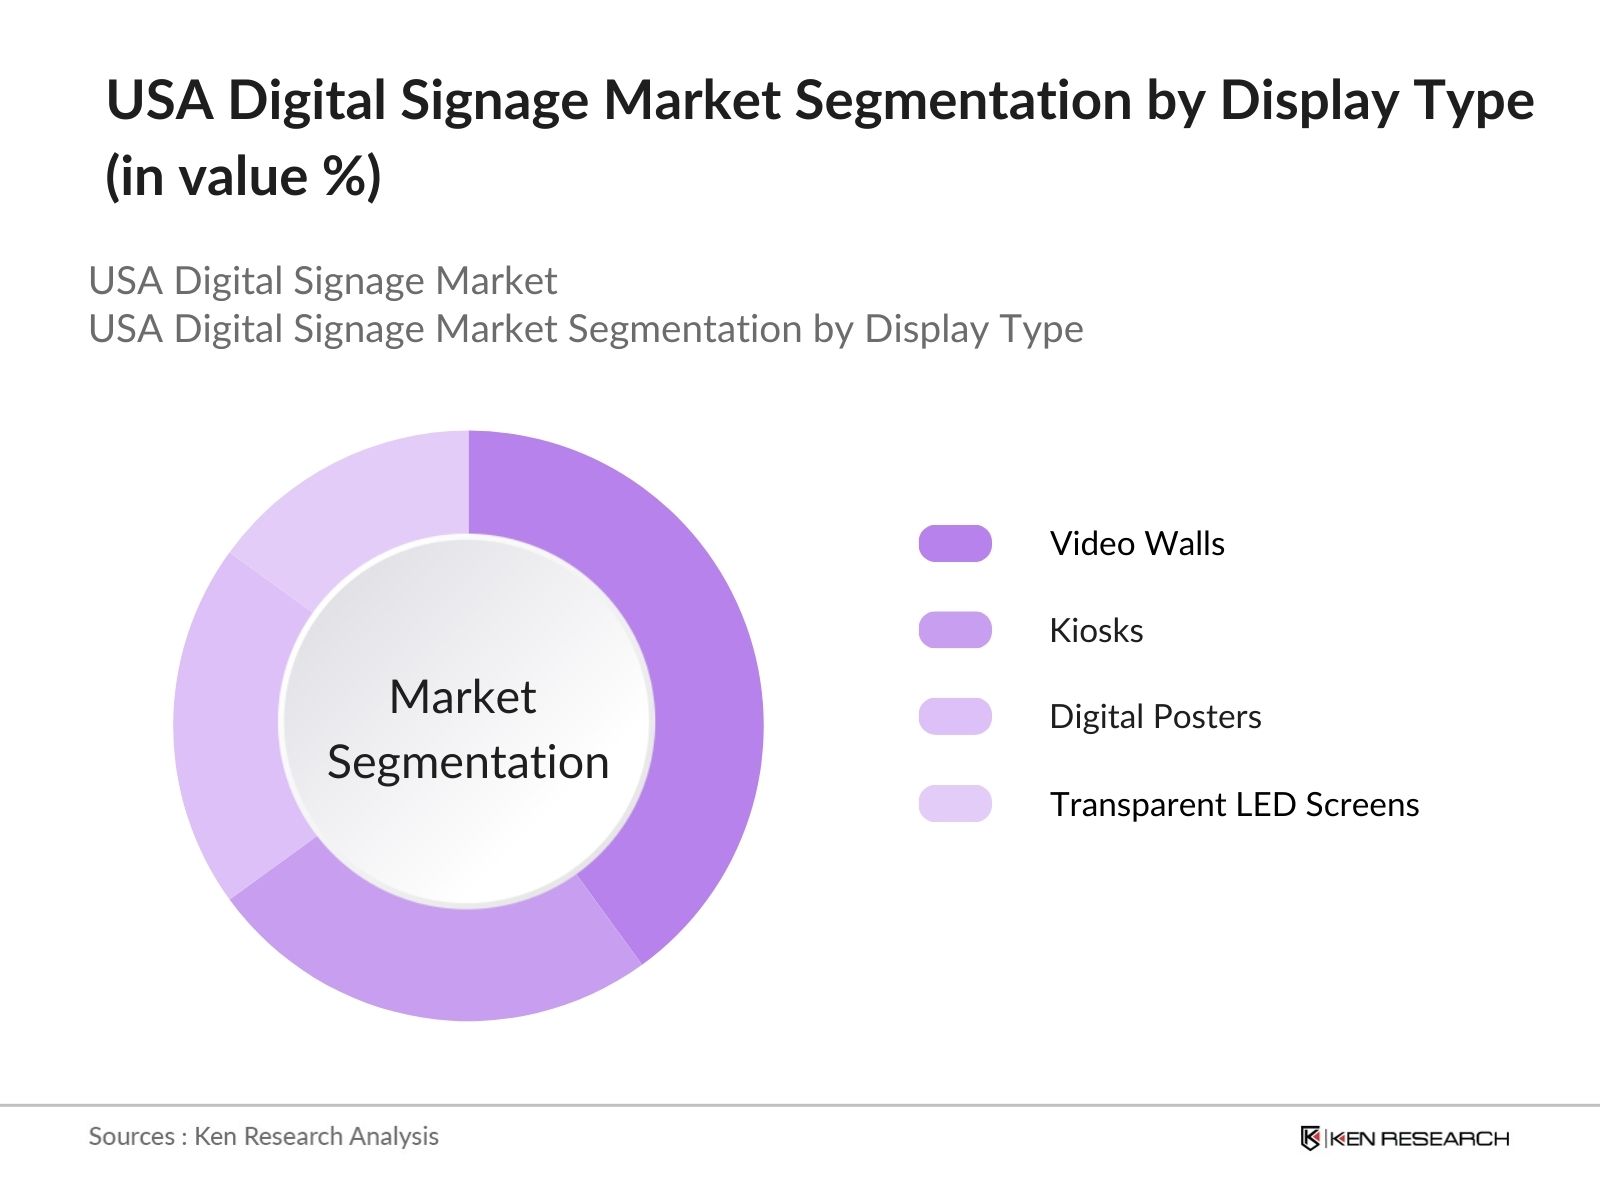
By Display Type: The USA Digital Signage market is segmented by display type into video walls, kiosks, digital posters, and transparent LED screens. Video walls currently hold the dominant market share within this segmentation due to their extensive use in large public spaces such as airports, malls, and stadiums. The ability of video walls to display high-definition visuals in large formats makes them an appealing choice for advertisers seeking to create impactful brand messaging. Furthermore, advancements in display resolution and flexibility in customization contribute to their popularity in various sectors.
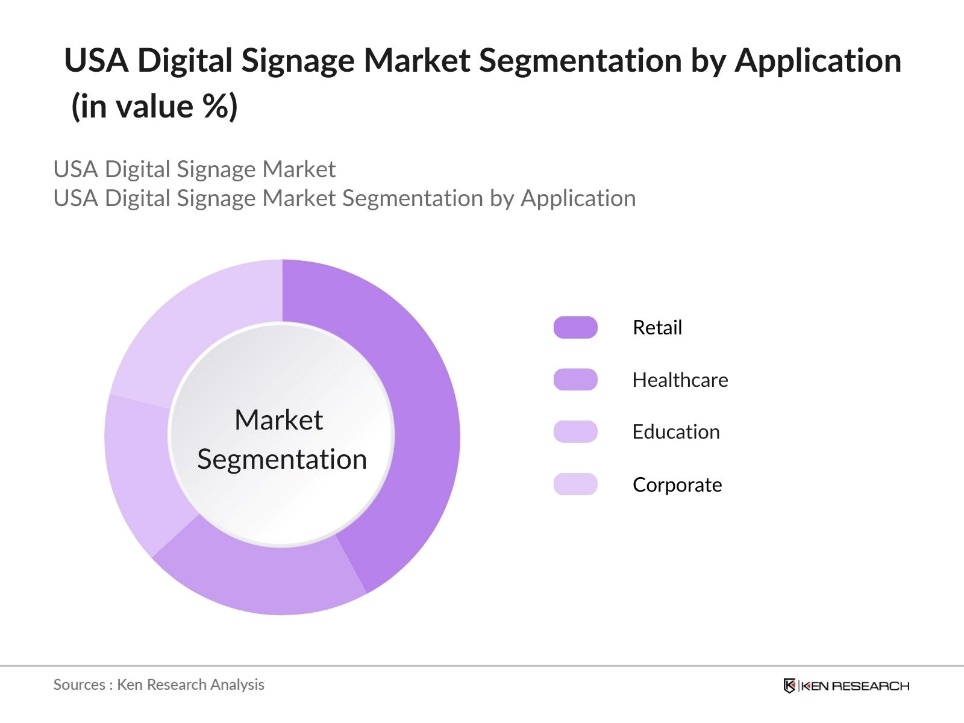
By Application: The USA Digital Signage market is segmented by application segment, the market is categorized into retail, healthcare, education, and corporate environments. Retail is currently the leading application, dominating the market due to the growing demand for digital advertising solutions within physical stores. Retailers use digital signage to enhance customer experience, promote offers, and showcase new products. The integration of touchscreen displays for interactive shopping, combined with proximity sensors and data analytics, has made digital signage indispensable for modern retail strategies, further solidifying its dominance in this segment.
USA Digital Signage Market Competitive Landscape
The market is dominated by several key players, each with unique strengths in technological innovation and market presence. The market is highly competitive, with companies investing heavily in research and development to integrate new technologies such as AI, IoT, and cloud-based content management systems. The competitive environment encourages continuous product innovation, ensuring that businesses can cater to evolving consumer preferences and technological advancements.
|
Company |
Establishment Year |
Headquarters |
Revenue (2023) |
Employees |
Product Offerings |
Technology Innovations |
Customer Base |
R&D Investment |
|
Samsung Electronics Co. |
1969 |
South Korea |
||||||
|
NEC Display Solutions |
1980 |
Japan |
||||||
|
LG Electronics |
1958 |
South Korea |
||||||
|
Cisco Systems Inc. |
1984 |
USA |
||||||
|
BrightSign LLC |
2002 |
USA |
USA Digital Signage Industry Analysis
Growth Drivers
- Adoption of 4K and 8K Display Technology: In 2024, the adoption of advanced display technologies such as 4K and 8K is accelerating within the USA digital signage market, driven by the demand for higher resolution in commercial applications. As of 2024, over 50% of U.S. households have adopted 4K TVs, with projections for 8K adoption increasing due to consumer preferences for larger screens (75 inches and up), indicating a surge in the need for high-quality display systems. Enhanced visual clarity offered by 4K and 8K technology supports applications in industries such as retail, healthcare, and education.
- Increasing Penetration of Digital Out-of-Home (DOOH) Advertising: As of 2024, Digital Out-of-Home (DOOH) market for 2024 is the rise of programmatic advertising. It allows advertisers to purchase ad placements instantly using real-time data, improving efficiency and personalization. Around 28% of U.S. advertisers exclusively use programmatic DOOH, and an additional 32% combine it with manual buying. The agility of programmatic advertising ensures that campaigns can adapt instantly, leading to improved cost-efficiency and impactful ads. This trend continues to reshape the DOOH landscape.
- Expansion in Retail and Hospitality Sectors: The U.S. retail and hospitality sectors are increasingly adopting digital signage to improve customer experiences. Retailers use digital signage for dynamic in-store advertising and personalized content, while the hospitality industry employs it for wayfinding, check-in processes, and guest services. These sectors are enhancing real-time communication and personalization through digital displays, driven by technological advancements and consumer demand.
Market Challenges
- High Initial Installation Costs: Despite the growing adoption of digital signage, the high installation costs remain a challenge for many businesses. These expenses often include hardware, software, and network setup, making it difficult for smaller enterprises to justify the investment. Although financial assistance options like loans exist, many businesses still struggle to afford the high upfront costs required for installation and implementation, which can limit the markets overall growth and accessibility.
- Technological Obsolescence: Frequent technological advancements in display resolution, processing power, and connectivity lead to the rapid obsolescence of digital signage systems. Businesses often face the need to reinvest in newer technologies to stay competitive, as the lifecycle of digital signage technology can be short. This ongoing challenge requires companies to balance the benefits of cutting-edge displays with the costs and logistics of frequent upgrades.
USA Digital Signage Market Future Outlook
Over the next five years, the USA Digital Signage market is expected to experience robust growth, driven by continued technological advancements and rising demand for interactive and immersive advertising solutions. The adoption of AI-powered content personalization, combined with the expansion of smart cities and connected environments, will further propel the market. Additionally, the integration of cloud-based content management solutions will reduce operational costs, making digital signage more accessible to a broader range of businesses.
Market Opportunities
- Integration of Artificial Intelligence and Machine Learning: Artificial intelligence (AI) and machine learning offer significant opportunities in the U.S. digital signage market. These technologies enable personalized content delivery, facial recognition, and advanced data analytics, allowing businesses to engage customers in real-time. AI-driven solutions are transforming digital signage by adapting content based on audience behavior, enhancing interaction, and driving innovation across sectors. As AI continues to advance, businesses are increasingly adopting these technologies to improve customer engagement and operational efficiency.
- Growth in Smart Cities and Smart Buildings: The development of smart cities and buildings is driving the adoption of digital signage solutions in public infrastructure. Digital signage plays a crucial role in managing real-time communication, traffic flow, and environmental monitoring in urban areas. This trend provides a major growth opportunity for digital signage in various sectors, as smart cities integrate these technologies to enhance public services and streamline information dissemination in modern urban planning and construction projects.
Scope of the Report
|
Display Type |
Video Walls Kiosks Digital Posters Transparent LED Screens |
|
Component |
Hardware Software Services |
|
Application |
Retail Healthcare Education Corporate |
|
Technology |
LCD LED Projection OLED |
|
Region |
Northeast Midwest West South |
Products
Key Target Audience
Event Management Companies
Display Hardware Manufacturers
Media and Entertainment Companies
Event Management Companies
Government and Regulatory Bodies (FCC, CCPA Compliance Bodies)
Investment and Venture Capitalist Firms
Companies
Major Players
Samsung Electronics Co. Ltd.
NEC Display Solutions
LG Electronics
Sony Corporation
Panasonic Corporation
Cisco Systems Inc.
Sharp Corporation
Planar Systems
Leyard Optoelectronic Co.
Intel Corporation
BrightSign LLC
Stratacache
Scala Inc.
Four Winds Interactive
Mvix
Table of Contents
1. USA Digital Signage Market Overview
1.1. Definition and Scope
1.2. Market Taxonomy
1.3. Market Growth Rate
1.4. Market Segmentation Overview
2. USA Digital Signage Market Size (In USD Bn)
2.1. Historical Market Size
2.2. Year-on-Year Growth Analysis
2.3. Key Market Developments and Milestones
3. USA Digital Signage Market Analysis
3.1. Growth Drivers
3.1.1. Adoption of 4K and 8K Display Technology
3.1.2. Increasing Demand for Interactive Displays
3.1.3. Expansion in Retail and Hospitality Sectors
3.1.4. Increasing Penetration of Digital Out-of-Home (DOOH) Advertising
3.2. Market Challenges
3.2.1. High Initial Installation Costs
3.2.2. Technological Obsolescence
3.2.3. Bandwidth and Connectivity Issues
3.3. Opportunities
3.3.1. Integration of Artificial Intelligence and Machine Learning
3.3.2. Growth in Smart Cities and Smart Buildings
3.3.3. Partnerships with Content Providers and Ad Networks
3.4. Trends
3.4.1. Rise of Cloud-Based Digital Signage Solutions
3.4.2. Increasing Use of Touchscreen and Interactive Displays
3.4.3. Integration with Internet of Things (IoT)
3.5. Government Regulation
3.5.1. Federal Advertising Guidelines
3.5.2. Energy Efficiency Standards for Display Technologies
3.5.3. Data Privacy Regulations (GDPR, CCPA)
3.5.4. Zoning and Permitting Regulations for Outdoor Signage
3.6. SWOT Analysis
3.7. Stakeholder Ecosystem
3.8. Porters Five Forces Analysis
3.9. Competition Ecosystem
4. USA Digital Signage Market Segmentation
4.1. By Display Type (In Value %)
4.1.1. Video Walls
4.1.2. Kiosks
4.1.3. Digital Posters
4.1.4. Transparent LED Screens
4.2. By Component (In Value %)
4.2.1. Hardware (Displays, Media Players)
4.2.2. Software (Content Management, Cloud Solutions)
4.2.3. Services (Installation, Maintenance)
4.3. By Application (In Value %)
4.3.1. Retail
4.3.2. Healthcare
4.3.3. Education
4.3.4. Corporate
4.4. By Technology (In Value %)
4.4.1. LCD
4.4.2. LED
4.4.3. Projection
4.4.4. OLED
4.5. By Region (In Value %)
4.5.1. Northeast
4.5.2. Midwest
4.5.3. West
4.5.4. South
5. USA Digital Signage Market Competitive Analysis
5.1. Detailed Profiles of Major Companies
5.1.1. Samsung Electronics Co. Ltd.
5.1.2. NEC Display Solutions
5.1.3. LG Electronics
5.1.4. Sony Corporation
5.1.5. Panasonic Corporation
5.1.6. Cisco Systems Inc.
5.1.7. Sharp Corporation
5.1.8. Planar Systems
5.1.9. Leyard Optoelectronic Co.
5.1.10. Intel Corporation
5.1.11. BrightSign LLC
5.1.12. Stratacache
5.1.13. Scala Inc.
5.1.14. Four Winds Interactive
5.1.15. Mvix
5.2. Cross Comparison Parameters (Revenue, Headquarters, Inception Year, Market Presence, Product Portfolio, Technological Innovation, R&D Spending, Customer Base)
5.3. Market Share Analysis
5.4. Strategic Initiatives
5.5. Mergers and Acquisitions
5.6. Investment Analysis
5.7. Venture Capital Funding
5.8. Government Grants
5.9. Private Equity Investments
6. USA Digital Signage Market Regulatory Framework
6.1. Environmental Standards for Digital Displays
6.2. Compliance with Energy Efficiency Certifications
6.3. Certification Processes (UL, CE, FCC)
7. USA Digital Signage Future Market Size (In USD Bn)
7.1. Future Market Size Projections
7.2. Key Factors Driving Future Market Growth
8. USA Digital Signage Future Market Segmentation
8.1. By Display Type (In Value %)
8.2. By Component (In Value %)
8.3. By Application (In Value %)
8.4. By Technology (In Value %)
8.5. By Region (In Value %)
9. USA Digital Signage Market Analysts Recommendations
9.1. TAM/SAM/SOM Analysis
9.2. Customer Cohort Analysis
9.3. Marketing Initiatives
9.4. White Space Opportunity Analysis
Disclaimer
Contact Us
Research Methodology
Step 1: Identification of Key Variables
The initial phase involves constructing an ecosystem map for the USA Digital Signage market. We conducted extensive desk research, using secondary sources such as industry reports and proprietary databases, to identify key variables influencing market dynamics. These variables include technological advancements, regional market adoption, and regulatory frameworks.
Step 2: Market Analysis and Construction
In this phase, we analyzed historical market data for digital signage in the USA. We assessed factors such as display type penetration, revenue generation by application, and the number of service providers. This data formed the foundation for market growth projections and future segment developments.
Step 3: Hypothesis Validation and Expert Consultation
Market hypotheses were developed through interviews with industry experts, including digital signage manufacturers, advertising agencies, and technology providers. These consultations provided operational and financial insights, further validating the data collected in earlier phases.
Step 4: Research Synthesis and Final Output
The final stage involved synthesizing research data and insights into a comprehensive report. Engagements with display manufacturers and media companies helped verify revenue estimates and market segmentation accuracy, ensuring the analysis aligns with current market trends.
Frequently Asked Questions
01 How big is the USA Digital Signage Market?
The USA Digital Signage Market is valued at USD 6.33 billion, driven by the increasing adoption of interactive displays and digital advertising solutions across retail and corporate sectors.
02 What are the challenges in the USA Digital Signage Market?
Challenges in USA Digital Signage market include high installation costs, technological obsolescence, and connectivity issues. The rapid pace of technology innovation also poses a challenge for companies trying to keep their systems updated.
03 Who are the major players in the USA Digital Signage Market?
Key players in USA Digital Signage market include Samsung Electronics, NEC Display Solutions, LG Electronics, Cisco Systems, and BrightSign. These companies dominate due to their technological innovations, extensive product offerings, and global reach.
04 What are the growth drivers of the USA Digital Signage Market?
The USA Digital Signage market is driven by the increasing demand for high-definition video walls and interactive displays, as well as the growing integration of AI and IoT technologies into digital signage solutions.
Why Buy From Us?
 Framework")
What makes us stand out is that our consultants follows Robust, Refine and Result (RRR) methodology. i.e. Robust for clear definitions, approaches and sanity checking, Refine for differentiating respondents facts and opinions and Result for presenting data with story

We have set a benchmark in the industry by offering our clients with syndicated and customized market research reports featuring coverage of entire market as well as meticulous research and analyst insights.

While we don't replace traditional research, we flip the method upside down. Our dual approach of Top Bottom & Bottom Top ensures quality deliverable by not just verifying company fundamentals but also looking at the sector and macroeconomic factors.

With one step in the future, our research team constantly tries to show you the bigger picture. We help with some of the tough questions you may encounter along the way: How is the industry positioned? Best marketing channel? KPI's of competitors? By aligning every element, we help maximize success.

Our report gives you instant access to the answers and sources that other companies might choose to hide. We elaborate each steps of research methodology we have used and showcase you the sample size to earn your trust.

If you need any support, we are here! We pride ourselves on universe strength, data quality, and quick, friendly, and professional service.