


USA Engineering Plastics Market Outlook to 2030
Region:North America
Author(s):Shubham Kashyap
Product Code:KROD3431
November 2024
93
About the Report
USA Engineering Plastics Market Overview
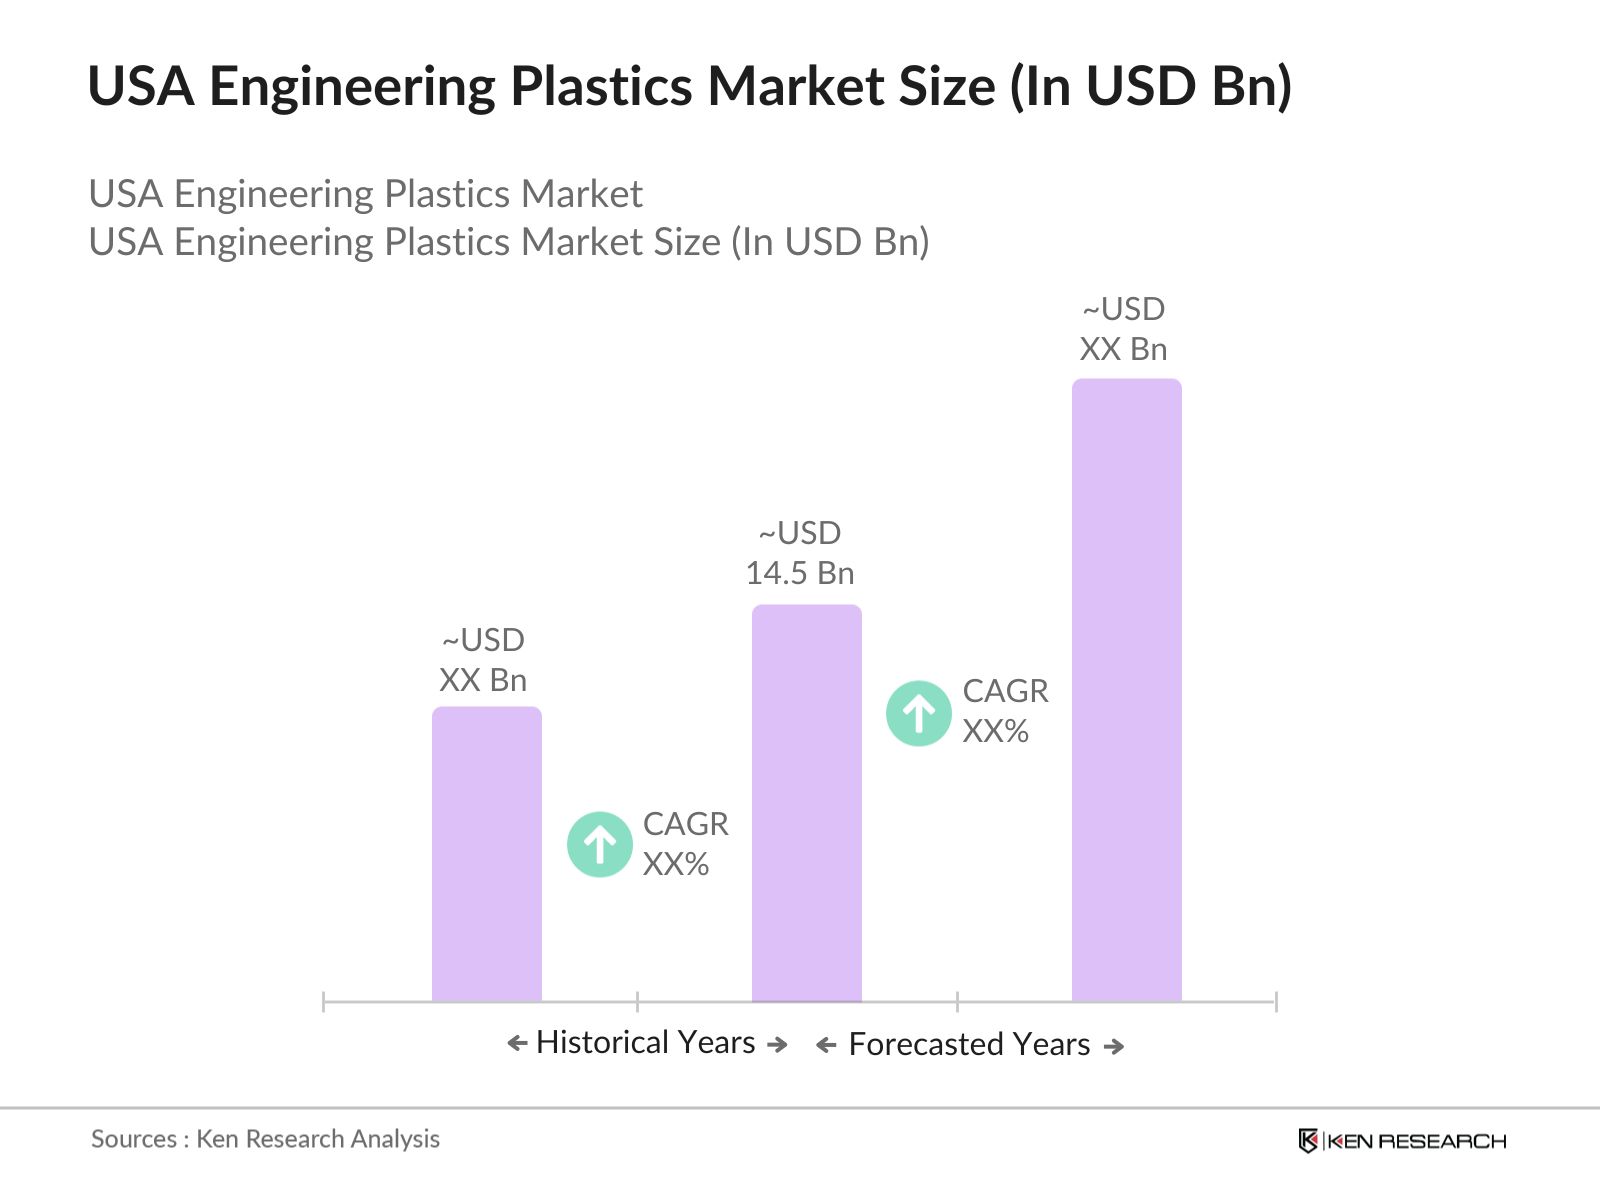
- The USA engineering plastics market is a crucial sector, valued at USD 14.5 billion, driven by high demand across automotive, electrical, electronics, and industrial applications. Engineering plastics such as polycarbonates, polyamides, and ABS (Acrylonitrile Butadiene Styrene) offer enhanced mechanical and thermal properties, making them a preferred choice over traditional materials like metals and ceramics in various high-performance industries. The market is further propelled by advancements in material technologies, improving durability and functionality in end-use applications.
- Key metropolitan regions such as Detroit, Chicago, and Houston lead in consumption due to their established automotive and manufacturing sectors. The growing demand for lightweight materials in the automotive industry, aimed at improving fuel efficiency and reducing emissions, is significantly contributing to the markets expansion. Similarly, the electronics sector is boosting demand due to the rising production of high-performance devices and components that require engineering plastics for improved performance and reliability.
- The U.S. Environmental Protection Agency (EPA) plays a pivotal role in regulating the usage of plastics, focusing on environmental sustainability. Regulatory efforts, including limitations on hazardous chemicals like BPA (Bisphenol A) in certain engineering plastics, aim to ensure the safe usage of these materials. Recycling initiatives and sustainability regulations are also influencing the market, as manufacturers seek to balance performance with eco-friendly practices.
USA Engineering Plastics Market Segmentation
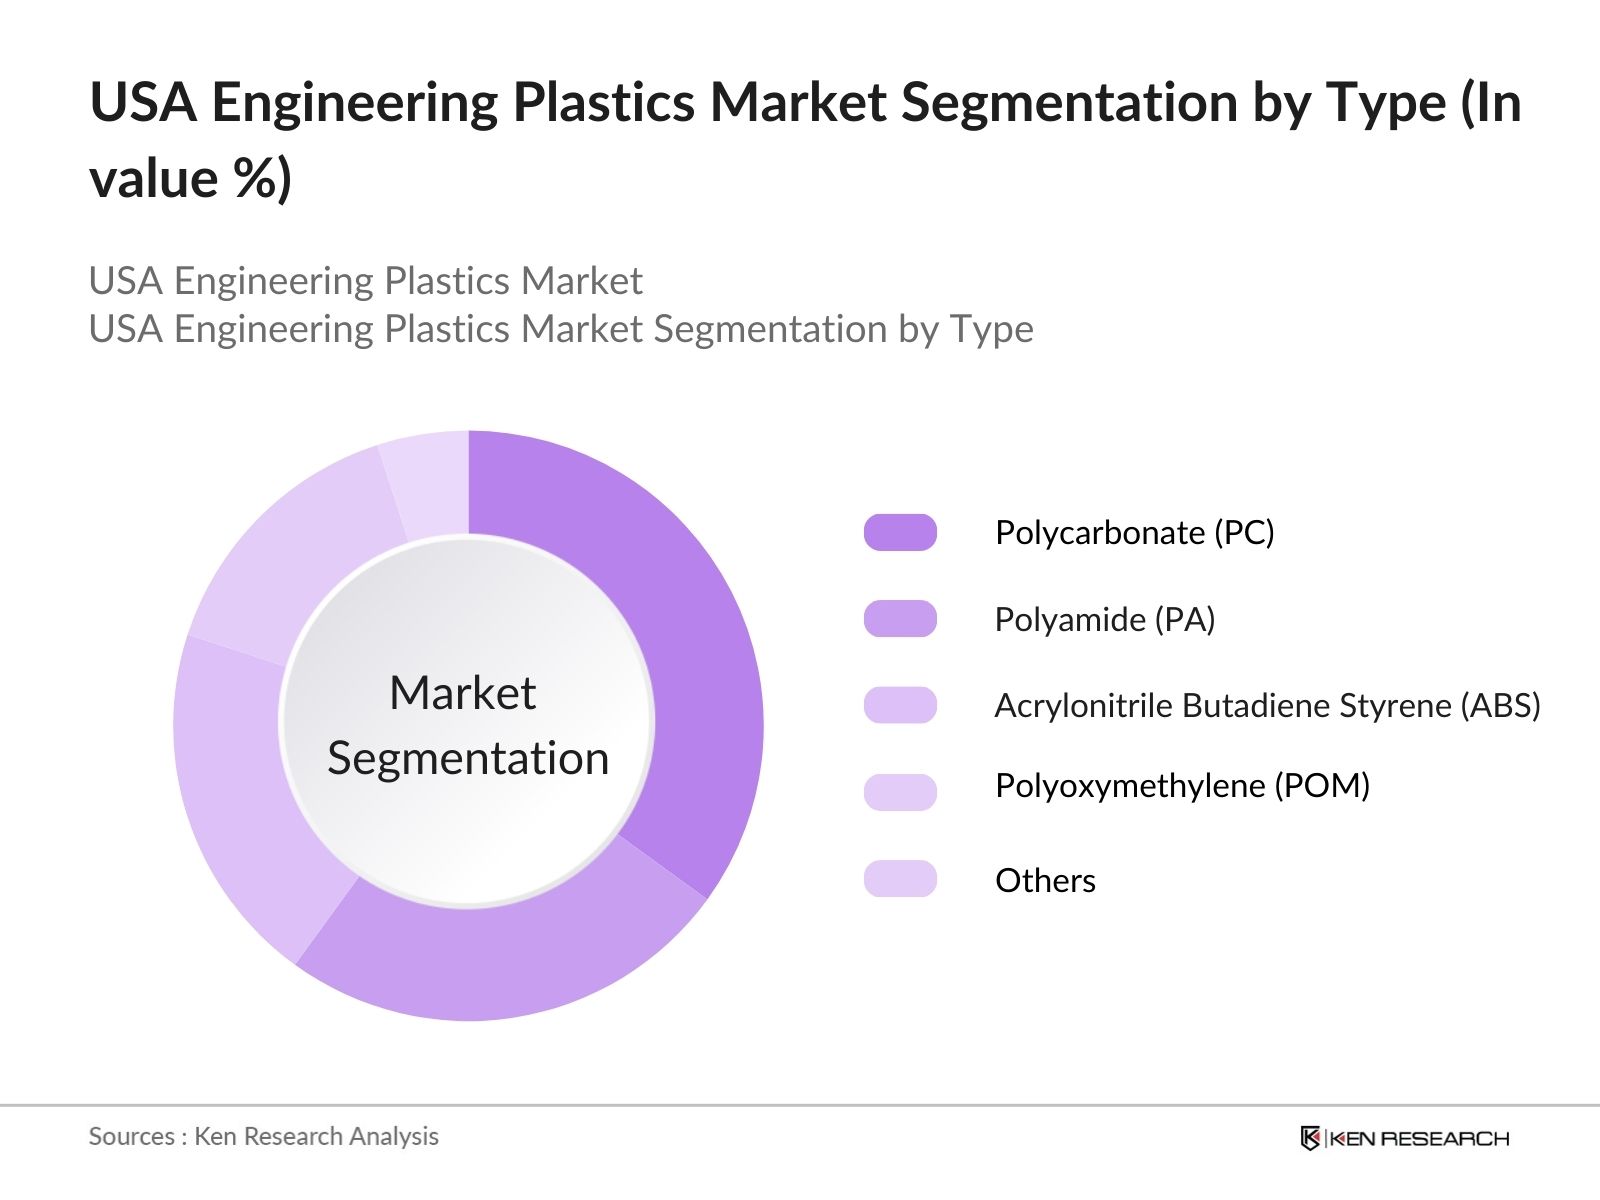
- By Type of Plastic: The market is segmented into polycarbonate (PC), polyamide (PA), acrylonitrile butadiene styrene (ABS), polyoxymethylene (POM), and others. Polycarbonate holds a dominant position due to its superior impact resistance, optical clarity, and electrical insulation properties, making it ideal for applications in automotive headlamps, electronic displays, and protective gear. ABS follows closely, favored for its toughness and ease of processing, commonly used in consumer electronics and automotive interiors. Polyamide (Nylon) is extensively used in automotive parts and electrical insulation due to its excellent wear resistance and mechanical strength.
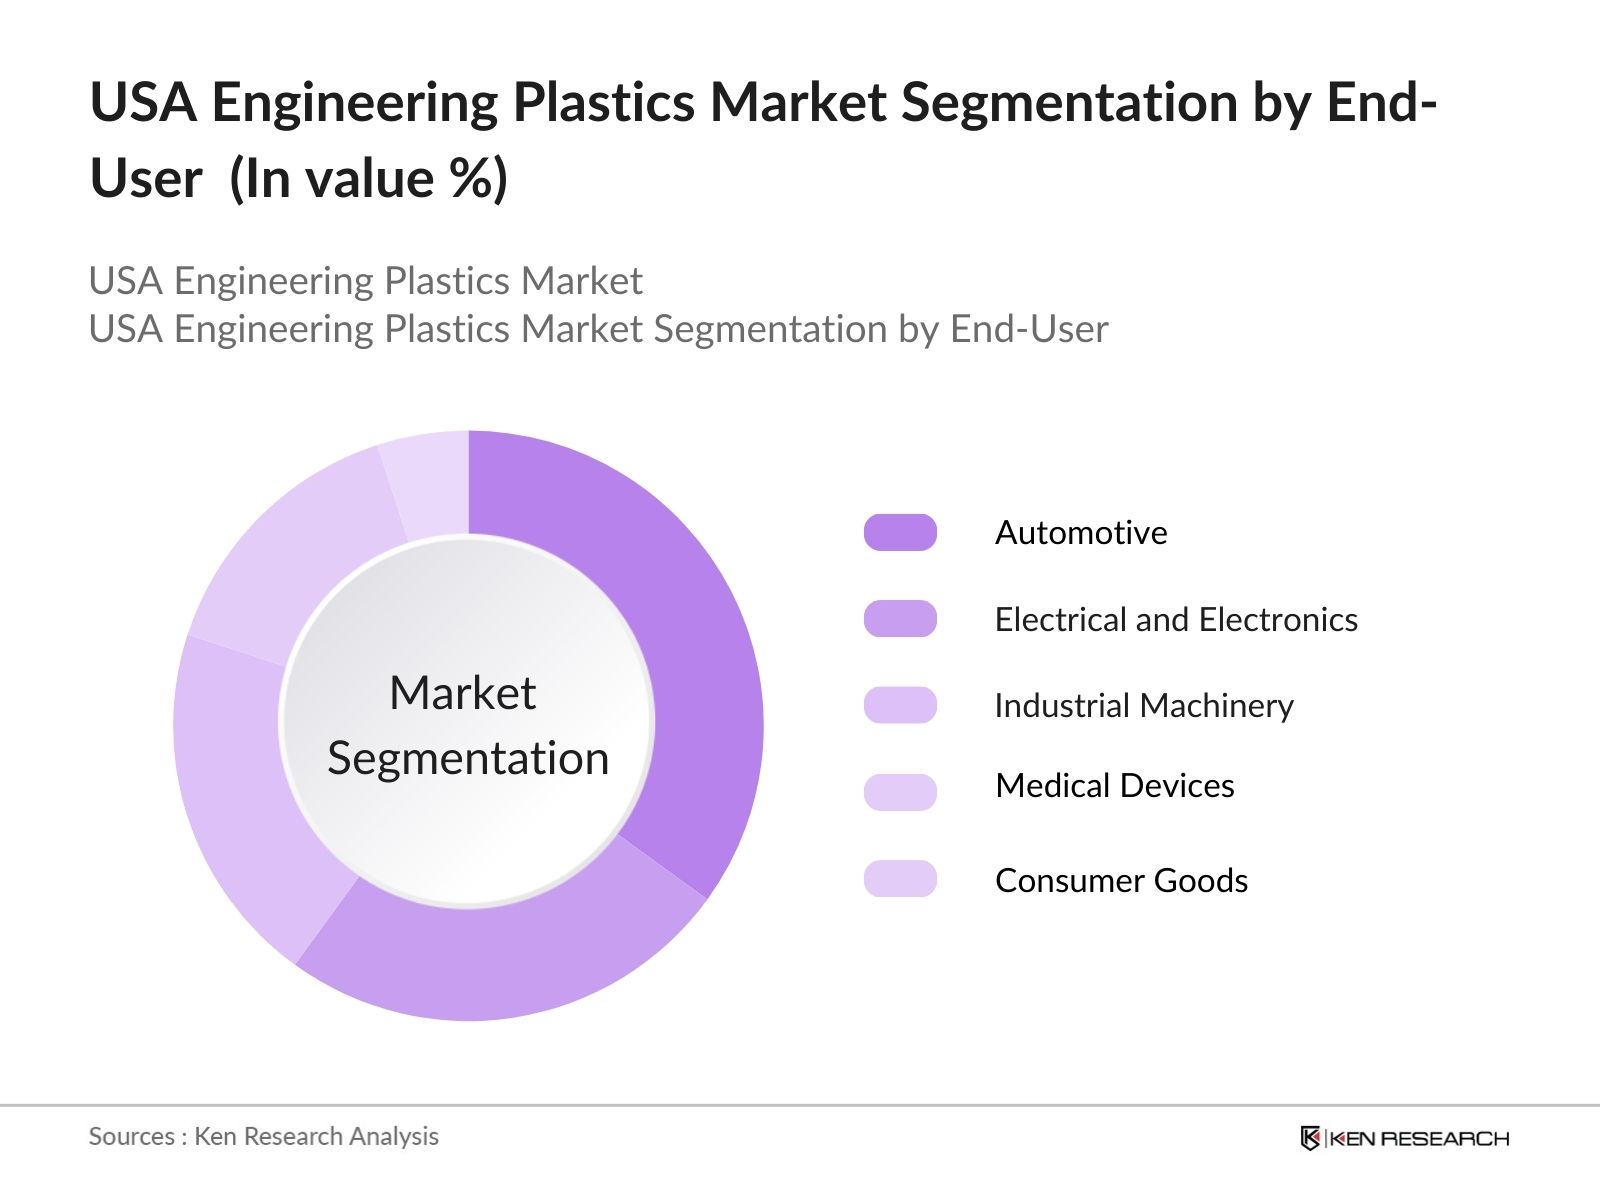
- By End-User: The market is segmented by industry into automotive, electrical and electronics, industrial machinery, medical devices and consumer goods. The automotive industry is the largest consumer of engineering plastics, driven by the push for lightweight materials that enhance fuel efficiency and reduce emissions. Electrical and electronics industries account for a significant share, utilizing engineering plastics for insulating components, connectors, and circuit boards. The industrial machinery sector also demands high-performance materials for manufacturing durable and resilient machinery components.
USA Engineering Plastics Market Competitive Landscape
The USA engineering plastics market is highly competitive, with numerous domestic and international players vying for market share. Major companies like BASF, DuPont, Sabic, and Covestro dominate the market, focusing on product innovation, sustainability initiatives, and expanding production capacities to meet growing demand.
|
Company Name |
Establishment Year |
Headquarters |
No. of Employees |
Revenue (USD Billion) |
Key Products |
Sustainability Initiatives |
Technology Investments |
|
BASF |
1865 |
Florham Park, NJ |
|||||
|
DuPont |
1802 |
Wilmington, DE |
|||||
|
Covestro |
2015 |
Pittsburgh, PA |
|||||
|
SABIC |
1976 |
Houston, TX |
|||||
|
Solvay |
1863 |
Alpharetta, GA |
USA Engineering Plastics Industry Analysis
Growth Drivers
- Increasing Demand in Automotive Industry: The U.S. automotive industry is a key driver of the engineering plastics market. The shift towards electric vehicles (EVs) and lightweight designs to improve energy efficiency has led to an increase in the demand for engineering plastics. These materials are crucial for reducing vehicle weight while maintaining structural integrity. The use of polyamide in engine components and polycarbonate in headlight assemblies has become widespread. In 2023, the U.S. produced 15.6 million light vehicles, a significant portion of which incorporate engineering plastics in various components.
- Expansion in Electronics and Electrical Sectors: The electronics sector's growth, especially in areas like smartphones, tablets, and high-performance computers, has fueled demand for engineering plastics that offer high strength, heat resistance, and electrical insulation. Polycarbonate is widely used in the production of casings for consumer electronics, while ABS is utilized in internal structural components due to its toughness and ease of molding. In 2023, the U.S. electronics market witnessed remarkable growth, with a significant portion dedicated to components made from engineering plastics.
- Sustainability Initiatives in Bio-Based Engineering Plastics, and Circular Economy: The U.S. government, under its 2024 Green Economy Initiative, promotes bio-based engineering plastics as part of its sustainability strategy. Bio-based alternatives like polylactic acid (PLA) and polyhydroxyalkanoates (PHA) are gaining momentum, especially in packaging and consumer goods, supporting the circular economy. In 2023, bio-based plastic production reached 2.18 million metric tons, driven by federal funding exceeding USD 100 million to boost bioplastics research. These sustainability efforts target a reduction in petrochemical dependency, with an emphasis on increasing bio-based materials across various sectors, contributing to a greener economy.
Market Challenges
- Raw Material Price Volatility: In 2024, raw material price volatility continues to impact the engineering plastics market, particularly due to fluctuations in petrochemical prices. The cost of petroleum-based feedstocks, such as polypropylene and polyethylene, remains unpredictable, affecting the overall production costs of engineering plastics. This volatility creates challenges for manufacturers, who must adapt to fluctuating prices, making long-term pricing strategies uncertain. Industries that rely heavily on stable plastic prices find it difficult to maintain consistent production margins, which adds complexity to operational planning and budgeting in the engineering plastics sector.
- Environmental Regulations and Sustainability Requirements: Engineering plastics face scrutiny due to their petrochemical origin, with increasing pressure from regulatory bodies to reduce their environmental footprint. Regulations such as the European Unions REACH (Registration, Evaluation, Authorization, and Restriction of Chemicals) and the U.S. EPAs restrictions on certain hazardous substances, including BPA, are compelling manufacturers to adopt greener alternatives. Complying with these regulations while maintaining product performance remains a significant challenge for the industry.
USA Engineering Plastics Market Future Outlook
The USA engineering plastics market is poised for steady growth through 2028, driven by the automotive sectors transition to electric vehicles, advancements in electronics, and increasing emphasis on sustainability. Manufacturers are expected to invest heavily in research and development to create materials that meet stringent environmental standards without compromising performance. The market is also likely to witness an increase in recycling initiatives, with companies striving to create a circular economy for engineering plastics.
Future Market Opportunities
- Recycling Technologies in Chemical and Mechanical Recycling: The U.S. is heavily investing in advanced recycling technologies to manage plastic waste, with engineering plastics being a key focus. In 2024, a substantial amount has been allocated for enhancing chemical and mechanical recycling methods. These technologies can convert engineering plastics back into reusable raw materials, helping industries meet sustainability targets. The advancement in recycling techniques not only reduces landfill waste but also lowers the dependency on virgin plastics, presenting a lucrative opportunity for manufacturers to invest in greener processes while meeting regulatory recycling mandates.
- Expansion in Aerospace: Engineering plastics, particularly high-performance polymers like polyether ether ketone (PEEK) and polyimides, are increasingly utilized in aerospace applications. These materials offer superior resistance to heat and chemical exposure, essential for aircraft components. In 2024, the U.S. aerospace sector is projected to spend billions on new materials and components, with engineering plastics playing a vital role in lightweighting efforts and enhancing fuel efficiency. This trend opens up considerable opportunities for engineering plastics manufacturers to expand their market share in high-performance aviation applications.
Scope of the Report
|
By Plastic |
Polycarbonates (PC) Polyamides (PA) Acrylonitrile Butadiene Styrene (ABS) Polyoxymethylene (POM) Others |
|
By End-User |
Automotive Electrical and Electronics Industrial Machinery Medical Devices Consumer Goods |
|
By Technology |
Injection Molding Extrusion Blow Molding 3D Printing |
|
By Application |
Structural Components Electrical Insulation Medical Equipment Packaging |
|
By Region |
North West East South |
Products
Key Target Audience
Automotive manufacturers
Electrical and electronics companies
Industrial machinery producers
Medical device manufacturers
Investors and venture capitalist firms
Government and regulatory bodies (U.S. Environmental Protection Agency - EPA)
Consumer goods manufacturers
Renewable energy sector
Banks and Financial Institutions
Companies
Players Mentioned in the Report
BASF
DuPont
Covestro
SABIC
Solvay
Eastman Chemical Company
LyondellBasell
Lanxess
Teijin Limited
Mitsubishi Chemical Holdings
Arkema
Evonik Industries
Celanese Corporation
Asahi Kasei
LG Chem
Table of Contents
1. USA Engineering Plastics Market Overview
1.1. Definition and Scope
1.2. Market Taxonomy
1.3. Industry Growth Rate (Current Demand for Engineering Plastics in Key Industries)
1.4. Market Segmentation Overview (Market Sectors Utilizing Engineering Plastics)
2. USA Engineering Plastics Market Size (In USD Billion)
2.1. Historical Market Size
2.2. Year-On-Year Growth Analysis (Growth in Automotive, Electronics, and Industrial Applications)
2.3. Key Market Developments and Milestones (Technological Advancements, New Applications)
3. USA Engineering Plastics Market Analysis
3.1. Growth Drivers
3.1.1. Increasing Demand in Automotive Industry (Lightweight Components, EV Applications)
3.1.2. Expansion in Electronics and Electrical Sectors (High-Performance Devices, Consumer Electronics)
3.1.3. Sustainability Initiatives (Bio-Based Engineering Plastics, Circular Economy)
3.1.4. Industrial Machinery and Equipment (Durable and Wear-Resistant Materials)
3.2. Market Challenges
3.2.1. Raw Material Price Volatility (Impact of Petrochemical Prices)
3.2.2. Compliance with Environmental Regulations (EPA, BPA-Free Plastics, Recycling)
3.2.3. Competition with Traditional Materials (Metals and Ceramics)
3.2.4. Limited Availability of Skilled Workforce (Engineering Expertise)
3.3. Opportunities
3.3.1. Recycling Technologies (Chemical and Mechanical Recycling)
3.3.2. Expansion in Aerospace Applications (High-Performance Polymers for Aircraft Components)
3.3.3. Integration in Medical Devices (Biocompatibility and High-Strength Plastics)
3.3.4. Opportunities in 3D Printing (Use of Engineering Plastics in Additive Manufacturing)
3.4. Trends
3.4.1. Development of High-Performance Plastics (Enhanced Thermal and Chemical Resistance)
3.4.2. Increasing Usage in Renewable Energy (Solar Panel Components, Wind Turbines)
3.4.3. Lightweighting Initiatives (Reducing Weight in Automotive and Aerospace)
3.4.4. Investment in Sustainable Plastic Solutions (Bio-Plastics, Carbon-Neutral Materials)
3.5. Government Regulations
3.5.1. U.S. Environmental Protection Agency (EPA) Regulations on Plastics
3.5.2. Restriction on Hazardous Substances (BPA, Phthalates)
3.5.3. Plastic Recycling Legislation (Policies Supporting Circular Economy)
3.5.4. Industry Standards for Engineering Plastics (ISO, ASTM)
3.6. SWOT Analysis
3.7. Stakeholder Ecosystem (Suppliers, Manufacturers, OEMs, End-Users)
3.8. Porters Five Forces Analysis
3.9. Competitive Landscape
4. USA Engineering Plastics Market Segmentation
4.1. By Type of Plastic (In Value %)
4.1.1. Polycarbonates (PC)
4.1.2. Polyamides (PA)
4.1.3. Acrylonitrile Butadiene Styrene (ABS)
4.1.4. Polyoxymethylene (POM)
4.1.5. Others
4.2. By End-Use Industry (In Value %)
4.2.1. Automotive
4.2.2. Electrical and Electronics
4.2.3. Industrial Machinery
4.2.4. Medical Devices
4.2.5. Consumer Goods
4.3. By Technology (In Value %)
4.3.1. Injection Molding
4.3.2. Extrusion
4.3.3. Blow Molding
4.3.4. 3D Printing
4.4. By Region (In Value %)
4.4.1. North
4.4.2. East
4.4.3. South
4.4.4. West
4.5. By Application (In Value %)
4.5.1. Structural Components
4.5.2. Electrical Insulation
4.5.3. Medical Equipment
4.5.4. Packaging
5. USA Engineering Plastics Market Competitive Analysis
5.1 Detailed Profiles of Major Companies
5.1.1. BASF SE
5.1.2. Dow Inc.
5.1.3. DuPont
5.1.4. SABIC
5.1.5. Covestro
5.1.6. Eastman Chemical Company
5.1.7. Solvay S.A.
5.1.8. LyondellBasell Industries
5.1.9. Arkema S.A.
5.1.10. Evonik Industries AG
5.1.11. Celanese Corporation
5.1.12. Asahi Kasei Corporation
5.1.13. Mitsubishi Chemical Holdings
5.1.14. Lanxess AG
5.1.15. Teijin Limited
5.2 Cross Comparison Parameters
5.2.1. Revenue
5.2.2. Market Share
5.2.3. Headquarters
5.2.4. Number of Employees
5.2.5. R&D Investments
5.2.6. Product Portfolio (Key Engineering Plastics)
5.2.7. Global Presence
5.2.8. Sustainability Initiatives
5.3 Market Share Analysis
5.4 Strategic Initiatives (Product Innovations, Partnerships, Capacity Expansions)
5.5 Mergers and Acquisitions
5.6 Investment Analysis
5.7 Venture Capital Funding
5.8 Government Grants
5.9 Private Equity Investments
6. USA Engineering Plastics Market Regulatory Framework
6.1 Environmental Standards for Plastics Manufacturing
6.2 Compliance with Safety Standards (RoHS, REACH, UL)
6.3 Certification Processes (ISO Certifications for Engineering Plastics)
7. USA Engineering Plastics Future Market Size (In USD Billion)
7.1 Future Market Size Projections
7.2 Key Factors Driving Future Market Growth
8. USA Engineering Plastics Future Market Segmentation
8.1 By Type of Plastic (In Value %)
8.2 By End-Use Industry (In Value %)
8.3 By Technology (In Value %)
8.4 By Region (In Value %)
8.5 By Application (In Value %)
9. USA Engineering Plastics Market Analysts' Recommendations
9.1 TAM/SAM/SOM Analysis
9.2 Customer Cohort Analysis
9.3 Marketing Initiatives
9.4 White Space Opportunity Analysis
Research Methodology
Step 1: Identification of Key Variables
The first step involves mapping out the entire USA engineering plastics market ecosystem, identifying key stakeholders across the automotive, electronics, and industrial machinery industries. This process includes extensive desk research and data gathering through trusted industry reports, government publications, and proprietary databases.
Step 2: Market Analysis and Construction
In this phase, historical data from 2018-2023 is compiled and analyzed, including consumption trends, market penetration by end-use industries, and the adoption of different types of engineering plastics. The data is processed to ensure accurate insights into market performance and growth drivers.
Step 3: Hypothesis Validation and Expert Consultation
Market hypotheses are then validated through interviews with industry experts. These include key executives from engineering plastics manufacturers, as well as specialists in automotive and electronics manufacturing. The insights gained from these consultations help refine the market data.
Step 4: Research Synthesis and Final Output
Finally, the collected data is synthesized and cross-referenced with insights from leading players in the industry to ensure accuracy. This step involves validating all findings against real-world data to present a reliable outlook of the USA engineering plastics market.
Frequently Asked Questions
01. How big is the USA Engineering Plastics Market?
The USA engineering plastics market is valued at USD 14.5 billion, driven by its application in the automotive, electronics, and industrial sectors.
02. What are the major challenges in the USA Engineering Plastics Market?
Challenges in the USA engineering plastics market include fluctuating raw material prices, compliance with stringent environmental regulations, and competition with traditional materials like metals.
03. Who are the major players in the USA Engineering Plastics Market?
Key players in the USA engineering plastics market include BASF, DuPont, Covestro, SABIC, and Solvay, who lead the market through innovation, sustainability efforts, and technological advancements.
04. What are the growth drivers of the USA Engineering Plastics Market?
The USA engineering plastics market is driven by demand for lightweight materials in automotive applications, growing use in electronics for heat-resistant components, and sustainability initiatives.
Why Buy From Us?
 Framework")
What makes us stand out is that our consultants follows Robust, Refine and Result (RRR) methodology. i.e. Robust for clear definitions, approaches and sanity checking, Refine for differentiating respondents facts and opinions and Result for presenting data with story

We have set a benchmark in the industry by offering our clients with syndicated and customized market research reports featuring coverage of entire market as well as meticulous research and analyst insights.

While we don't replace traditional research, we flip the method upside down. Our dual approach of Top Bottom & Bottom Top ensures quality deliverable by not just verifying company fundamentals but also looking at the sector and macroeconomic factors.

With one step in the future, our research team constantly tries to show you the bigger picture. We help with some of the tough questions you may encounter along the way: How is the industry positioned? Best marketing channel? KPI's of competitors? By aligning every element, we help maximize success.

Our report gives you instant access to the answers and sources that other companies might choose to hide. We elaborate each steps of research methodology we have used and showcase you the sample size to earn your trust.

If you need any support, we are here! We pride ourselves on universe strength, data quality, and quick, friendly, and professional service.