
USA Gaming Market Outlook to 2030
Region:North America
Author(s):Vijay Kumar
Product Code:KROD3204
Region:North America
Author(s):Vijay Kumar
Product Code:KROD3204
December 2024
94
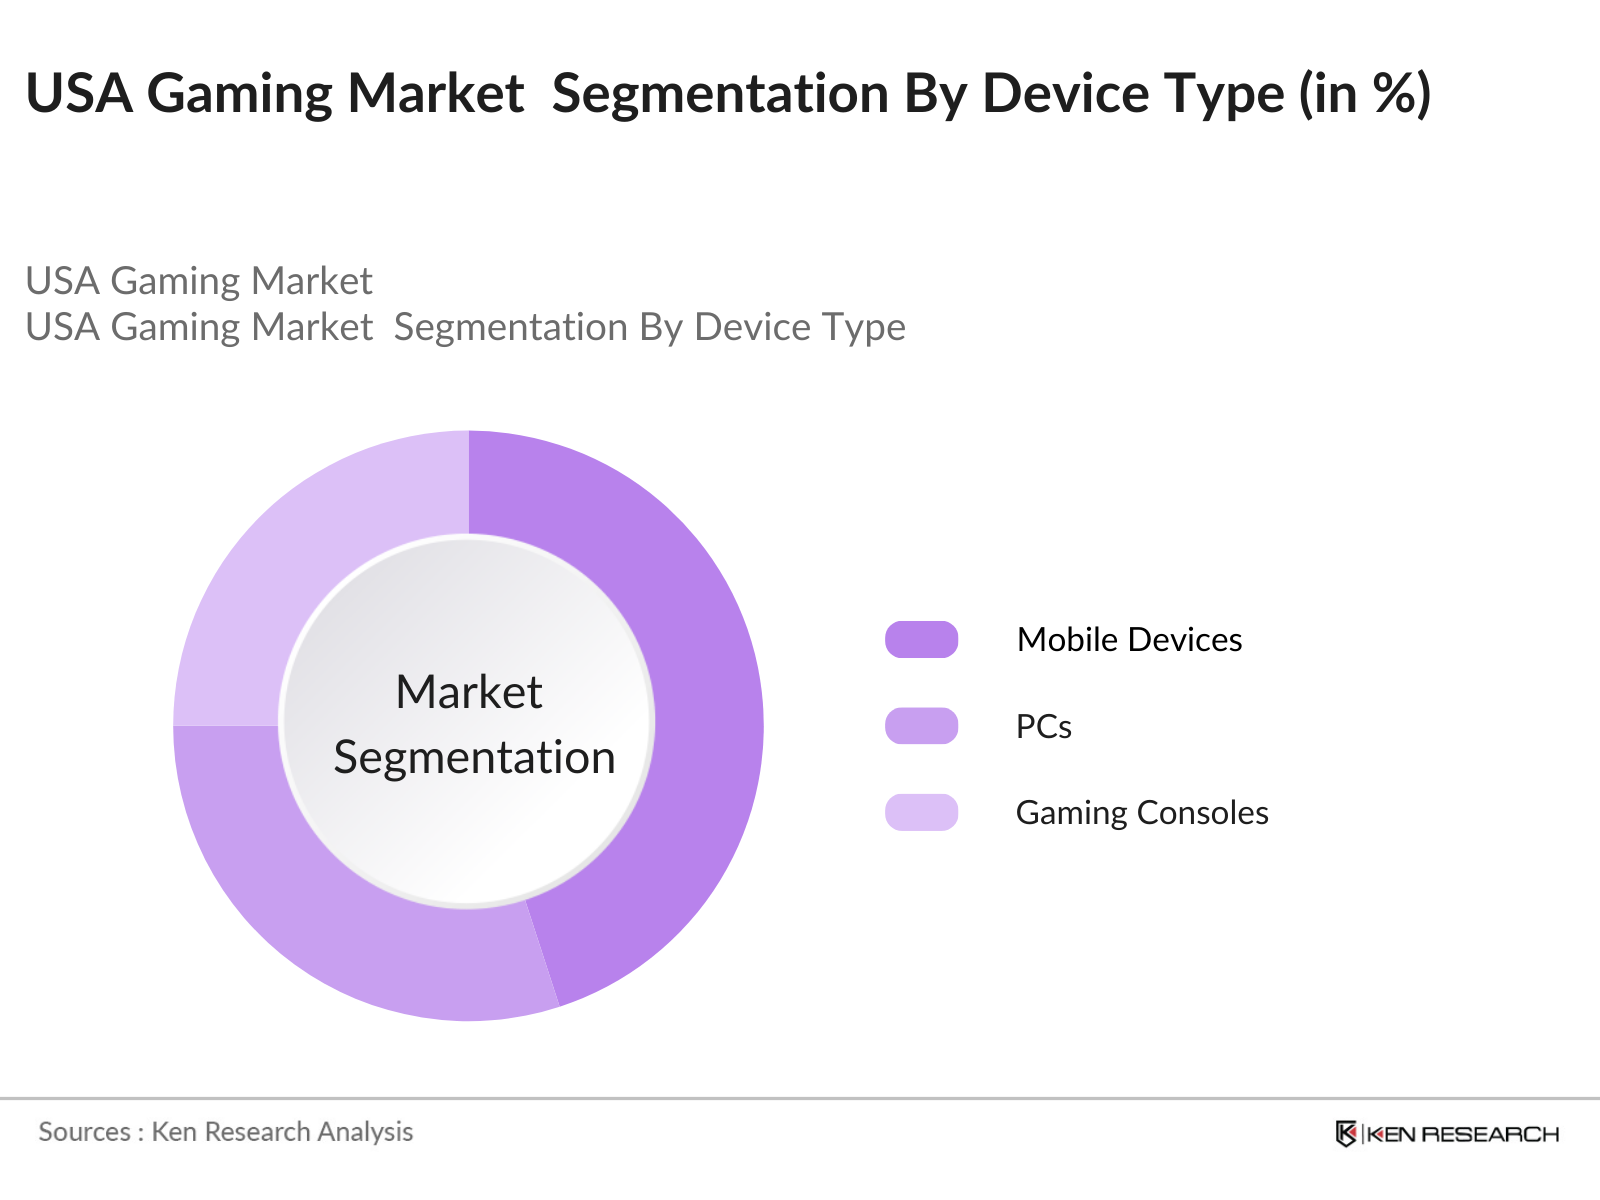
By Device Type: The market is segmented by device type into mobile devices, PCs, and gaming consoles. Mobile gaming holds the largest share due to the widespread adoption of smartphones and easy accessibility to casual and hyper-casual games. Major developers have optimized their games for mobile platforms, allowing users to access free-to-play games with in-app purchases, driving growth in this segment.
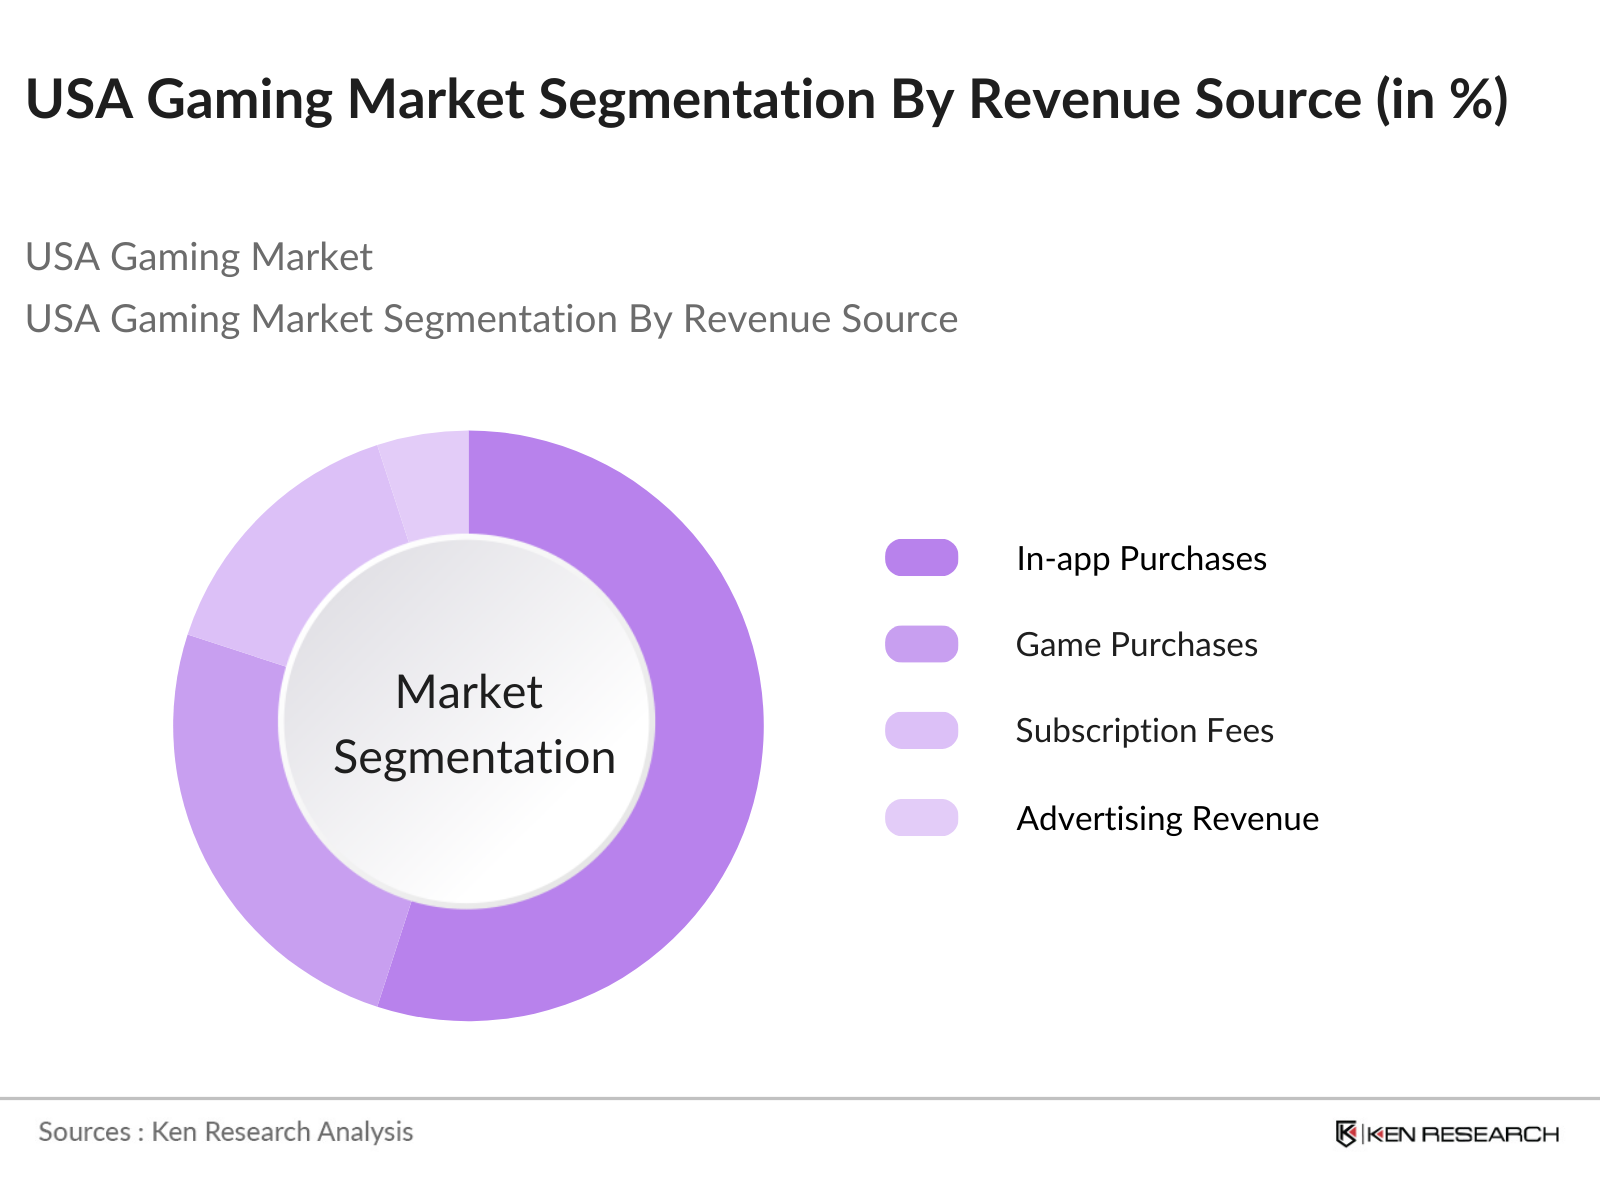
By Revenue Source: The market can also be segmented by revenue source into in-app purchases, game purchases, subscription fees, and advertising revenues. In-app purchases dominate the market due to the rising popularity of free-to-play models, where users can enhance their gaming experience through microtransactions. Popular games like Fortnite and Roblox have successfully monetized through this approach, making in-app purchases the largest revenue generator.
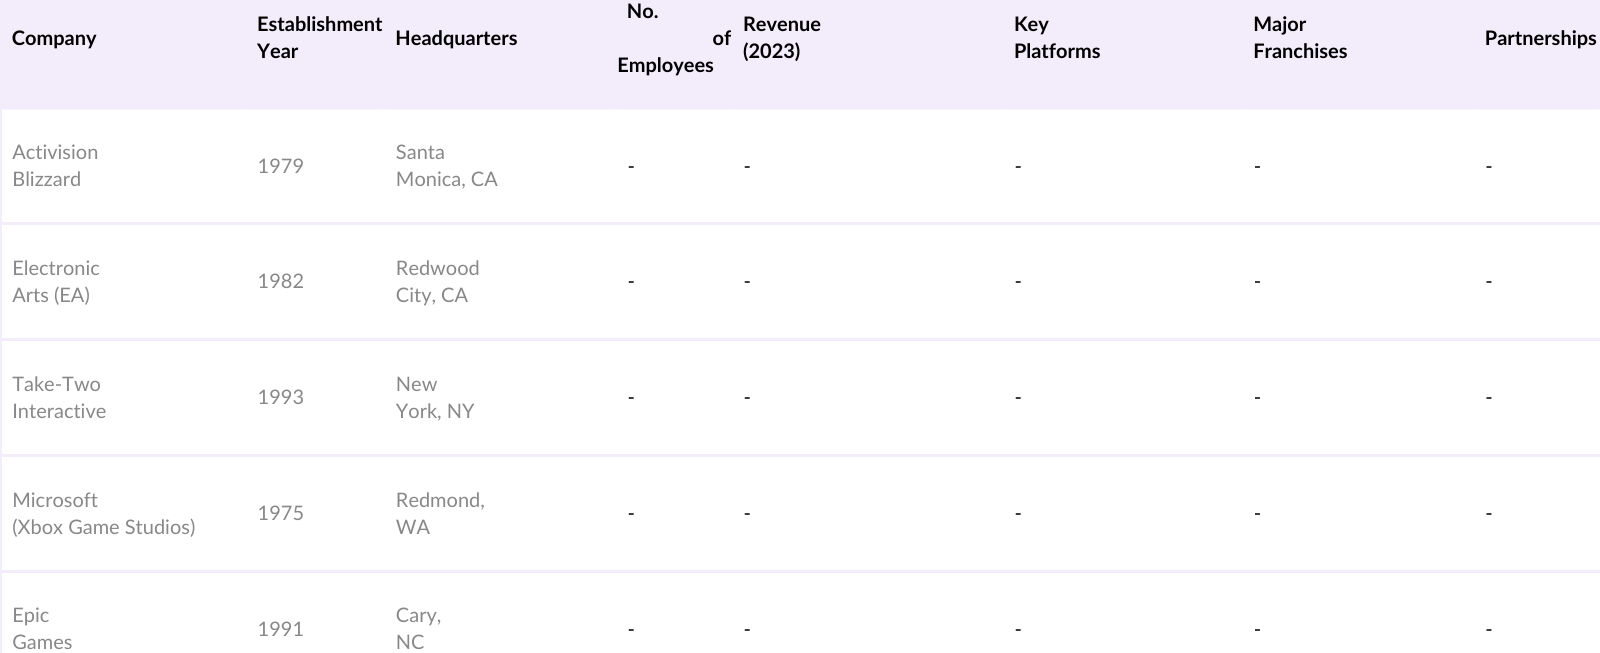
The USA gaming market is characterized by intense competition between global and domestic players. The market is dominated by major gaming corporations and independent studios that have successfully penetrated various platforms like PC, console, and mobile gaming. The competitive landscape is also shaped by acquisitions and partnerships, where companies like Microsoft and Sony have acquired smaller studios to expand their gaming portfolios and strengthen their market positions.
Over the next five years, the USA gaming market is expected to experience substantial growth, driven by the expansion of cloud gaming services, advances in AR/VR technology, and the increasing popularity of esports. Gaming as a service (GaaS) models will continue to gain traction, with major companies investing in subscription platforms to build sustainable revenue streams.
|
Device Type |
Mobile Devices PCs Gaming Consoles |
|
Genre |
Action/Adventure Strategy Sports RPGs Casual |
|
Business Model |
Free-to-Play (F2P) Pay-to-Play (P2P) Subscription-based Ad-Supported |
|
Revenue Source |
In-app Purchases Game Purchases Subscription Fees Advertising Revenues |
|
Region |
North-East Midwest South West |
1.1. Definition and Scope
1.2. Market Taxonomy
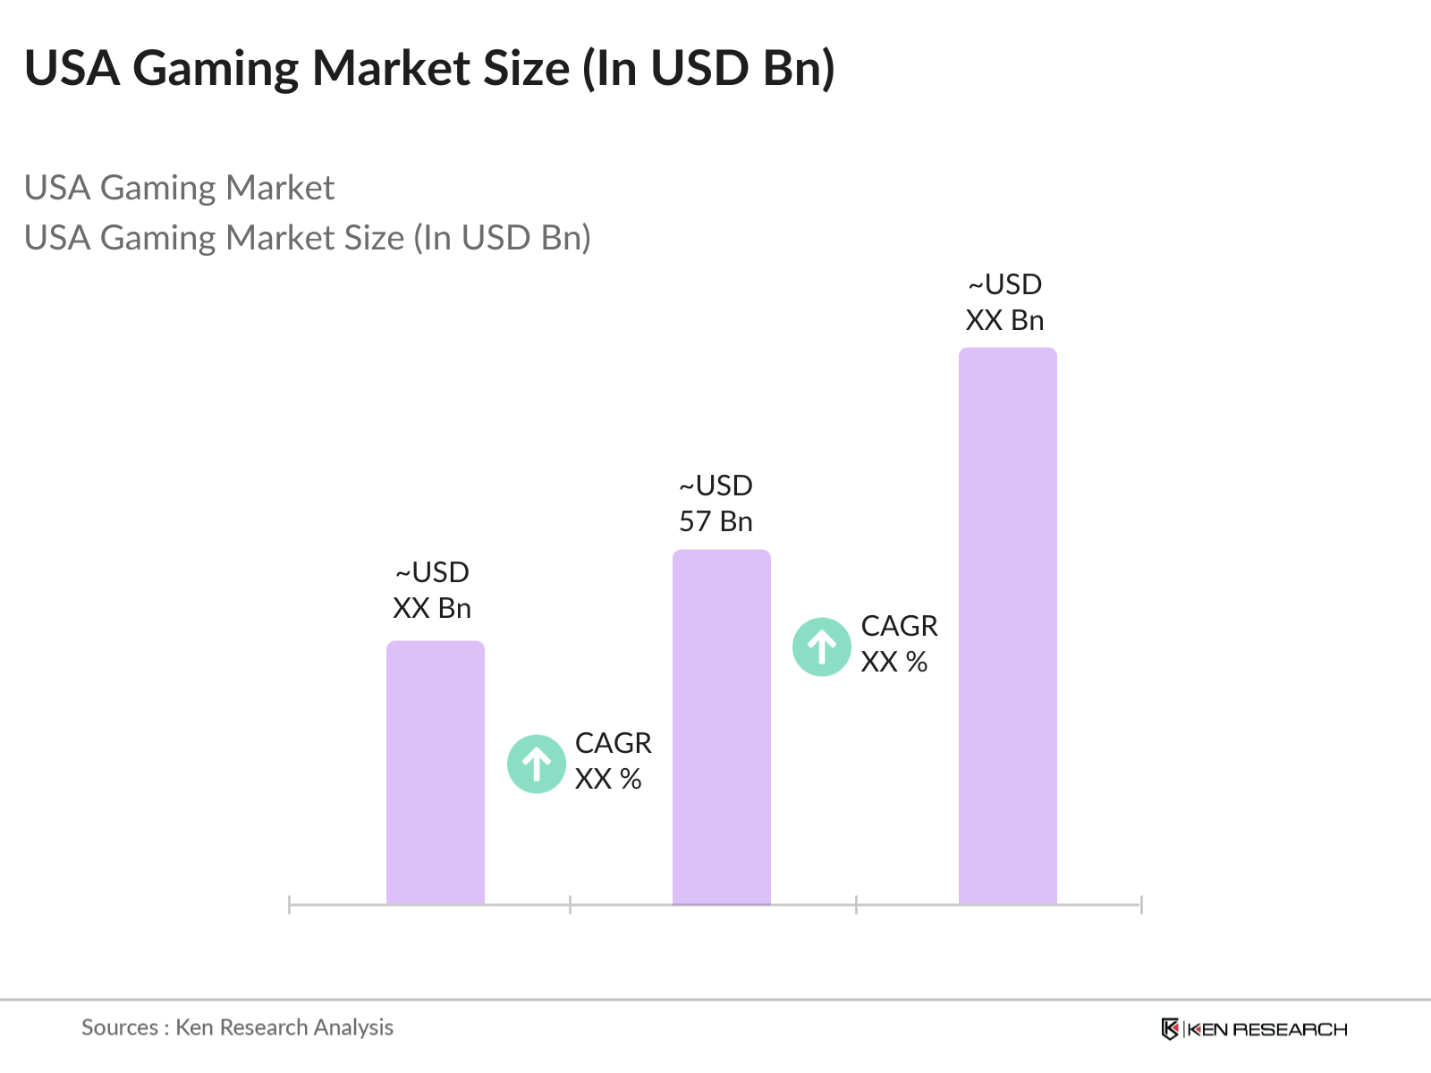
1.3. Market Growth Rate
1.4. Market Segmentation Overview
2.1. Historical Market Size
2.2. Year-on-Year Growth Analysis
2.3. Key Market Developments and Milestones
3.1. Growth Drivers
3.1.1. Increasing Smartphone Penetration
3.1.2. Rise of Esports
3.1.3. Expanding Digital Payments Infrastructure
3.1.4. Emergence of Cloud Gaming Platforms
3.2. Market Challenges
3.2.1. Stringent Government Regulations
3.2.2. Rising Cybersecurity Concerns
3.2.3. High Competition in Mobile Gaming
3.2.4. Technological Limitations in Rural Areas
3.3. Opportunities
3.3.1. Expansion of Subscription-based Gaming Services
3.3.2. Growth in AR/VR Gaming
3.3.3. Increased Focus on In-game Monetization
3.3.4. Development of Cross-Platform Gaming
3.4. Trends
3.4.1. Rising Popularity of Metaverse Gaming
3.4.2. Adoption of Blockchain in Gaming
3.4.3. Growth of Hyper-casual Games
3.4.4. Influencer Marketing and Gaming Partnerships
3.5. Government Regulations
3.5.1. US Gaming Industry Tax Laws
3.5.2. State-wise Regulatory Frameworks
3.5.3. Data Protection Laws for Gamers
3.5.4. Federal Regulations on Gambling Mechanics
3.6. SWOT Analysis
3.7. Stakeholder Ecosystem
3.8. Porters Five Forces Analysis
3.9. Competition Ecosystem
4.1. By Device Type (In Value %)
4.1.1. Mobile Devices
4.1.2. PCs
4.1.3. Gaming Consoles
4.2. By Genre (In Value %)
4.2.1. Action/Adventure Games
4.2.2. Strategy Games
4.2.3. Sports Games
4.2.4. Role-Playing Games (RPGs)
4.2.5. Casual Games
4.3. By Business Model (In Value %)
4.3.1. Free-to-Play (F2P)
4.3.2. Pay-to-Play (P2P)
4.3.3. Subscription-based
4.3.4. Ad-Supported
4.4. By Revenue Source (In Value %)
4.4.1. In-app Purchases
4.4.2. Game Purchases
4.4.3. Subscription Fees
4.4.4. Advertising Revenues
4.5. By Region (In Value %)
4.5.1. North-East
4.5.2. Midwest
4.5.3. South
4.5.4. West
5.1. Detailed Profiles of Major Competitors
5.1.1. Activision Blizzard, Inc.
5.1.2. Electronic Arts Inc.
5.1.3. Take-Two Interactive Software, Inc.
5.1.4. Microsoft Corporation (Xbox Game Studios)
5.1.5. Sony Interactive Entertainment LLC
5.1.6. Nintendo Co., Ltd.
5.1.7. Epic Games, Inc.
5.1.8. Tencent Holdings Ltd.
5.1.9. Ubisoft Entertainment SA
5.1.10. Riot Games, Inc.
5.1.11. Roblox Corporation
5.1.12. Valve Corporation
5.1.13. Zynga Inc.
5.1.14. Nexon Co., Ltd.
5.1.15. Square Enix Holdings Co., Ltd.
5.2. Cross Comparison Parameters (No. of Employees, Headquarters, Inception Year, Revenue, Player Base, Gaming Platforms, Strategic Partnerships, Global Reach)
5.3. Market Share Analysis
5.4. Strategic Initiatives
5.5. Mergers and Acquisitions
5.6. Investment Analysis
5.7. Venture Capital Funding
5.8. Private Equity Investments
6.1. Compliance Requirements
6.2. Certification Processes
6.3. State-Level Restrictions on In-game Purchases
6.4. Data Privacy and Protection Guidelines
7.1. Future Market Size Projections
7.2. Key Factors Driving Future Market Growth
8.1. By Device Type (In Value %)
8.2. By Genre (In Value %)
8.3. By Business Model (In Value %)
8.4. By Revenue Source (In Value %)
8.5. By Region (In Value %)
9.1. TAM/SAM/SOM Analysis
9.2. Consumer Segment Analysis
9.3. Marketing Initiatives
9.4. White Space Opportunity Analysis
Disclaimer Contact UsThe initial phase involves identifying major stakeholders in the USA gaming market. This process includes comprehensive desk research using secondary and proprietary databases to collect industry information, with a focus on defining key factors such as consumer trends, gaming platforms, and revenue streams.
Historical data from 2018 to 2023 is analyzed to assess market size, growth drivers, and the share of various gaming platforms. Market penetration rates and revenue generation are calculated for the major segments, ensuring data accuracy through statistical methods.
Industry hypotheses are validated through interviews with executives from leading game developers, esports organizations, and cloud gaming platforms. These interviews provide insight into market challenges, opportunities, and competitive strategies.
The final phase includes data synthesis and verification through multiple sources, including game publishers and platform providers. This ensures that the final report provides a comprehensive, validated analysis of the USA gaming market.
The USA gaming market is valued at approximately USD 57 billion, driven by increasing digital gaming consumption across platforms like mobile, console, and PC. The growing esports industry and in-game purchases also contribute significantly to the market's value.
Key challenges include stringent government regulations, particularly regarding loot boxes and in-game purchases, and rising cybersecurity threats. High competition in the mobile gaming segment further intensifies market rivalry.
Major players in the USA gaming market include Activision Blizzard, Electronic Arts, Take-Two Interactive, Microsoft (Xbox), and Sony. These companies dominate due to their strong portfolios, brand loyalty, and significant investments in technology and gaming studios.
Growth in the USA gaming market is driven by the increasing adoption of smartphones, the expansion of cloud gaming services, and the growing popularity of esports. Continuous advancements in gaming hardware also contribute to market expansion.
 Framework")
What makes us stand out is that our consultants follows Robust, Refine and Result (RRR) methodology. i.e. Robust for clear definitions, approaches and sanity checking, Refine for differentiating respondents facts and opinions and Result for presenting data with story

We have set a benchmark in the industry by offering our clients with syndicated and customized market research reports featuring coverage of entire market as well as meticulous research and analyst insights.

While we don't replace traditional research, we flip the method upside down. Our dual approach of Top Bottom & Bottom Top ensures quality deliverable by not just verifying company fundamentals but also looking at the sector and macroeconomic factors.

With one step in the future, our research team constantly tries to show you the bigger picture. We help with some of the tough questions you may encounter along the way: How is the industry positioned? Best marketing channel? KPI's of competitors? By aligning every element, we help maximize success.

Our report gives you instant access to the answers and sources that other companies might choose to hide. We elaborate each steps of research methodology we have used and showcase you the sample size to earn your trust.

If you need any support, we are here! We pride ourselves on universe strength, data quality, and quick, friendly, and professional service.