
USA Low Speed Vehicle Market Outlook to 2030
Region:North America
Author(s):Vijay Kumar
Product Code:KROD6328
December 2024
94
About the Report
USA Low Speed Vehicle (LSV) Market Overview
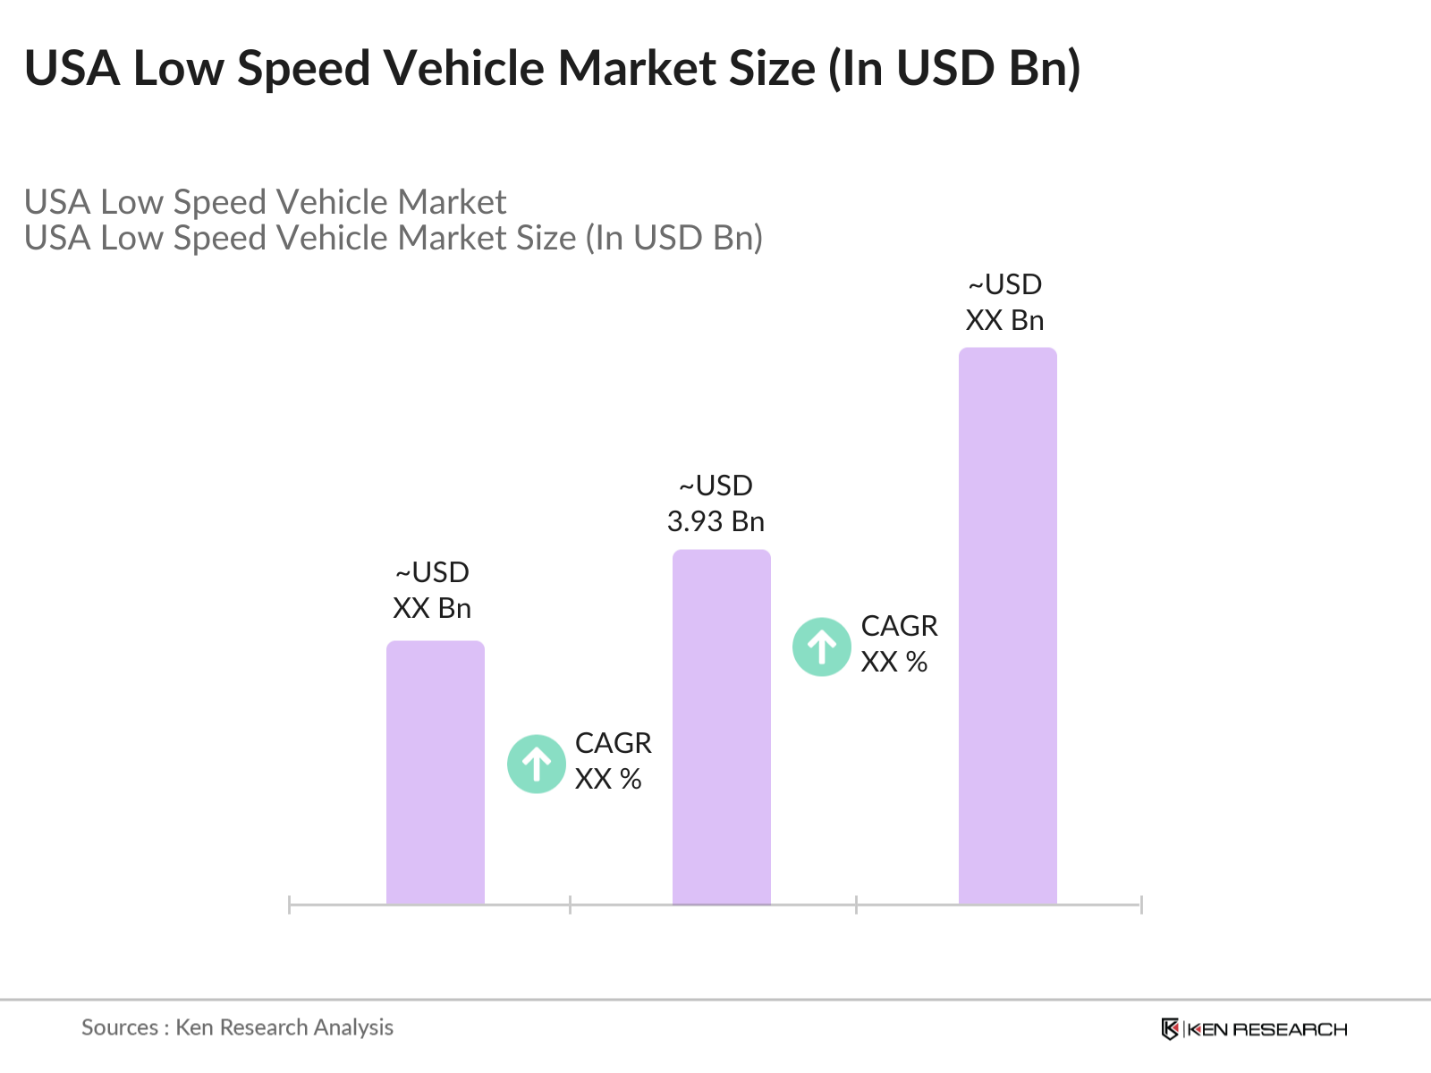
- The USA Low Speed Vehicle (LSV) market is valued at USD 3.93 billion, based on a five-year historical analysis. This market's growth is primarily driven by the increasing demand for eco-friendly transportation options and the expansion of golf courses, resorts, and retirement communities, where LSVs offer a convenient and sustainable means of transportation. With a growing emphasis on reducing emissions and enhancing short-distance mobility, these vehicles are gaining popularity in gated communities, commercial establishments, and industrial settings.
- Dominant regions in the USA LSV market include the South and West, attributed to favorable climates that support year-round use, a high concentration of golf courses, and a strong presence of retirement communities. These factors contribute to the widespread adoption and utilization of LSVs in these areas.
- In the United States, low-speed vehicles (LSVs) are subject to specific safety regulations under the Federal Motor Vehicle Safety Standards (FMVSS). Standard No. 500 outlines requirements for LSVs, including a maximum speed of 25 mph, and mandates safety features such as headlights, turn signals, mirrors, and seat belts.
USA Low Speed Vehicle Market Segmentation
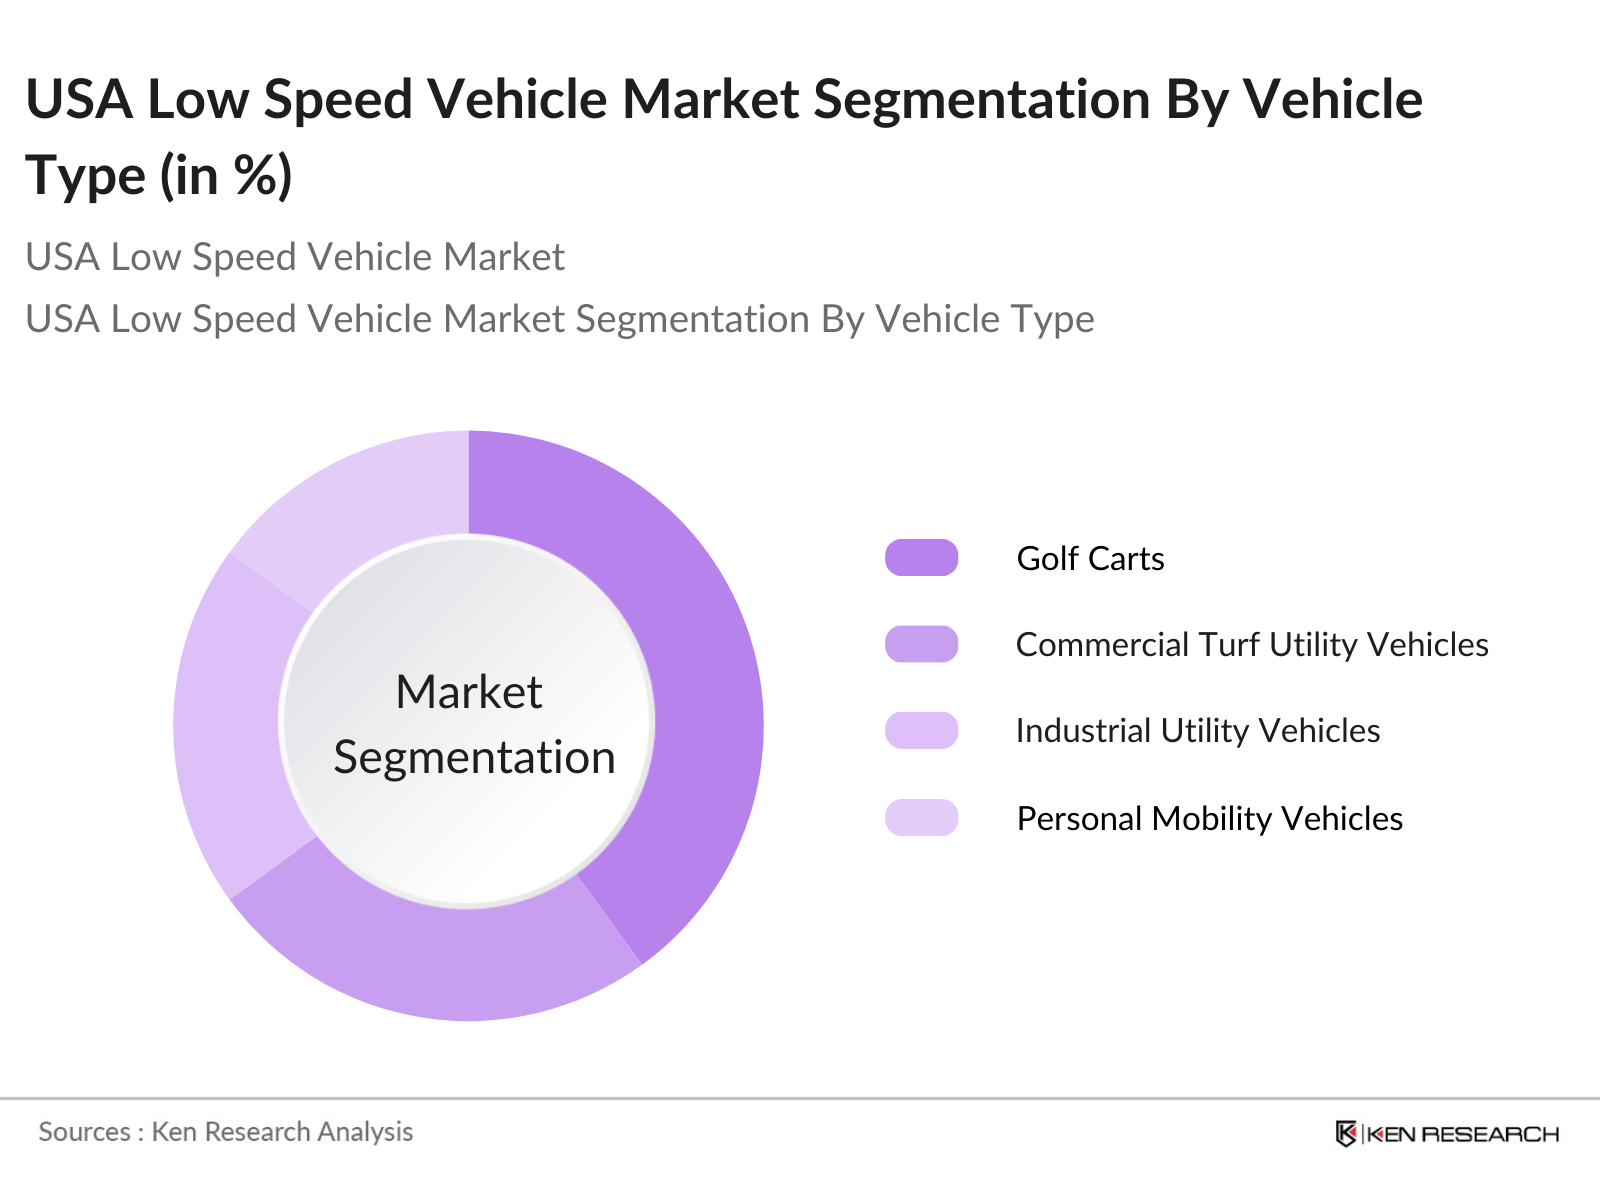
By Vehicle Type: The USA LSV market is segmented by vehicle type into golf carts, commercial turf utility vehicles, industrial utility vehicles, and personal mobility vehicles. Golf carts hold a dominant market share in this segment due to their extensive use in golf courses, resorts, and gated communities. Their versatility and ease of use make them a preferred choice for short-distance transportation in these settings.
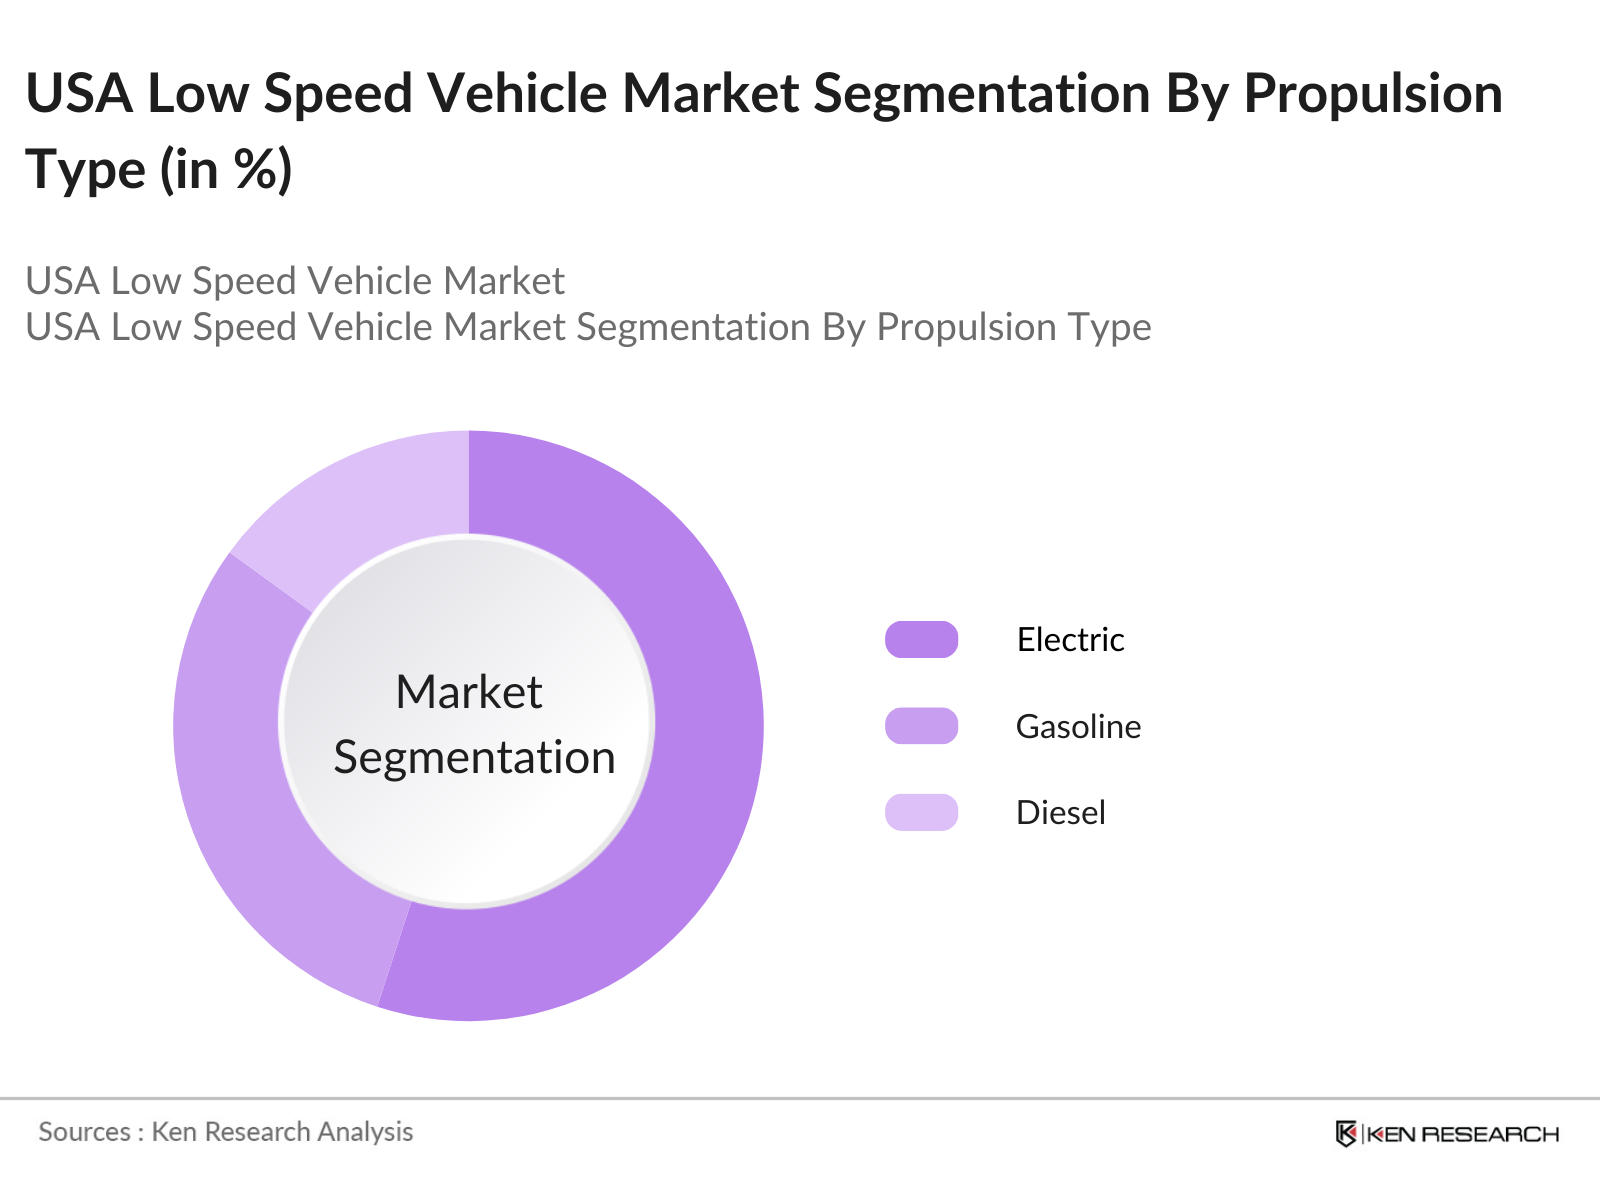
By Propulsion Type: The market is also segmented by propulsion type into electric, gasoline, and diesel LSVs. Electric LSVs dominate this segment, driven by increasing environmental awareness and stringent emission regulations. Their low operating costs and reduced environmental impact make them an attractive option for consumers and businesses alike.
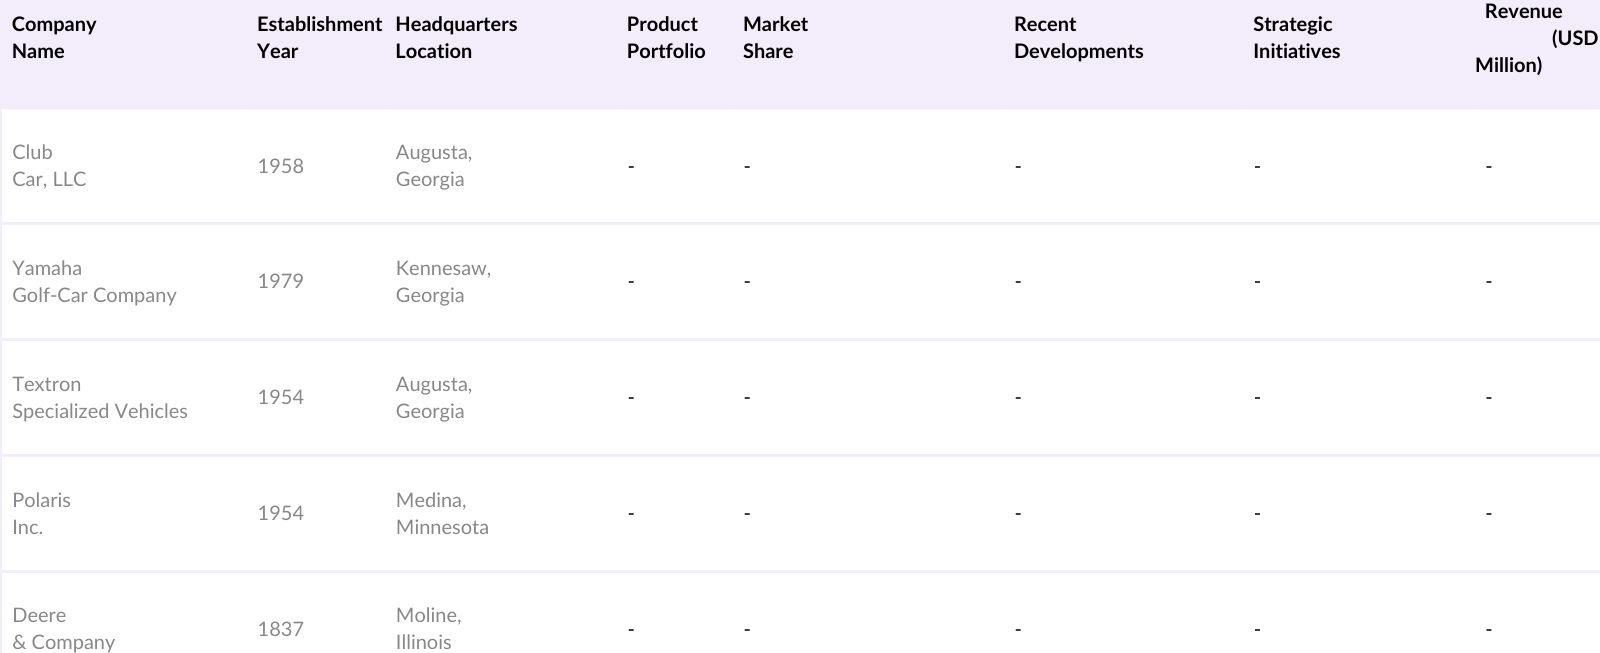
USA Low Speed Vehicle Market Competitive Landscape
The USA LSV market is characterized by the presence of several key players who contribute to its growth and development. The table below provides an overview of five major companies in the market:
USA Low Speed Vehicle Industry Analysis
Growth Drivers
- Increasing Demand for Eco-Friendly Transportation: The United States has been actively promoting eco-friendly transportation to reduce greenhouse gas emissions. In 2022, the transportation sector was responsible for approximately 1,870 million metric tons of CO emissions, accounting for 27% of the nation's total emissions. To address this, the Environmental Protection Agency (EPA) has implemented stringent emission standards for light-duty vehicles, aiming to decrease CO emissions by 2,200 million metric tons by 2050. Low-speed vehicles (LSVs), typically electric and emitting zero tailpipe emissions, align with these environmental objectives, making them a favorable option for short-distance travel in urban and suburban areas.
- Expansion of Golf Courses and Resorts: The United States boasts a significant number of golf courses and resorts, with over 16,000 golf courses as of 2023. The golf industry contributes approximately $84 billion annually to the U.S. economy, supporting nearly 2 million jobs. LSVs, such as golf carts, are integral to the operation of these facilities, facilitating the movement of players and equipment. The consistent growth and development of golf courses and resorts drive the demand for LSVs in these settings.
- Rising Adoption in Industrial and Commercial Applications: Industries and commercial establishments are increasingly adopting LSVs for on-site transportation and logistics. For instance, large manufacturing plants and warehouses utilize LSVs to transport goods and personnel efficiently. The U.S. manufacturing sector, which contributed $2.3 trillion to the GDP in 2022, benefits from the operational efficiency provided by LSVs. Additionally, commercial facilities like airports and university campuses employ LSVs to enhance mobility and reduce operational costs.
Market Challenges
- Safety Concerns and Regulatory Compliance: While LSVs are designed for low-speed environments, safety concerns persist, especially when operating on public roads. The National Highway Traffic Safety Administration (NHTSA) has established regulations requiring LSVs to have safety features such as seat belts, mirrors, and lighting systems. However, the absence of airbags and the vehicle's lightweight construction can pose risks in collisions. Ensuring compliance with these safety standards is crucial for manufacturers and users to mitigate potential hazards.
- Limited Performance and Range: LSVs are typically designed for short-distance travel, with maximum speeds of 25 mph and limited battery ranges. This limitation restricts their use to specific environments such as gated communities, campuses, and industrial sites. For example, the average electric LSV offers a range of 30 to 40 miles on a full charge, which may not suffice for longer commutes or varied terrains. Advancements in battery technology are needed to enhance performance and expand the applicability of LSVs.
USA Low Speed Vehicle Market Future Outlook
Over the next five years, the USA LSV market is expected to experience significant growth, driven by continuous government support, advancements in electric vehicle technology, and increasing consumer demand for eco-friendly transportation solutions. The expansion of urban areas and the development of smart city initiatives are also anticipated to contribute to the rising adoption of LSVs across various applications.
Market Opportunities
- Technological Advancements in Battery and Charging Infrastructure: Advancements in battery technology, such as the development of lithium-ion and solid-state batteries, have the potential to enhance the range and performance of LSVs. Additionally, the expansion of charging infrastructure across the U.S. supports the adoption of electric vehicles, including LSVs. As of 2023, there are over 130,000 public charging stations nationwide, facilitating convenient charging options for users. These developments can address range limitations and encourage broader use of LSVs.
- Integration with Smart City Initiatives: Smart city initiatives aim to enhance urban living through technology and sustainable practices. LSVs can play a role in these initiatives by providing eco-friendly transportation solutions for short trips within city limits. Cities like Austin, Texas, have implemented LSVs for downtown mobility, reducing traffic congestion and emissions. The integration of LSVs into urban transportation networks aligns with smart city goals of sustainability and efficiency.
Scope of the Report
|
Vehicle Type |
Golf Carts Commercial Turf Utility Vehicles Industrial Utility Vehicles Personal Mobility Vehicles |
|
Power Output |
Less than 8 kW 815 kW More than 15 kW |
|
Propulsion Type |
Electric Gasoline Diesel |
|
Application |
Golf Courses Hotels and Resorts Industrial Facilities Airports Residential and Commercial Premises |
|
Region |
Northeast Midwest South West |
Products
Key Target Audience
Automotive Manufacturers
Component Suppliers
Fleet Management Companies
Urban Planning Agencies
Government and Regulatory Bodies (e.g., USA Department of Transportation)
Investment and Venture Capitalist Firms
Environmental Organizations
Hospitality Industry Stakeholders
Companies
Players Mentioned in the Report
Club Car, LLC
Yamaha Golf-Car Company
Textron Specialized Vehicles
Polaris Inc.
Deere & Company
The Toro Company
Columbia Vehicle Group Inc.
American Landmaster
Garia Inc.
Moto Electric Vehicles
Table of Contents
1. USA Low Speed Vehicle Market Overview
1.1. Definition and Scope
1.2. Market Taxonomy
1.3. Market Growth Rate
1.4. Market Segmentation Overview
2. USA Low Speed Vehicle Market Size (USD Million)
2.1. Historical Market Size
2.2. Year-On-Year Growth Analysis
2.3. Key Market Developments and Milestones
3. USA Low Speed Vehicle Market Analysis
3.1. Growth Drivers
3.1.1. Increasing Demand for Eco-Friendly Transportation
3.1.2. Expansion of Golf Courses and Resorts
3.1.3. Rising Adoption in Industrial and Commercial Applications
3.1.4. Government Incentives and Regulations
3.2. Market Challenges
3.2.1. Safety Concerns and Regulatory Compliance
3.2.2. Limited Performance and Range
3.2.3. High Initial Costs
3.3. Opportunities
3.3.1. Technological Advancements in Battery and Charging Infrastructure
3.3.2. Integration with Smart City Initiatives
3.3.3. Expansion into New Application Areas
3.4. Trends
3.4.1. Adoption of Autonomous Features
3.4.2. Customization and Personalization Options
3.4.3. Increased Use in Last-Mile Delivery Services
3.5. Government Regulations
3.5.1. Federal Motor Vehicle Safety Standards (FMVSS)
3.5.2. State-Specific Regulations
3.5.3. Emission Standards and Environmental Policies
3.6. SWOT Analysis
3.7. Stakeholder Ecosystem
3.8. Porters Five Forces Analysis
3.9. Competitive Landscape
4. USA Low Speed Vehicle Market Segmentation
4.1. By Vehicle Type (Value %)
4.1.1. Golf Carts
4.1.2. Commercial Turf Utility Vehicles
4.1.3. Industrial Utility Vehicles
4.1.4. Personal Mobility Vehicles
4.2. By Power Output (Value %)
4.2.1. Less than 8 kW
4.2.2. 815 kW
4.2.3. More than 15 kW
4.3. By Propulsion Type (Value %)
4.3.1. Electric
4.3.2. Gasoline
4.3.3. Diesel
4.4. By Application (Value %)
4.4.1. Golf Courses
4.4.2. Hotels and Resorts
4.4.3. Industrial Facilities
4.4.4. Airports
4.4.5. Residential and Commercial Premises
4.5. By Region (Value %)
4.5.1. Northeast
4.5.2. Midwest
4.5.3. South
4.5.4. West
5. USA Low Speed Vehicle Market Competitive Analysis
5.1. Detailed Profiles of Major Companies
5.1.1. Club Car, LLC
5.1.2. Yamaha Golf-Car Company
5.1.3. Textron Specialized Vehicles Inc.
5.1.4. Polaris Inc.
5.1.5. Deere & Company
5.1.6. The Toro Company
5.1.7. Columbia Vehicle Group Inc.
5.1.8. American Landmaster
5.1.9. Garia Inc.
5.1.10. Moto Electric Vehicles
5.1.11. Star EV Corporation
5.1.12. Tomberlin Automotive Group
5.1.13. E-Z-GO
5.1.14. HDK Electric Vehicles
5.1.15. Bintelli Electric Vehicles
5.2. Cross Comparison Parameters (Number of Employees, Headquarters, Inception Year, Revenue, Product Portfolio, Market Share, Recent Developments, Strategic Initiatives)
5.3. Market Share Analysis
5.4. Strategic Initiatives
5.5. Mergers and Acquisitions
5.6. Investment Analysis
5.6.1. Venture Capital Funding
5.6.2. Government Grants
5.6.3. Private Equity Investments
6. USA Low Speed Vehicle Market Regulatory Framework
6.1. Federal and State Regulations
6.2. Compliance Requirements
6.3. Certification Processes
7. USA Low Speed Vehicle Future Market Size (USD Million)
7.1. Future Market Size Projections
7.2. Key Factors Driving Future Market Growth
8. USA Low Speed Vehicle Future Market Segmentation
8.1. By Vehicle Type (Value %)
8.2. By Power Output (Value %)
8.3. By Propulsion Type (Value %)
8.4. By Application (Value %)
8.5. By Region (Value %)
9. USA Low Speed Vehicle Market Analysts Recommendations
9.1. Total Addressable Market (TAM), Serviceable Available Market (SAM), and Serviceable Obtainable Market (SOM) Analysis
9.2. Customer Cohort Analysis
9.3. Marketing Initiatives
9.4. White Space Opportunity Analysis
Disclaimer Contact UsResearch Methodology
Step 1: Identification of Key Variables
The initial phase involves constructing an ecosystem map encompassing all major stakeholders within the USA Low Speed Vehicle Market. This step is underpinned by extensive desk research, utilizing a combination of secondary and proprietary databases to gather comprehensive industry-level information. The primary objective is to identify and define the critical variables that influence market dynamics.
Step 2: Market Analysis and Construction
In this phase, we compile and analyze historical data pertaining to the USA Low Speed Vehicle Market. This includes assessing market penetration, the ratio of marketplaces to service providers, and the resultant revenue generation. Furthermore, an evaluation of service quality statistics is conducted to ensure the reliability and accuracy of the revenue estimates.
Step 3: Hypothesis Validation and Expert Consultation
Market hypotheses are developed and subsequently validated through computer-assisted telephone interviews (CATIs) with industry experts representing a diverse array of companies. These consultations provide valuable operational and financial insights directly from industry practitioners, which are instrumental in refining and corroborating the market data.
Step 4: Research Synthesis and Final Output
The final phase involves direct engagement with multiple low speed vehicle manufacturers to acquire detailed insights into product segments, sales performance, consumer preferences, and other pertinent factors. This interaction serves to verify and complement the statistics derived from the bottom-up approach, thereby ensuring a comprehensive, accurate, and validated analysis of the USA Low Speed Vehicle market.
Frequently Asked Questions
1. How big is the USA Low Speed Vehicle Market?
The USA Low Speed Vehicle (LSV) market is valued at USD 3.93 billion, based on a five-year historical analysis. This market's growth is primarily driven by the increasing demand for eco-friendly transportation options and the expansion of golf courses, resorts, and retirement communities, where LSVs offer a convenient and sustainable means of transportation.
2. What are the challenges in the USA Low Speed Vehicle Market?
Challenges include safety concerns, regulatory compliance, limited performance and range, and high initial costs associated with LSVs.
3. Who are the major players in the USA Low Speed Vehicle Market?
Key players in the market include Club Car, LLC; Yamaha Golf-Car Company; Textron Specialized Vehicles; Polaris Inc.; and Deere & Company.
4. What are the growth drivers of the USA Low Speed Vehicle Market?
The market is propelled by factors such as increasing environmental awareness, government incentives, technological advancements in battery and charging infrastructure, and the expansion of urban areas.
Why Buy From Us?
 Framework")
What makes us stand out is that our consultants follows Robust, Refine and Result (RRR) methodology. i.e. Robust for clear definitions, approaches and sanity checking, Refine for differentiating respondents facts and opinions and Result for presenting data with story

We have set a benchmark in the industry by offering our clients with syndicated and customized market research reports featuring coverage of entire market as well as meticulous research and analyst insights.

While we don't replace traditional research, we flip the method upside down. Our dual approach of Top Bottom & Bottom Top ensures quality deliverable by not just verifying company fundamentals but also looking at the sector and macroeconomic factors.

With one step in the future, our research team constantly tries to show you the bigger picture. We help with some of the tough questions you may encounter along the way: How is the industry positioned? Best marketing channel? KPI's of competitors? By aligning every element, we help maximize success.

Our report gives you instant access to the answers and sources that other companies might choose to hide. We elaborate each steps of research methodology we have used and showcase you the sample size to earn your trust.

If you need any support, we are here! We pride ourselves on universe strength, data quality, and quick, friendly, and professional service.