
USA Mobile Games Market Outlook to 2030
Region:United States
Author(s):Shreya Garg
Product Code:KROD4480
Region:United States
Author(s):Shreya Garg
Product Code:KROD4480
November 2024
91
By Game Type: The market is segmented by game type into casual games, role-playing games (RPG), strategy games, and action-adventure games. Recently, casual games have gained dominance due to their accessibility and broad appeal. Casual games are lightweight, often free-to-play, and require minimal time commitment, making them highly popular among users of all age groups. Games like Candy Crush and Among Us have surged in popularity, backed by easy monetization through in-app purchases and ads, particularly appealing to a mass market.
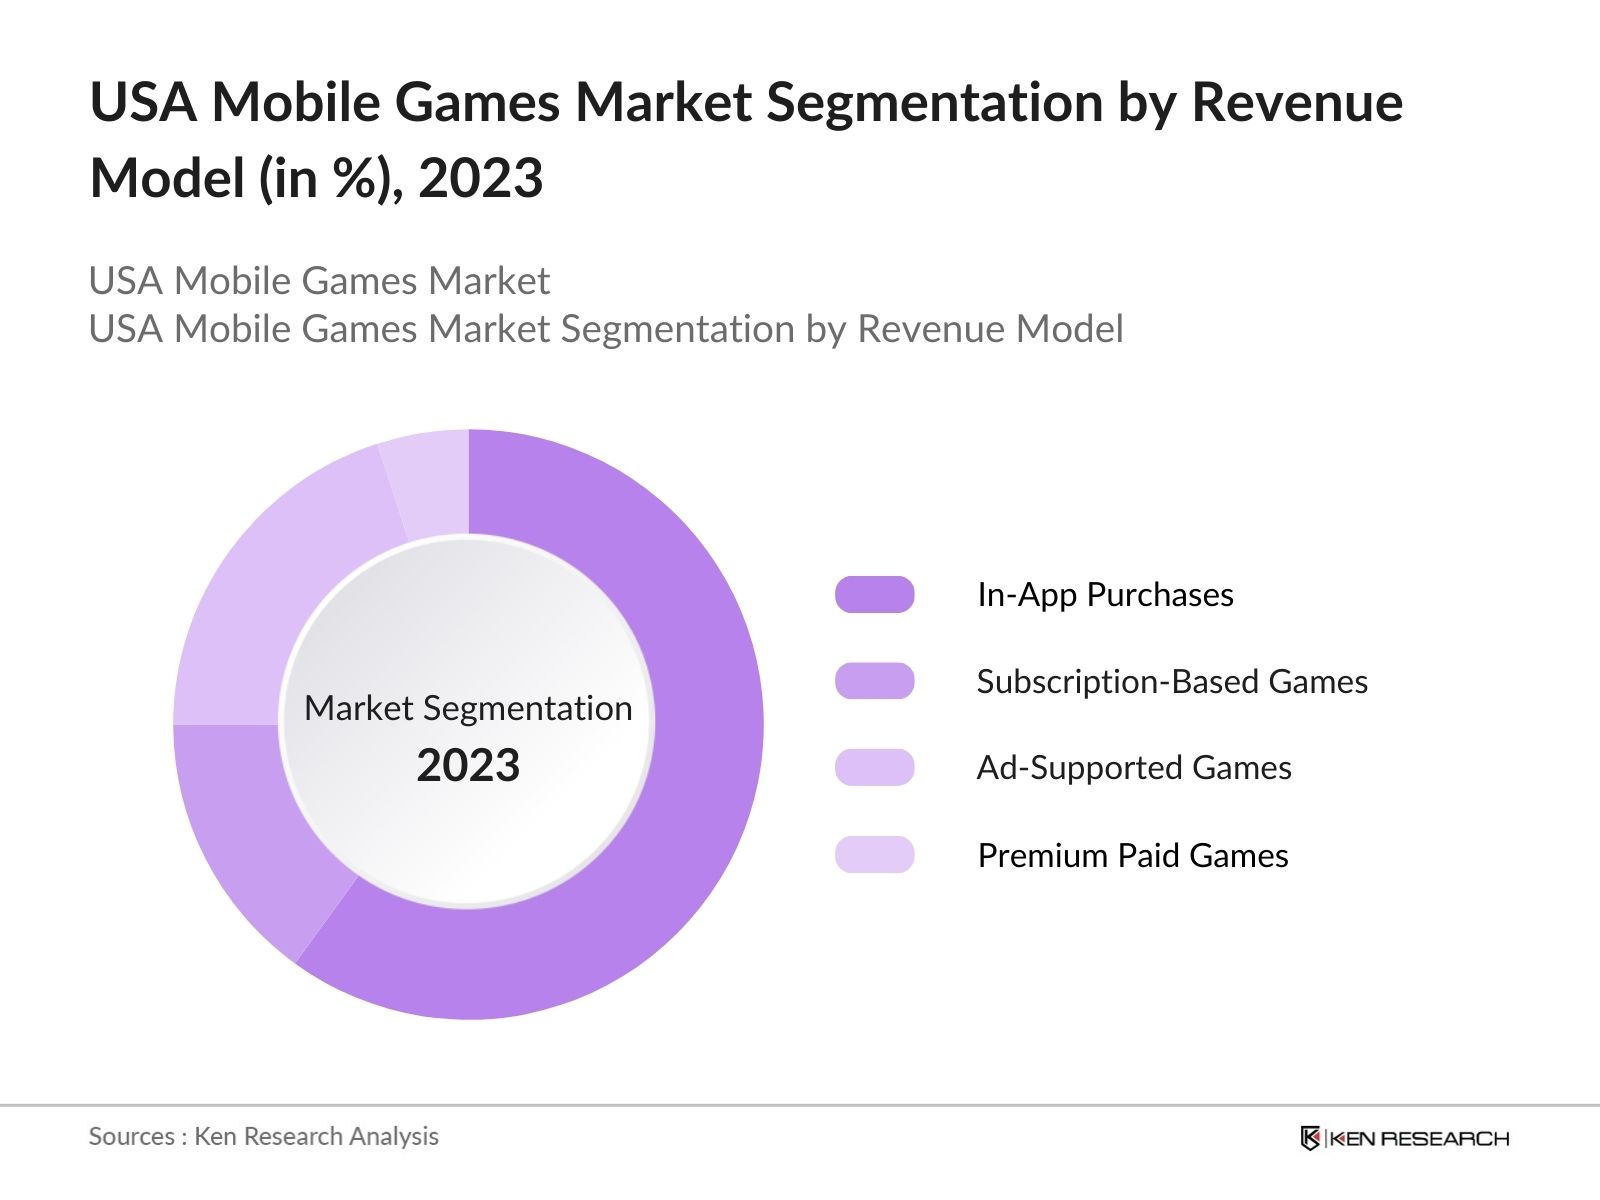
 By Revenue Model: The games market is also segmented by revenue model, which includes in-app purchases, subscription-based games, ad-supported games, and premium paid games. Among these, in-app purchases dominate, primarily due to the freemium model's success. This model allows users to download and play the basic game for free while offering paid enhancements or content upgrades. This monetization strategy has become the cornerstone for game developers and publishers, contributing to a large portion of the market's revenue.
The USA mobile games market is dominated by a mix of local and global companies, with some of the largest gaming studios based in the United States. Companies like Activision Blizzard and Electronic Arts lead in game development, and others like Supercell and Tencent have secured strong footholds in the market through successful partnerships. This competitive environment highlights the industry's consolidation, where a few key players hold substantial influence.
|
Company |
Established |
Headquarters |
Revenue Model |
Top Game Titles |
No. of Employees |
Platform Dominance |
Global Reach |
Investment in AR/VR |
Mobile Game Subsidiary |
|
Activision Blizzard |
2008 |
Santa Monica, CA |
|||||||
|
Electronic Arts |
1982 |
Redwood City, CA |
|||||||
|
Supercell |
2010 |
Helsinki, Finland |
|||||||
|
Zynga |
2007 |
San Francisco, CA |
|||||||
|
Tencent Games |
2003 |
Shenzhen, China |
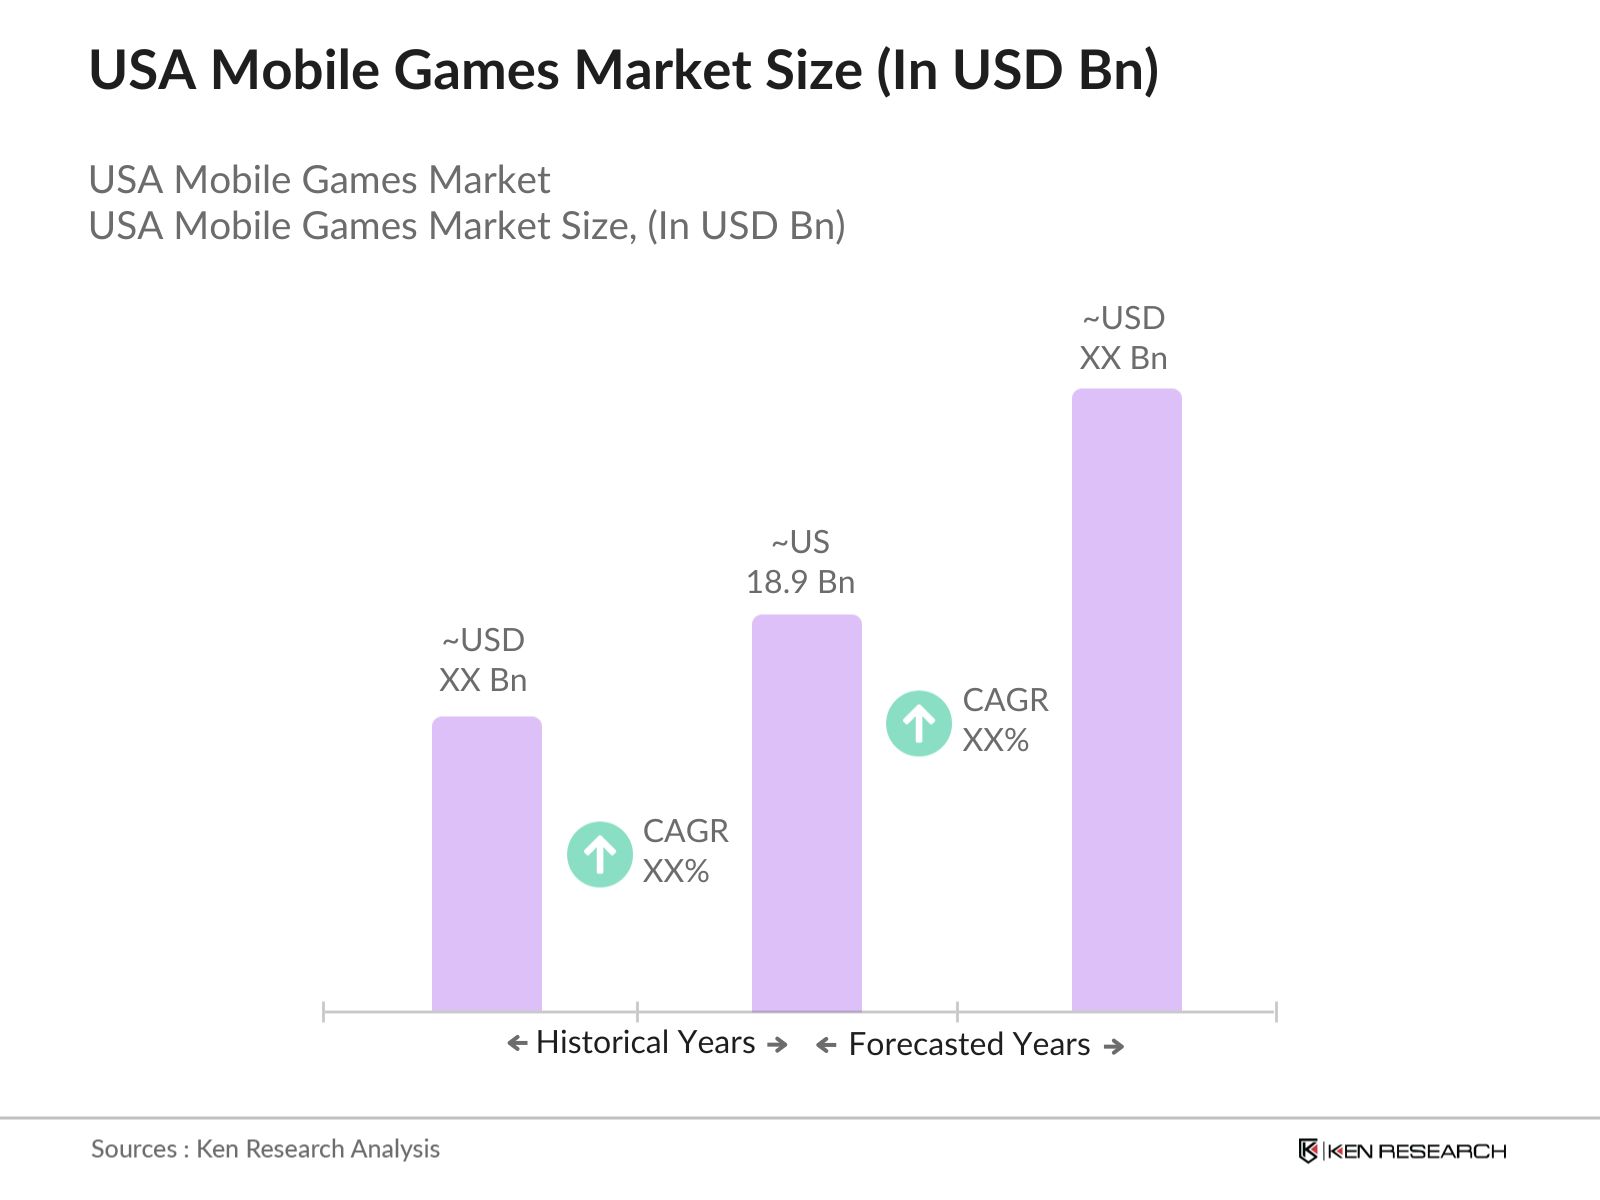
Over the next five years, the USA mobile games market is expected to experience substantial growth driven by the continuous improvement of mobile internet infrastructure, the evolution of cloud gaming services, and increased consumer demand for high-quality mobile gaming experiences. Innovations such as augmented reality (AR) and virtual reality (VR) integration in mobile games are likely to contribute to market expansion, further supported by rising investments from venture capitalists in mobile gaming startups. Additionally, the shift towards more complex and immersive mobile gaming experiences will open new monetization opportunities for game developers.
|
By Game Type |
Puzzle and Casual Games Action and Adventure Games Role-Playing Games (RPG) Strategy and Simulation Games Multiplayer Online Battle Arena (MOBA) |
|
By Revenue Model |
In-App Purchases Subscription-Based Games Ad-Supported Games Premium Paid Games |
|
By Platform |
iOS Android Cross-Platform |
|
By Age Group |
Children Teens Adults Senior Citizens |
|
By Region |
Northeast Midwest South West |
1.1. Definition and Scope
1.2. Market Taxonomy
1.3. Market Growth Rate
1.4. Market Segmentation Overview
2.1. Historical Market Size
2.2. Year-On-Year Growth Analysis
2.3. Key Market Developments and Milestones
3.1. Growth Drivers
3.1.1. Smartphone Penetration
3.1.2. Mobile Internet Infrastructure (4G, 5G Rollouts)
3.1.3. In-App Purchase Ecosystem
3.1.4. Increased Gaming Adoption Across Demographics
3.2. Market Challenges
3.2.1. Data Privacy and Security Concerns
3.2.2. High Development and Marketing Costs
3.2.3. Platform Fragmentation (iOS vs. Android)
3.3. Opportunities
3.3.1. Cloud Gaming Integration
3.3.2. Monetization Models (Freemium, Subscription Services)
3.3.3. Expansion into Emerging Markets
3.4. Trends
3.4.1. Augmented Reality (AR) and Virtual Reality (VR) Games
3.4.2. Cross-Platform Gaming Ecosystem
3.4.3. Esports and Competitive Mobile Gaming
3.5. Government Regulation
3.5.1. Data Protection Laws (GDPR, CCPA)
3.5.2. Age Restrictions and Parental Controls
3.5.3. Microtransaction Legislation
3.6. SWOT Analysis
3.7. Stakeholder Ecosystem
3.8. Porters Five Forces
3.9. Competition Ecosystem
4.1. By Game Type (In Value %)
4.1.1. Puzzle and Casual Games
4.1.2. Action and Adventure Games
4.1.3. Role-Playing Games (RPG)
4.1.4. Strategy and Simulation Games
4.1.5. Multiplayer Online Battle Arena (MOBA)
4.2. By Revenue Model (In Value %)
4.2.1. In-App Purchases
4.2.2. Subscription-Based Games
4.2.3. Ad-Supported Games
4.2.4. Premium Paid Games
4.3. By Platform (In Value %)
4.3.1. iOS
4.3.2. Android
4.3.3. Cross-Platform
4.4. By Age Group (In Value %)
4.4.1. Children
4.4.2. Teens
4.4.3. Adults
4.4.4. Senior Citizens
4.5. By Region (In Value %)
4.5.1. Northeast
4.5.2. Midwest
4.5.3. South
4.5.4. West
5.1. Detailed Profiles of Major Companies
5.1.1. Activision Blizzard
5.1.2. Electronic Arts
5.1.3. Supercell
5.1.4. Zynga
5.1.5. Glu Mobile
5.1.6. Niantic
5.1.7. Tencent Games
5.1.8. Rovio Entertainment
5.1.9. Gameloft
5.1.10. Netmarble
5.1.11. Scopely
5.1.12. Kabam
5.1.13. Playtika
5.1.14. Ubisoft Mobile
5.1.15. Jam City
5.2. Cross Comparison Parameters (Number of Active Users, Game Portfolio Size, Revenue Models, Geographic Reach, Market Share)
5.3. Market Share Analysis
5.4. Strategic Initiatives
5.5. Mergers and Acquisitions
5.6. Investment Analysis
5.7. Venture Capital Funding
5.8. Government Grants
5.9. Private Equity Investments
6.1. Mobile App Distribution Policies (Google Play, Apple App Store)
6.2. Compliance Requirements for In-App Purchases
6.3. Certification Processes for Game Age Ratings
7.1. Future Market Size Projections
7.2. Key Factors Driving Future Market Growth
8.1. By Game Type (In Value %)
8.2. By Revenue Model (In Value %)
8.3. By Platform (In Value %)
8.4. By Age Group (In Value %)
8.5. By Region (In Value %)
9.1. TAM/SAM/SOM Analysis
9.2. User Cohort Analysis
9.3. Monetization Strategy Recommendations
9.4. White Space Opportunity Analysis
The first step involves identifying the key stakeholders within the USA mobile games ecosystem, including developers, publishers, app platforms, and mobile network operators. Secondary research methods are used to gather data from public and proprietary databases, focusing on market dynamics and consumer behavior patterns.
This phase includes analyzing historical market data for mobile games, including user penetration, revenue from various monetization models, and the distribution channels for mobile games in the USA. The market construction is done based on qualitative and quantitative insights, ensuring data accuracy.
Hypotheses related to market growth drivers and challenges are validated through interviews with industry experts from leading mobile game development companies. These consultations help refine market assumptions and revenue models, contributing to a more accurate projection.
The final stage focuses on validating insights through additional interviews with stakeholders across the value chain, including mobile game publishers and app platform representatives. This synthesis ensures that the findings are accurate, comprehensive, and applicable to the USA mobile games market.
The USA mobile games market is valued at USD 18.9 billion, driven by high smartphone penetration, faster mobile internet speeds, and the growth of in-app purchase models.
Challenges in the USA mobile games market include rising competition among game developers, increasing user acquisition costs, and regulatory concerns around data privacy and microtransactions in mobile gaming.
Major players in the USA mobile games market include Activision Blizzard, Electronic Arts, Supercell, Zynga, and Tencent Games, all of which have established a strong presence through popular game titles and effective monetization strategies.
Growth drivers in the USA mobile games market include the widespread adoption of smartphones, advancements in mobile gaming technologies such as AR/VR, and increasing consumer spending on in-app purchases and subscriptions.
In the USA mobile games market Casual games dominate the market due to their accessibility and low barriers to entry, attracting a wide range of users across different age groups.
 Framework")
What makes us stand out is that our consultants follows Robust, Refine and Result (RRR) methodology. i.e. Robust for clear definitions, approaches and sanity checking, Refine for differentiating respondents facts and opinions and Result for presenting data with story

We have set a benchmark in the industry by offering our clients with syndicated and customized market research reports featuring coverage of entire market as well as meticulous research and analyst insights.

While we don't replace traditional research, we flip the method upside down. Our dual approach of Top Bottom & Bottom Top ensures quality deliverable by not just verifying company fundamentals but also looking at the sector and macroeconomic factors.

With one step in the future, our research team constantly tries to show you the bigger picture. We help with some of the tough questions you may encounter along the way: How is the industry positioned? Best marketing channel? KPI's of competitors? By aligning every element, we help maximize success.

Our report gives you instant access to the answers and sources that other companies might choose to hide. We elaborate each steps of research methodology we have used and showcase you the sample size to earn your trust.

If you need any support, we are here! We pride ourselves on universe strength, data quality, and quick, friendly, and professional service.