
USA Mobility On Demand Market Outlook to 2030
Region:North America
Author(s):Shambhavi
Product Code:KROD4937
December 2024
80
About the Report
USA Mobility On Demand Market Overview
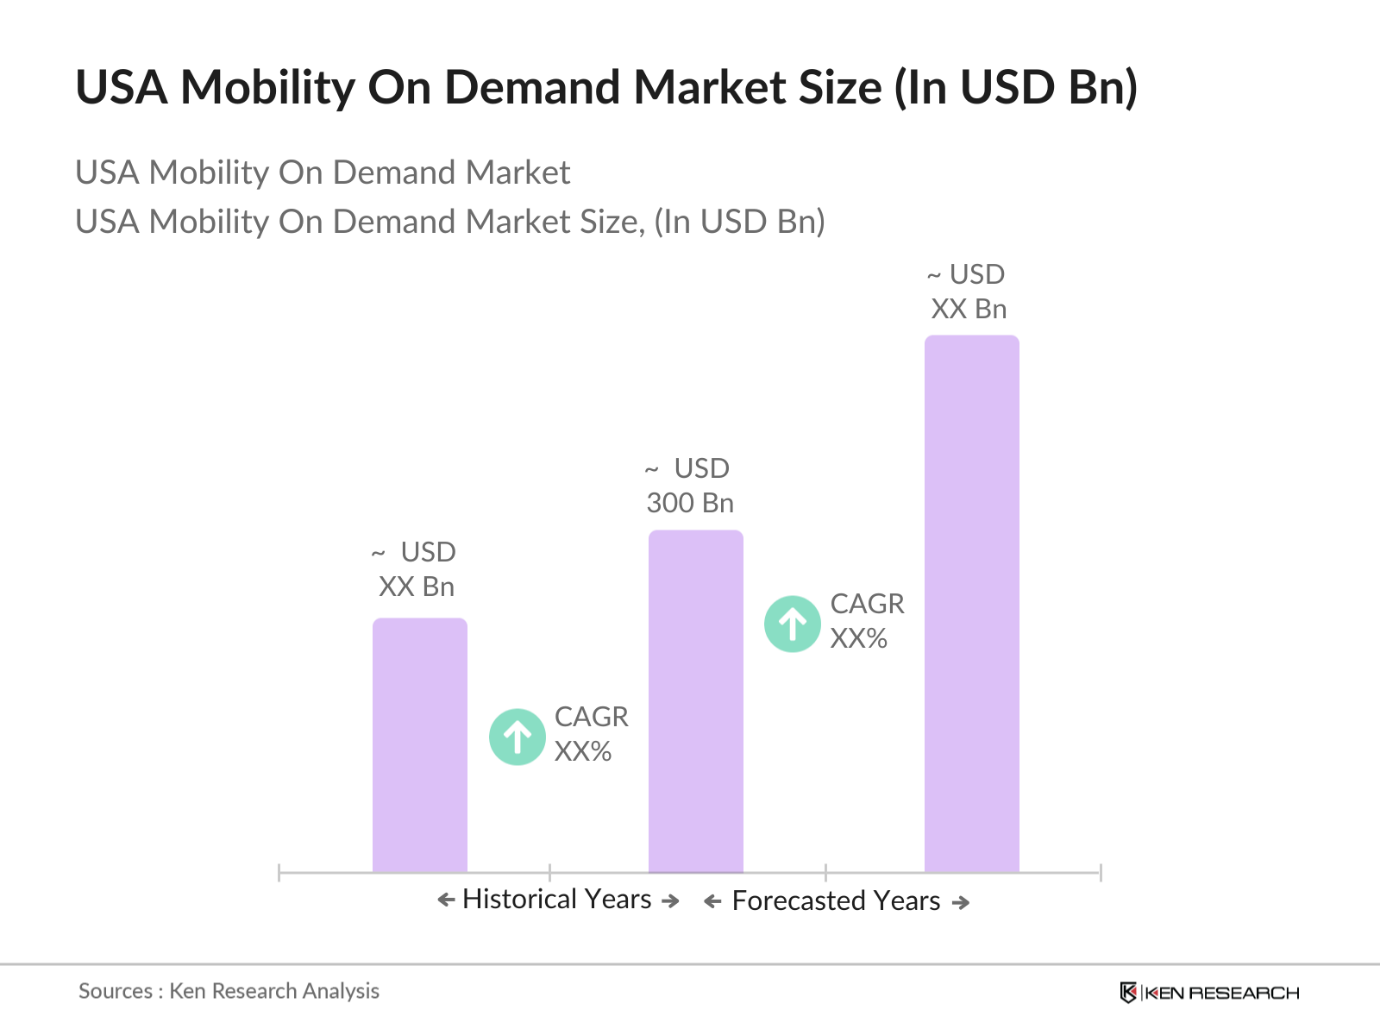
- The USA Mobility On Demand (MOD) market reached a value of USD 300 Billion in 2023, driven by increasing urbanization, a shift towards sustainable transportation, and the widespread adoption of smartphones and app-based services. The rapid growth of ride-hailing and car-sharing platforms has significantly contributed to the markets expansion.
- The USA MOD market is dominated by key players such as Uber Technologies Inc., Lyft, Inc., Via Transportation Inc., Zipcar, Inc., and Lime. These companies have established significant market presence through extensive networks, strategic partnerships, and continuous innovation. Uber and Lyft lead the market in ride-hailing services, while Zipcar and Lime have a strong foothold in car-sharing and micro-mobility services, respectively.
- In 2023, the U.S. Department of Transportation launched the "Mobility as a Service" (MaaS) initiative, aimed at integrating various forms of transportation services into a single accessible platform. This initiative encourages the collaboration between public and private transportation providers, including MOD services, to create seamless, efficient, and user-friendly transportation options. The MaaS initiative is expected to significantly impact the growth of the MOD market by enhancing the accessibility and convenience of these services across the country.
- Cities like New York, Los Angeles, and San Francisco dominate the USA MOD market due to their high population density, advanced infrastructure, and significant demand for flexible transportation options. New York City, in particular, is a key market for ride-hailing services, driven by the dense urban environment and the need for efficient, on-demand transportation.
USA Mobility On Demand Market Segmentation
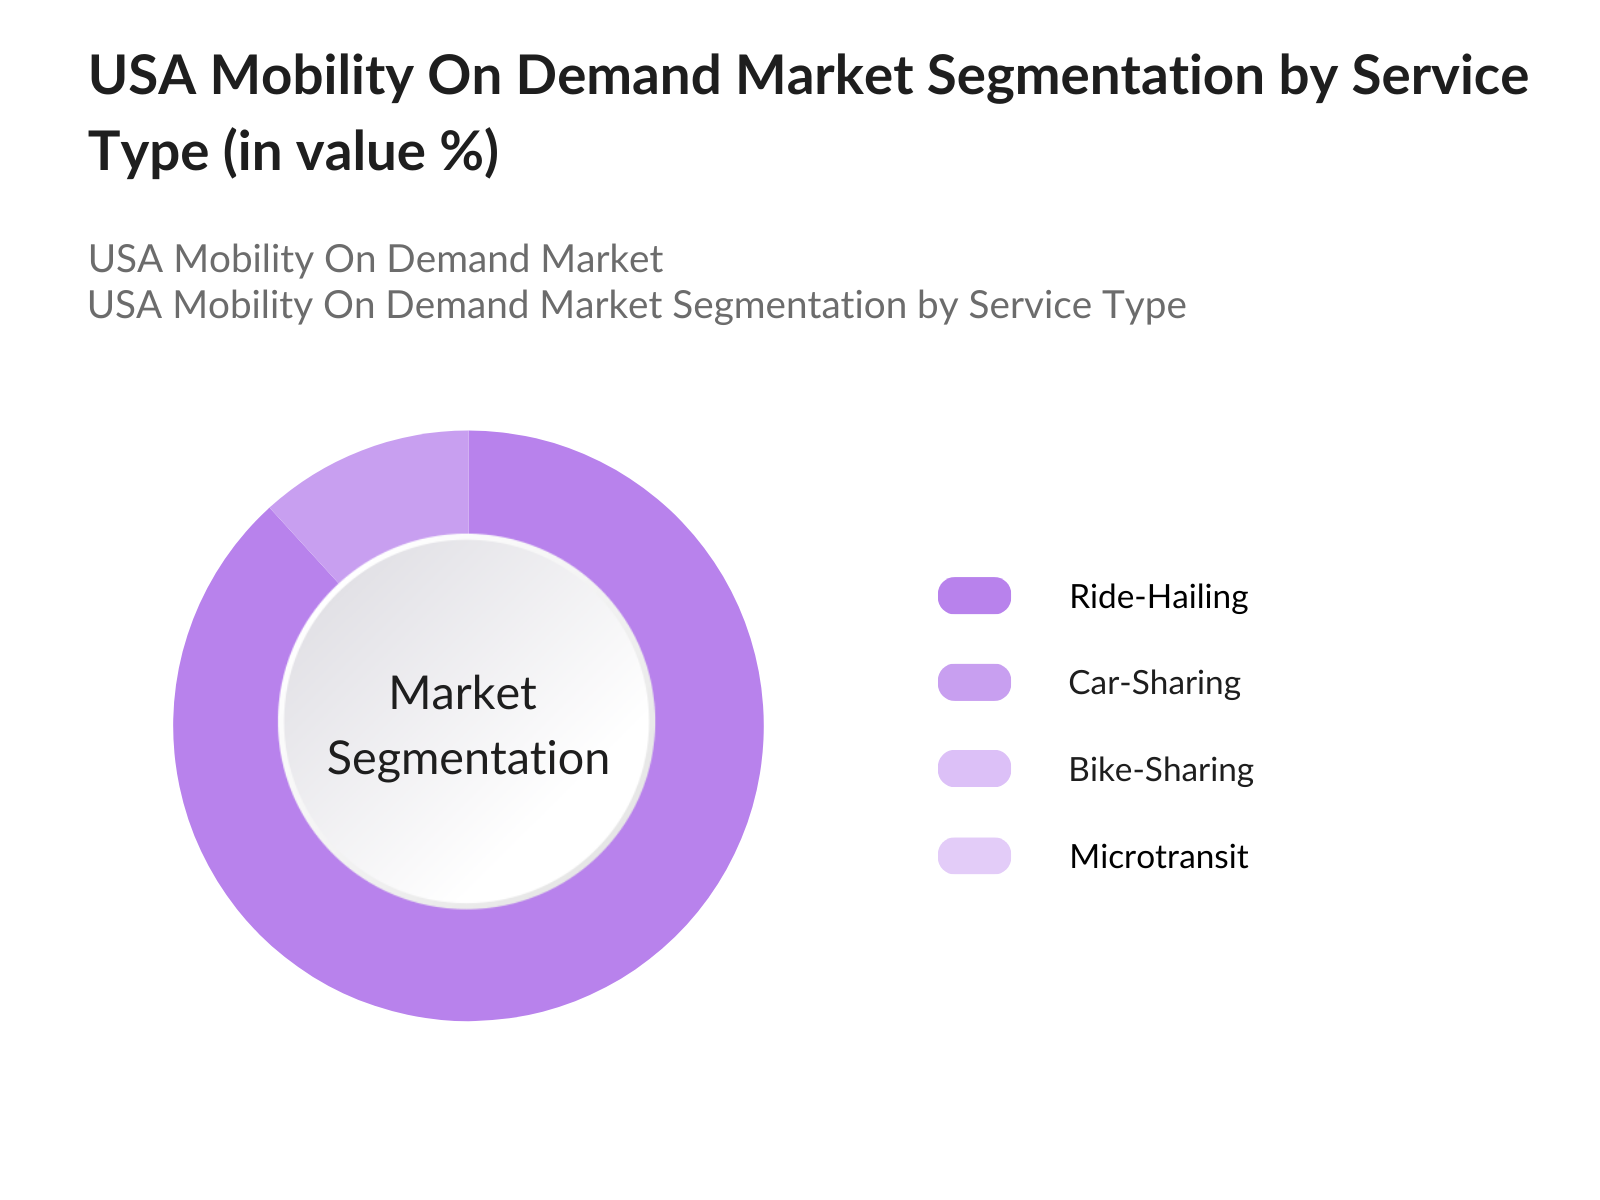
By Service Type: The USA Mobility On Demand market is segmented by service type into Ride-Hailing, Car-Sharing, Bike-Sharing, and Microtransit. In 2023, Ride-Hailing services held the dominant market share under the service type segmentation. This dominance is attributed to the widespread adoption of ride-hailing platforms like Uber and Lyft, which offer convenience, ease of use, and broad accessibility.
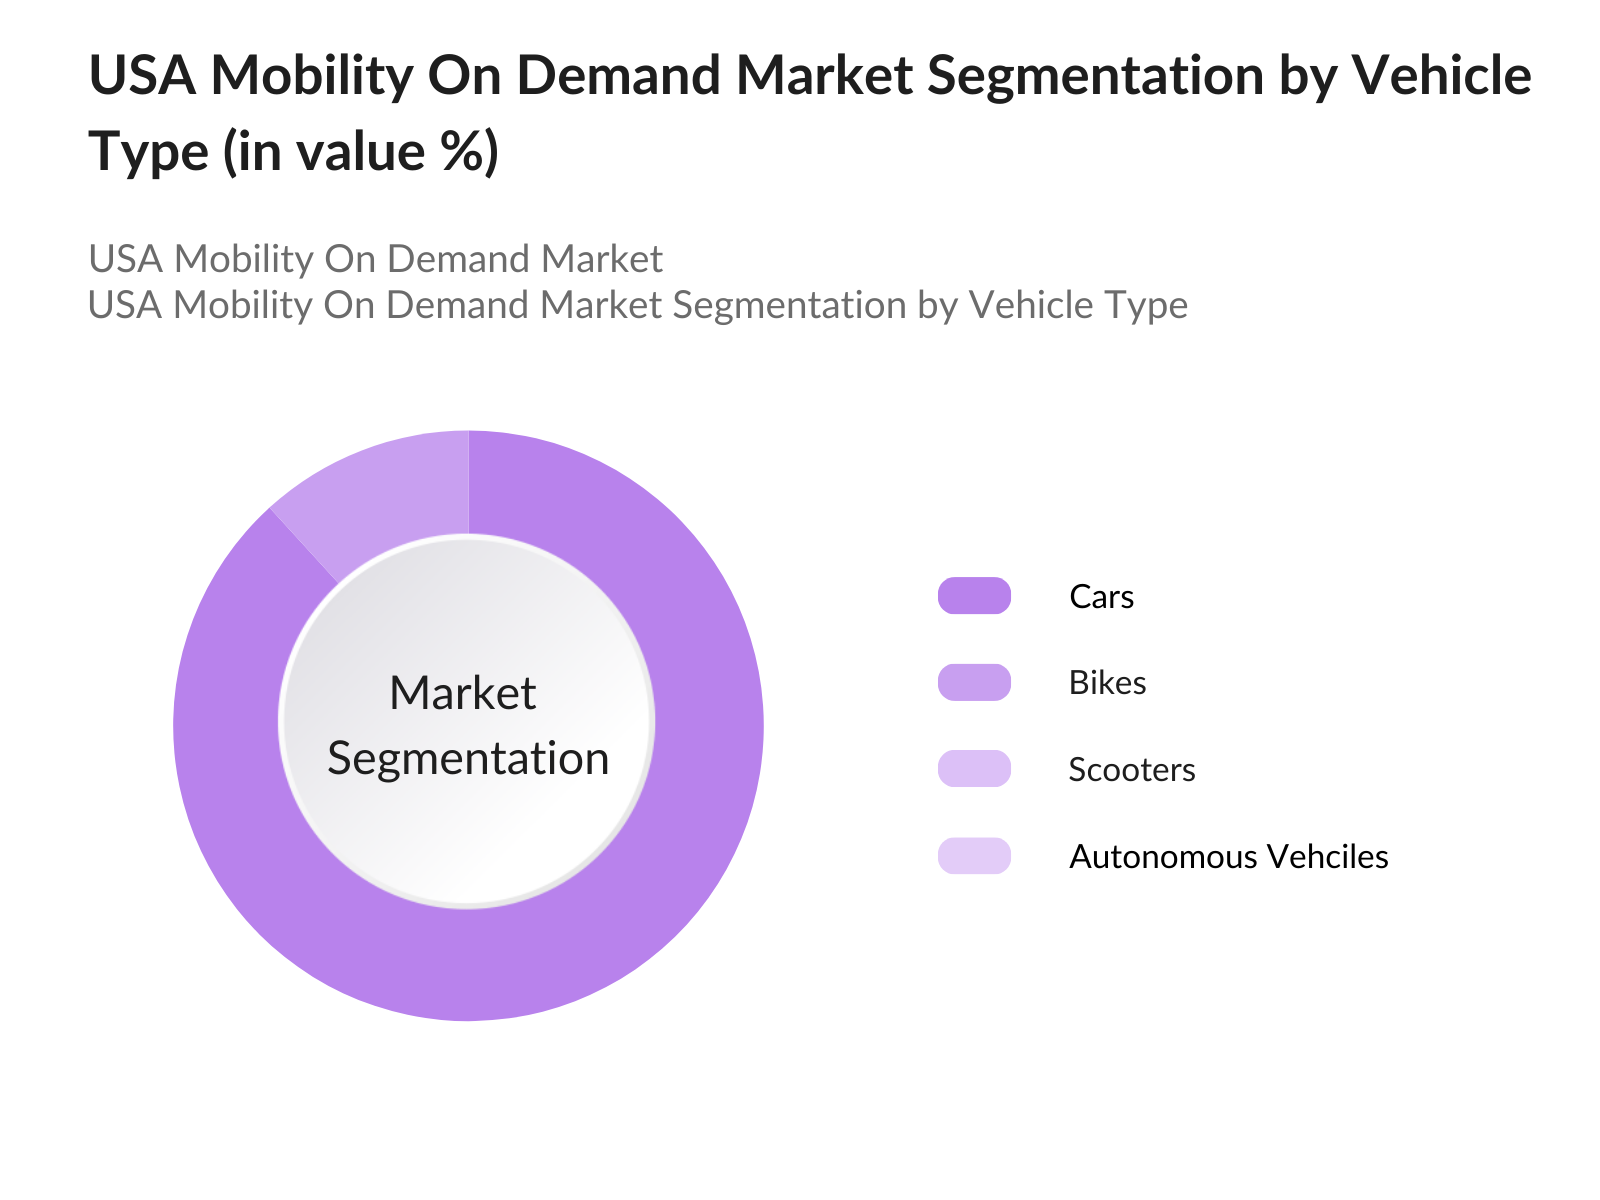
By Vehicle Type: The USA Mobility On Demand market is segmented by vehicle type into Cars, Bikes, Scooters, and Autonomous Vehicles. In 2023, Cars held the dominant market share in this segmentation. The dominance of cars is driven by the extensive use of ride-hailing and car-sharing services, which primarily rely on cars as the preferred mode of transportation. Additionally, the convenience, comfort, and familiarity associated with car-based services contribute to their continued popularity.
By Region: The USA Mobility On Demand market is segmented by region into Northeast, Midwest, South, and West. In 2023, the West region led the USA Mobility On Demand (MOD) market, driven by high demand for innovative transportation solutions and supported by a strong technology ecosystem and progressive environmental policies. The region benefits from substantial investments in infrastructure and a large urban population that increasingly favors MOD services over traditional car ownership, reinforcing its market dominance.
USA Mobility On Demand Market Competitive Landscape
|
Company Name |
Establishment Year |
Headquarters |
|
Uber Technologies Inc. |
2009 |
San Francisco, CA |
|
Lyft, Inc. |
2012 |
San Francisco, CA |
|
Via Transportation Inc. |
2012 |
New York, NY |
|
Zipcar, Inc. |
2000 |
Boston, MA |
|
Lime |
2017 |
San Francisco, CA |
- Uber Technologies Inc.: In 2024, Uber continued its aggressive expansion into the electric vehicle market, aiming to have over 25,000 EVs in its fleet by the end of the year. This initiative aligns with Ubers sustainability goals and is part of a broader effort to reduce its carbon footprint globally. Uber has invested in developing autonomous vehicle technology, with ongoing trials in select cities across the USA, marking a significant step towards the future of mobility.
- Lyft, Inc.: In 2023, Lyft expanded its service offerings by introducing a subscription-based model called "Lyft Pink," which provides users with discounted rides and other benefits. This move is part of Lyft's strategy to increase customer loyalty and retention by offering value-added services. Additionally, Lyft has been actively working on expanding its fleet of electric and hybrid vehicles, aiming to achieve 100% electric rides on its platform by 2030.
USA Mobility On Demand Market Analysis
USA Mobility On Demand Market Growth Drivers
- Rising Consumer Demand for Flexible Transportation Solutions: The USA Mobility On Demand (MOD) market has seen significant growth due to the increasing consumer preference for flexible and cost-effective transportation options. In 2024, 120 million Americans used MOD services at least once, reflecting a growing demand for alternatives to traditional car ownership. The convenience of ride-hailing, car-sharing, and micro-mobility services has driven this shift, especially in urban areas where personal vehicle ownership is less practical.
- Government Incentives for Electric Vehicles: The U.S. government's push towards electric vehicles (EVs) has been a significant growth driver for the MOD market. In 2023, the federal government announced tax credits of up to USD 7,500 for consumers purchasing new electric vehicles, which directly impacts the MOD market as companies like Uber and Lyft expand their electric fleets. State governments, such as California, have introduced rebates and grants to support the deployment of EVs in shared mobility services.
- Integration with Public Transportation Systems: The integration of MOD services with public transportation has been a key growth driver, particularly in metropolitan areas. In 2024, cities like New York and Chicago implemented Mobility-as-a-Service (MaaS) platforms that seamlessly connect ride-hailing, bike-sharing, and public transit options. This integration enhances the convenience and efficiency of urban mobility, encouraging more users to adopt MOD services. The growing collaboration between private MOD providers and public transit authorities is expected to drive further growth in the market by offering comprehensive and user-friendly transportation solutions.
USA Mobility On Demand Market Challenges
- Regulatory Hurdles and Compliance Costs: The MOD market faces significant challenges related to regulatory compliance, particularly at the state and municipal levels. In 2023, several cities, including New York and San Francisco, introduced stricter regulations on ride-hailing services, such as mandatory licensing, fare controls, and limitations on the number of vehicles allowed to operate. These regulations have increased operational costs for MOD companies, potentially limiting their ability to expand services and impacting profitability.
- Infrastructure Limitations in Rural Areas: While the MOD market has seen robust growth in urban centres, its expansion into rural areas remains constrained by limited infrastructure. In 2024, MOD services were available in rural regions, where the lack of digital connectivity and transportation infrastructure hampers the viability of these services. The absence of dedicated ride-hailing lanes, charging stations for electric vehicles, and reliable internet access poses significant challenges for MOD providers aiming to reach underserved populations.
USA Mobility On Demand Market Government Initiatives
- Mobility-as-a-Service (MaaS) Platform Development: In 2023, the U.S. Department of Transportation (DOT) launched an initiative to promote the development of Mobility-as-a-Service (MaaS) platforms across major U.S. cities. These platforms aim to integrate various modes of transportation, including ride-hailing, bike-sharing, and public transit, into a single digital interface. The DOT's investment in MaaS infrastructure is expected to enhance the efficiency of urban mobility and increase the adoption of MOD services by providing users with seamless access to a variety of transportation options through a unified app.
- National Infrastructure Investments for MOD Expansion: The Infrastructure Investment and Jobs Act of 2023 allocated USD 2 billion towards improving transportation infrastructure in support of MOD services. This funding is earmarked for the development of dedicated lanes for ride-hailing services, the expansion of bike-sharing networks, and the deployment of charging infrastructure for electric vehicles. These investments are expected to enhance the efficiency and reliability of MOD services, particularly in congested urban areas, thereby encouraging greater adoption of these services among the general population.
USA Mobility On Demand Future Market
Over the next five years, the USA MOD market is expected to see significant expansion. By 2028, MOD vehicles will be electric, driven by continued government incentives, rising fuel costs, and consumer preference for environmentally friendly transportation options. The shift towards EVs will be further supported by advancements in battery technology, leading to longer driving ranges and reduced charging times, making EVs more viable for MOD services.
Future Trends
- Increased Integration of Autonomous Vehicles: Autonomous vehicles (AVs) are anticipated to play a larger role in the MOD market by 2028. As AV technology matures, MOD providers are likely to deploy self-driving cars in select urban areas, particularly for ride-hailing and car-sharing services. The integration of AVs will reduce operational costs associated with drivers and increase service availability. Additionally, AVs are expected to improve safety and efficiency in urban mobility, offering a competitive advantage to early adopters in the MOD market.
- Growth of Multi-Modal Transportation Platforms: The future of the USA MOD market will be characterized by the rise of multi-modal transportation platforms that integrate various forms of transportation, including ride-hailing, bike-sharing, and public transit. By 2028, these platforms are expected to become the norm in major U.S. cities, offering users a seamless and convenient way to plan and pay for their journeys. The adoption of Mobility-as-a-Service (MaaS) models will be driven by advancements in digital technology and increasing consumer demand for integrated mobility solutions that reduce reliance on personal vehicles.
Scope of the Report
|
By Service Type |
Ride-Hailing Car-Sharing Bike-Sharing Microtransit |
|
By Vehicle Type |
Cars Bikes Scooters Autonomous Vehicles |
|
By Region |
West Northeast South Midwest |
Products
Key Target Audience Organizations and Entities Who Can Benefit by Subscribing This Report:
Mobility Service Providers
Automotive Manufacturers
Technology Providers (e.g., IoT, AI Solutions)
Urban Planning and Infrastructure Development Agencies
Environmental Advocacy Groups
Public Transit Authorities
Investors and Venture Capitalist Firms
Government and Regulatory Bodies (e.g., U.S. Department of Transportation)
Time Period Captured in the Report:
Historical Period: 2018-2023
Base Year: 2023
Forecast Period: 2023-2028
Companies
Players Mentioned in the Report:
Uber Technologies Inc.
Lyft, Inc.
Via Transportation Inc.
Zipcar, Inc.
Lime
Bird Rides, Inc.
Spin (a Ford company)
Getaround
Turo Inc.
Curb Mobility
JUMP Bikes (owned by Uber)
Revel Transit
GIG Car Share (owned by AAA)
BlueLA (owned by Blink Mobility)
Wheels (owned by Helbiz)
Table of Contents
1. USA Mobility On Demand Market Overview
1.1. Definition and Scope
1.2. Market Taxonomy
1.3. Market Growth Rate
1.4. Market Segmentation Overview
2. USA Mobility On Demand Market Size (in USD Bn), 2018-2023
2.1. Historical Market Size
2.2. Year-on-Year Growth Analysis
2.3. Key Market Developments and Milestones
3. USA Mobility On Demand Market Analysis
3.1. Growth Drivers
3.1.1. Urbanization and Increased Population Density
3.1.2. Technological Advancements
3.1.3. Shift Towards Sustainable Transportation
3.1.4. Increased Smartphone Penetration
3.2. Restraints
3.2.1. Regulatory Challenges
3.2.2. High Operational Costs
3.2.3. Limited Infrastructure in Rural Areas
3.3. Opportunities
3.3.1. Expansion into Underserved Markets
3.3.2. Integration with Public Transportation Systems
3.3.3. Development of Autonomous Mobility Solutions
3.4. Trends
3.4.1. Rise of Ride-Sharing Platforms
3.4.2. Subscription-Based Mobility Services
3.4.3. Use of Artificial Intelligence for Route Optimization
3.5. Government Regulation
3.5.1. Mobility-as-a-Service (MaaS) Initiatives
3.5.2. Incentives for Electric Vehicles
3.5.3. Data Privacy and Security Regulations
3.5.4. Infrastructure Investments
3.6. SWOT Analysis
3.7. Stakeholder Ecosystem
3.8. Competition Ecosystem
4. USA Mobility On Demand Market Segmentation, 2023
4.1. By Service Type (in Value %)
4.1.1. Ride-Hailing
4.1.2. Car-Sharing
4.1.3. Bike-Sharing
4.1.4. Microtransit
4.2. By Vehicle Type (in Value %)
4.2.1. Cars
4.2.2. Bikes
4.2.3. Scooters
4.2.4. Autonomous Vehicles
4.3. By Technology (in Value %)
4.3.1. App-Based Services
4.3.2. Cloud-Based Platforms
4.3.3. IoT-Enabled Vehicles
4.4. By End-User (in Value %)
4.4.1. Individual Consumers
4.4.2. Corporate Users
4.4.3. Public Sector
4.5. By Region (in Value %)
4.5.1. Northeast
4.5.2. Midwest
4.5.3. South
4.5.4. West
5. USA Mobility On Demand Market Cross Comparison
5.1. Detailed Profiles of Major Companies
5.1.1. Uber Technologies Inc.
5.1.2. Lyft, Inc.
5.1.3. Via Transportation Inc.
5.1.4. Zipcar, Inc.
5.1.5. Lime
5.1.6. Bird Rides, Inc.
5.1.7. Getaround
5.1.8. Turo Inc.
5.1.9. Spin (a Ford company)
5.1.10. Curb Mobility
5.2. Cross Comparison Parameters (No. of Employees, Headquarters, Inception Year, Revenue)
6. USA Mobility On Demand Market Competitive Landscape
6.1. Market Share Analysis
6.2. Strategic Initiatives
6.3. Mergers and Acquisitions
6.4. Investment Analysis
6.4.1. Venture Capital Funding
6.4.2. Government Grants
6.4.3. Private Equity Investments
7. USA Mobility On Demand Market Regulatory Framework
7.1. Transportation Standards
7.2. Compliance Requirements
7.3. Certification Processes
8. USA Mobility On Demand Future Market Size (in USD Bn), 2023-2028
8.1. Future Market Size Projections
8.2. Key Factors Driving Future Market Growth
9. USA Mobility On Demand Future Market Segmentation, 2028
9.1. By Service Type (in Value %)
9.2. By Vehicle Type (in Value %)
9.3. By Technology (in Value %)
9.4. By End-User (in Value %)
9.5. By Region (in Value %)
10. USA Mobility On Demand Market Analysts Recommendations
10.1. TAM/SAM/SOM Analysis
10.2. Customer Cohort Analysis
10.3. Marketing Initiatives
10.4. White Space Opportunity Analysis
Disclaimer
Contact Us
Research Methodology
Step 01 Identifying Key Variables:
Ecosystem creation for all the major entities and referring to multiple secondary and proprietary databases to perform desk research around the market to collate industry-level information.
Step 02 Market Building:
Collating statistics on the USA Mobility On Demand Market over the years, penetration of marketplaces and service providers ratio to compute revenue generated in Mobility On Demand Market. We will also review service quality statistics to understand revenue generated which can ensure accuracy behind the data points shared.
Step 03 Validating and Finalizing:
Building market hypotheses and conducting CATIs with industry experts belonging to different companies to validate statistics and seek operational and financial information from company representatives.
Step 04 Research Output:
Our team will approach multiple Mobility On Demand companies and understand nature of product segments and sales, consumer preference and other parameters, which will support us validate statistics derived through bottom to top approach from Mobility On Demand companies.
Frequently Asked Questions
1. How big is the USA Mobility On Demand market?
The USA Mobility On Demand market was valued at USD 300 billion in 2023, driven by increasing urbanization, a shift towards sustainable transportation, and widespread adoption of app-based services.
2. What are the challenges in the USA Mobility On Demand market?
Challenges in USA Mobility On Demand market include regulatory hurdles across states, high operational costs, and infrastructure limitations in rural areas. These factors collectively impact the profitability and expansion capabilities of MOD providers.
3. Who are the major players in the USA Mobility On Demand market?
Key players in the USA Mobility On Demand market include Uber Technologies Inc., Lyft, Inc., Via Transportation Inc., Zipcar, Inc., and Lime. These companies lead due to their innovative platforms, extensive service networks, and strategic partnerships.
4. What are the growth drivers of the USA Mobility On Demand market?
The USA Mobility On Demand market is driven by the rising demand for flexible transportation solutions, government incentives for electric vehicle adoption, and the integration of Mobility-as-a-Service (MaaS) platforms in urban areas.
Why Buy From Us?
 Framework")
What makes us stand out is that our consultants follows Robust, Refine and Result (RRR) methodology. i.e. Robust for clear definitions, approaches and sanity checking, Refine for differentiating respondents facts and opinions and Result for presenting data with story

We have set a benchmark in the industry by offering our clients with syndicated and customized market research reports featuring coverage of entire market as well as meticulous research and analyst insights.

While we don't replace traditional research, we flip the method upside down. Our dual approach of Top Bottom & Bottom Top ensures quality deliverable by not just verifying company fundamentals but also looking at the sector and macroeconomic factors.

With one step in the future, our research team constantly tries to show you the bigger picture. We help with some of the tough questions you may encounter along the way: How is the industry positioned? Best marketing channel? KPI's of competitors? By aligning every element, we help maximize success.

Our report gives you instant access to the answers and sources that other companies might choose to hide. We elaborate each steps of research methodology we have used and showcase you the sample size to earn your trust.

If you need any support, we are here! We pride ourselves on universe strength, data quality, and quick, friendly, and professional service.