


USA Natural Cosmetics Market Outlook to 2030
Region:North America
Author(s):Vijay Kumar
Product Code:KROD6369
November 2024
97
About the Report
USA Natural Cosmetics Market Overview
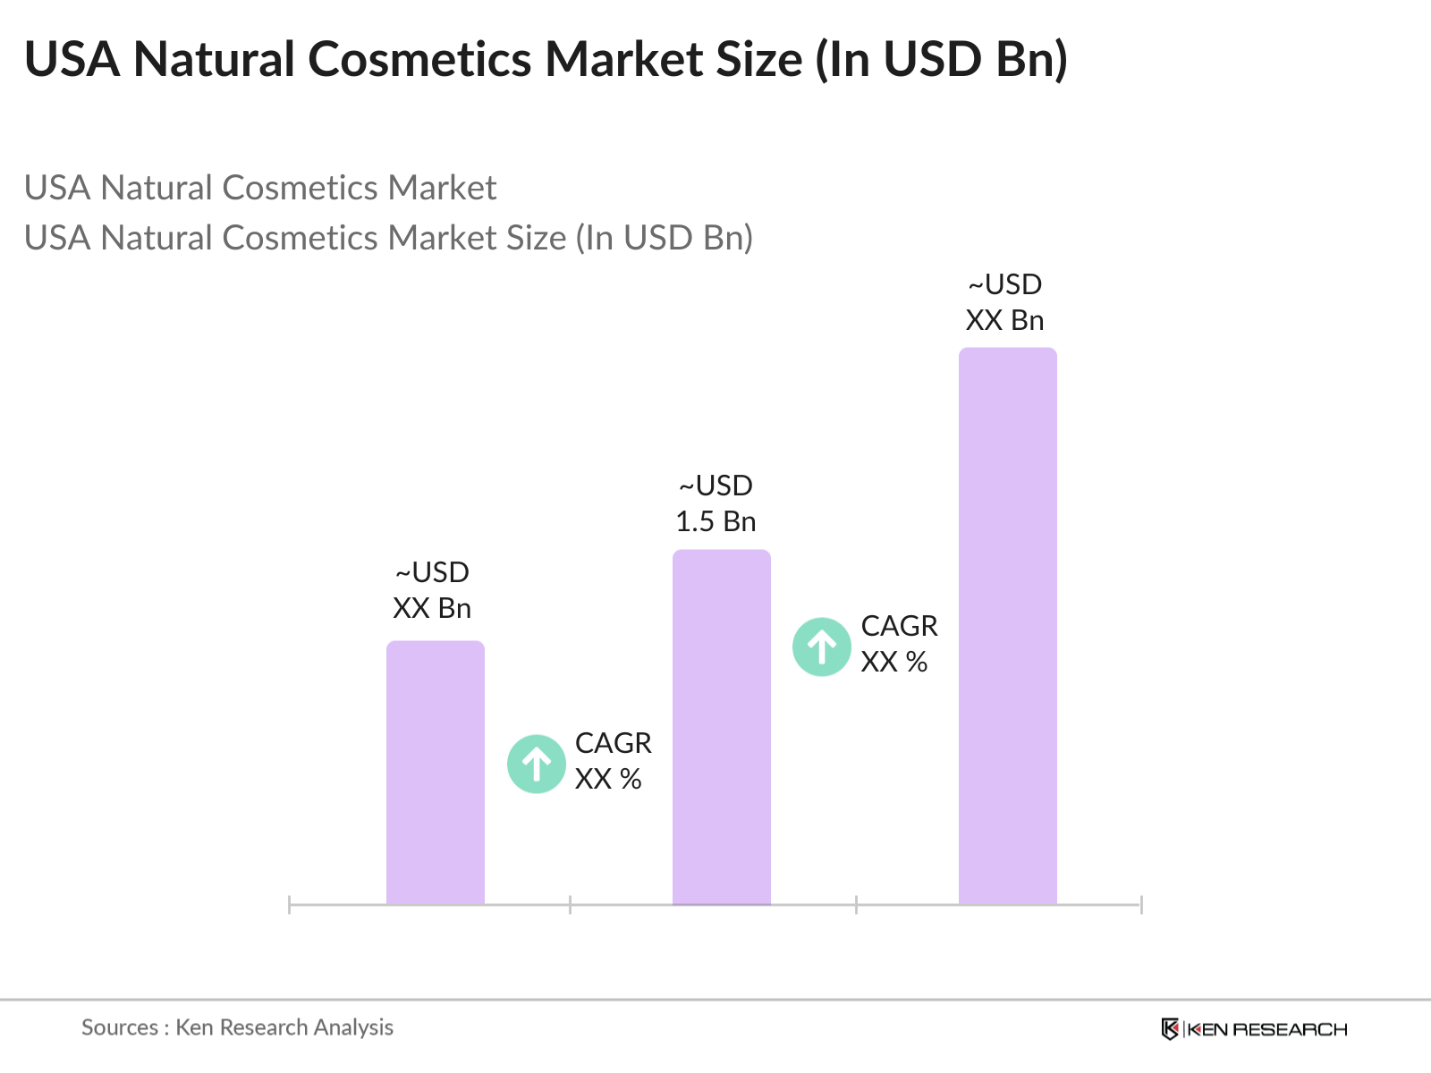
- The USA Natural Cosmetics market is valued at USD 1.5 billion, based on a five-year historical analysis. This market is primarily driven by increasing consumer awareness about the harmful effects of synthetic ingredients and the rising preference for organic, cruelty-free, and environmentally sustainable products. With the growing demand for natural formulations in skincare, hair care, and make-up, the market is also benefiting from innovations in clean beauty and the expansion of e-commerce platforms.
- Dominant cities in this market include New York, Los Angeles, and San Francisco. These cities lead the market primarily due to a higher concentration of environmentally conscious consumers, strong demand for premium and clean beauty products, and the presence of numerous boutique and independent natural cosmetics brands. The West Coast, in particular, is home to a significant number of innovative companies that emphasize sustainability, further driving regional growth.
- The FDA has stringent guidelines regarding the labeling of "natural" and "organic" products, which significantly impact cosmetics manufacturers. In 2023, the FDA issued over 200 warning letters to cosmetic companies for mislabeling products as "organic" without meeting USDA certification standards. This regulatory scrutiny ensures that only genuinely natural products are labeled accordingly, protecting consumer trust and market integrity.
USA Natural Cosmetics Market Segmentation
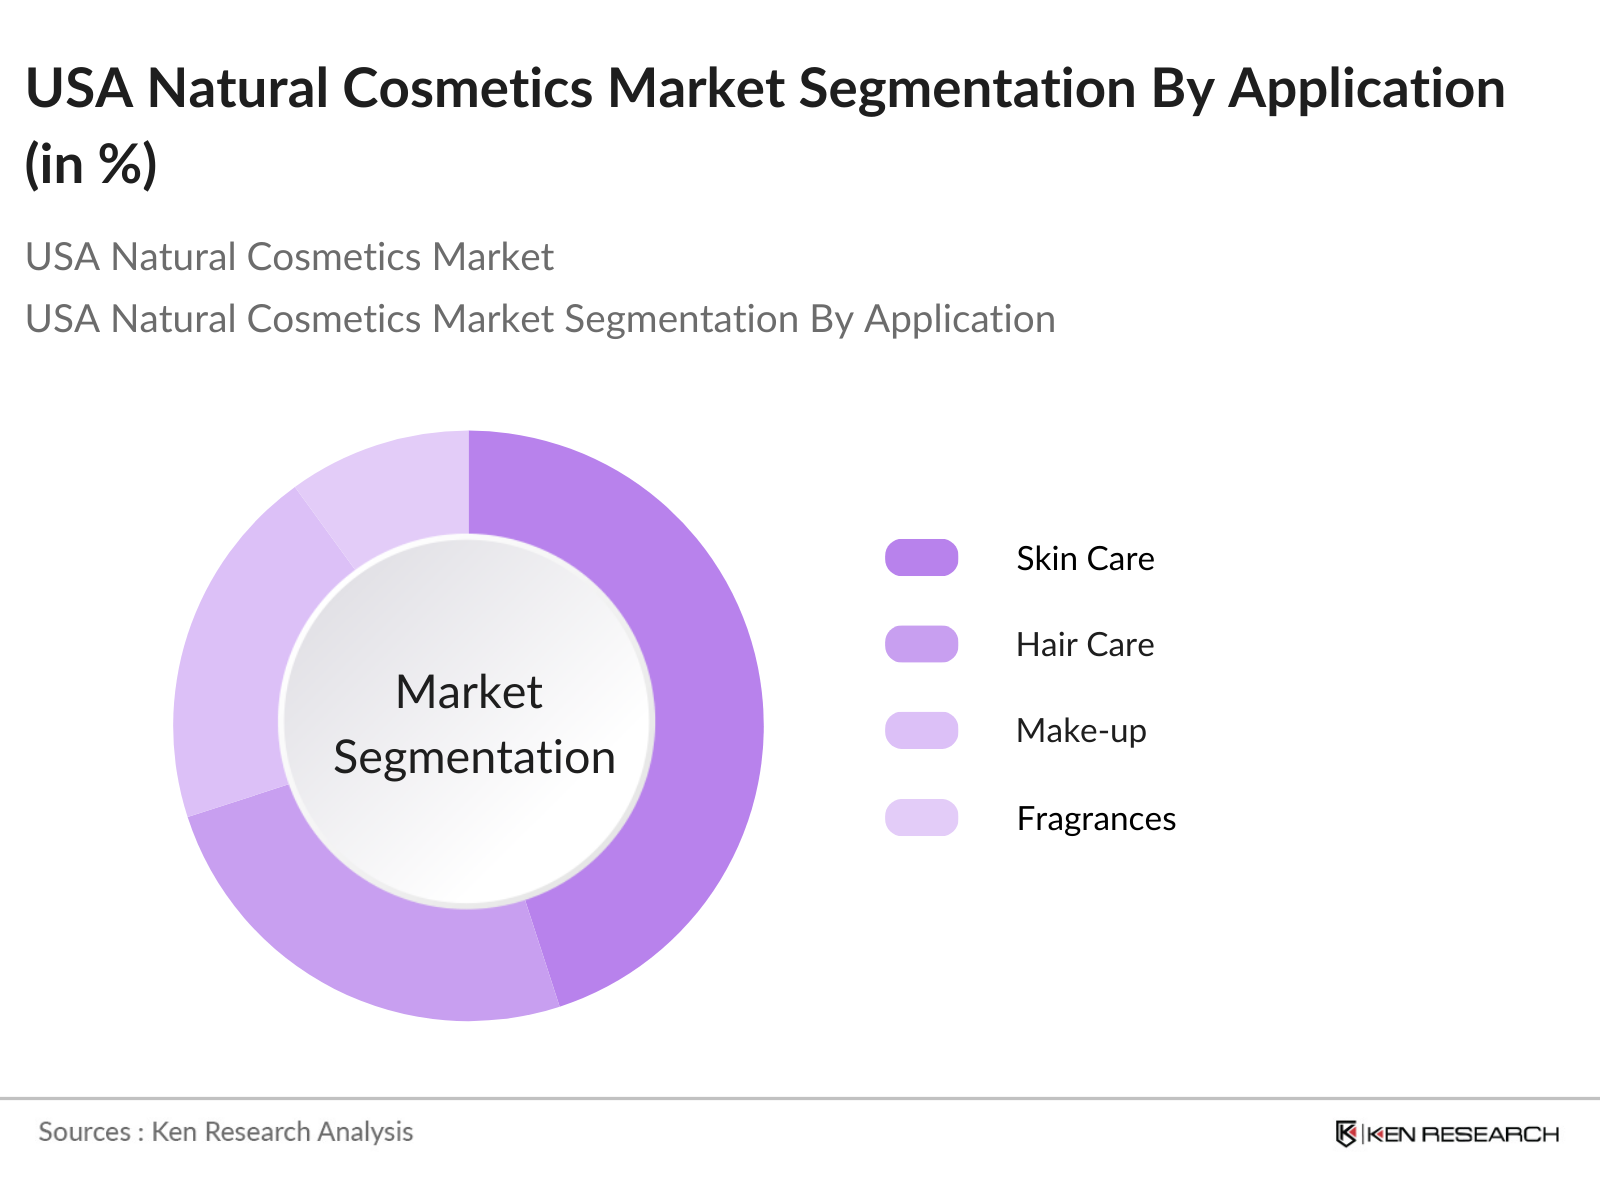
By Product Type: The USA Natural Cosmetics market is segmented by product type into skin care, hair care, make-up, fragrances, and oral care. Among these, skin care dominates the market share. The popularity of natural and organic skincare products has surged, fueled by growing concerns about synthetic chemicals in conventional products and the rising trend of clean beauty. Brands that focus on organic, plant-based ingredients such as shea butter, coconut oil, and aloe vera have seen significant success.
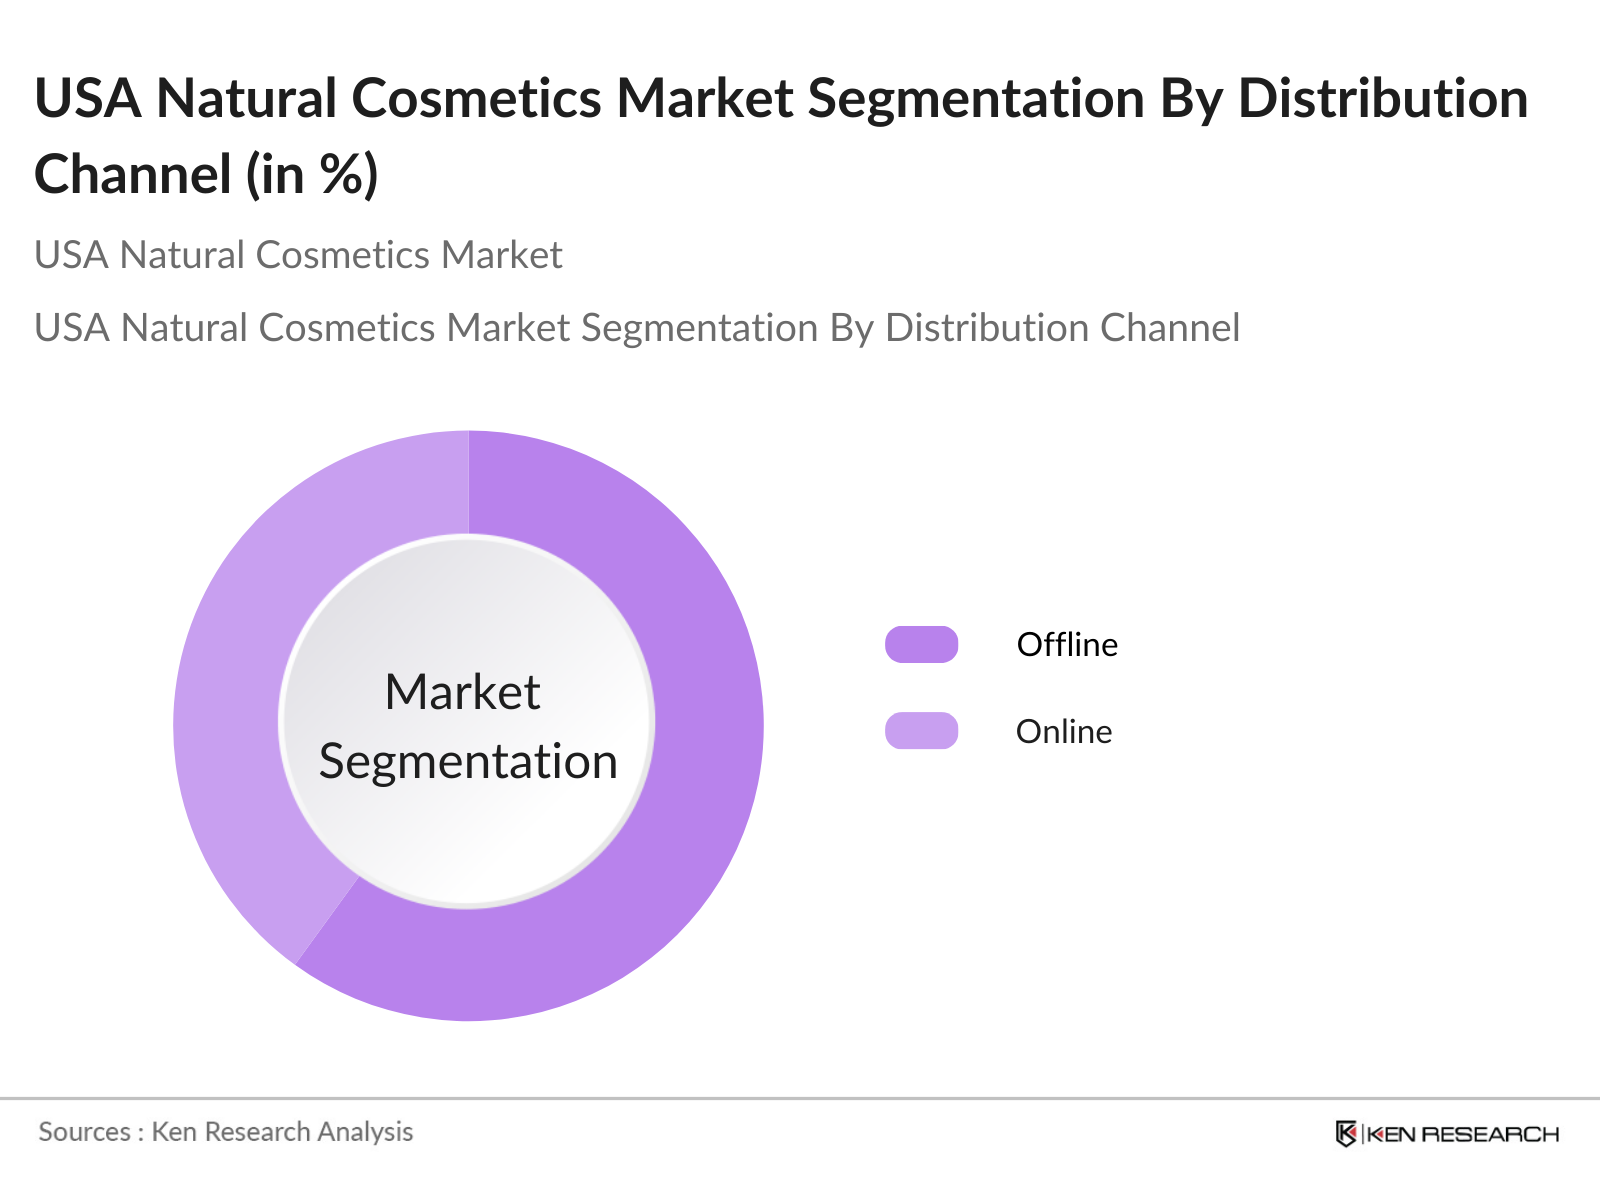
By Distribution Channel: The USA Natural Cosmetics market is also segmented by distribution channel into offline (specialty stores, supermarkets/hypermarkets, pharmacies) and online. The online segment has shown the most rapid growth in recent years, owing to the ease of access and convenience it provides to consumers. With platforms like Amazon, Sephora, and brand-specific e-commerce websites becoming popular, the online channel has become crucial for reaching a wider audience.
USA Natural Cosmetics Market Competitive Landscape
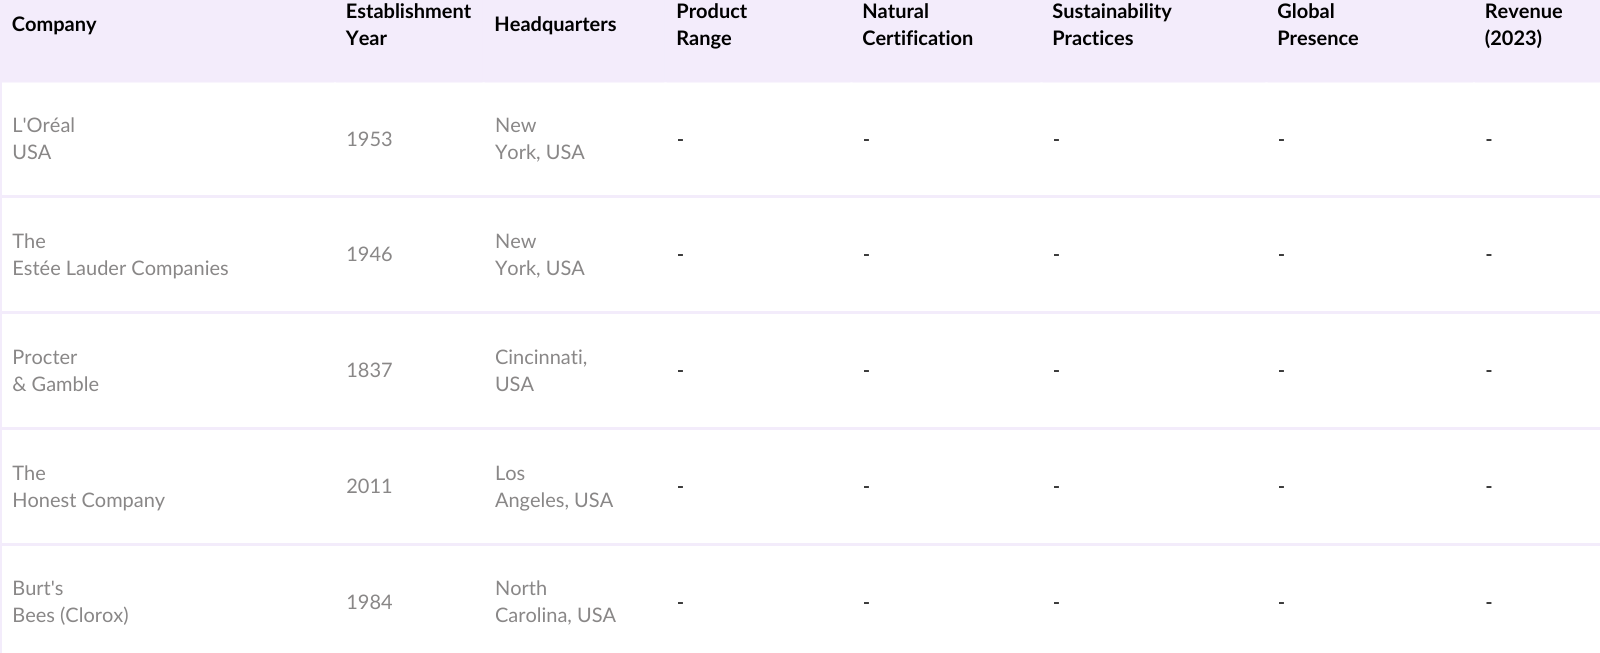
The USA Natural Cosmetics market is dominated by a few major players, with significant contributions from both global and local brands. This competition reflects the increasing consolidation of the market, where established companies continue to innovate with natural formulations while newer, indie brands carve out their niche by focusing on transparency and sustainability.
USA Natural Cosmetics Industry Analysis
Growth Drivers
- Increasing Consumer Demand for Natural Ingredients: The growing preference for natural and chemical-free products in the U.S. has seen a surge in demand for cosmetics made from botanical and plant-based ingredients. Data from the USDA show that the organic sector grew to $67.9 billion in 2023, reflecting increasing consumer demand for natural products across categories. A significant portion of this is attributed to the cosmetics sector, driven by consumer health consciousness and the desire for transparent ingredient sourcing.
- Rising Health and Environmental Consciousness: The focus on sustainability and health has heightened consumer awareness regarding harmful chemicals in cosmetics. The U.S. Environmental Protection Agency reported that Americans spent over $700 billion on sustainable products in 2023, with natural cosmetics playing a key role. The surge is linked to higher awareness of the environmental and health impact of synthetic products. Furthermore, state initiatives in California and New York aimed at banning toxic ingredients in beauty products reflect the regulatory push toward safer, greener cosmetics.
- Growing Preference for Cruelty-Free and Vegan Products: In 2023, the U.S. witnessed a 40% increase in the number of cruelty-free and vegan product launches, driven by the ethical choices of millennial and Gen Z consumers, according to data from the USDA and animal welfare organizations. This reflects the rising demand for non-animal-tested and vegan-certified products. Government regulations, like the Humane Cosmetics Act, have bolstered this trend, with states like California leading the charge by banning animal testing on cosmetics.
Market Challenges
- High Cost of Natural Ingredients: The production of natural cosmetics remains cost-intensive, primarily due to the higher price of organic raw materials. Data from the USDA Organic Price Index indicates that the average cost of organic ingredients, such as essential oils and plant extracts, rose by 15% from 2022 to 2024, leading to narrower profit margins for manufacturers. With consumers demanding cleaner ingredients, this challenge becomes more pronounced, particularly for small and medium-sized enterprises. USDA.
- Strict Regulatory Approvals for Organic Certification: Complying with stringent U.S. organic certification standards, governed by the USDA and FDA, poses a significant challenge for manufacturers. Organic certification involves rigorous testing and adherence to specific farming and production methods, often leading to longer approval timelines. In 2024, the USDA noted that the organic certification process could take up to 18 months, creating hurdles for new market entrants and increasing the cost burden on producers.
USA Natural Cosmetics Market Future Outlook
Over the next five years, the USA Natural Cosmetics market is expected to experience substantial growth driven by increasing consumer awareness, advances in product formulation, and a rise in disposable incomes. The shift towards sustainable practices, organic certifications, and natural ingredient sourcing will continue to influence purchasing decisions. Additionally, growth in the online retail sector and advancements in personalized beauty products are projected to further expand the market.
Market Opportunities
- Innovations in Sustainable Packaging: Sustainable packaging is gaining momentum in the cosmetics sector as companies strive to reduce their carbon footprints. In 2023, the U.S. Department of Commerce reported that 70% of cosmetic brands in the U.S. had adopted eco-friendly packaging solutions, driven by consumer demand for sustainability. This shift presents an opportunity for companies to differentiate themselves and appeal to eco-conscious buyers.
- Expansion into Emerging Markets: As global trade continues to evolve; U.S. natural cosmetics companies are expanding into emerging markets. The U.S. International Trade Commission (USITC) reported a 25% increase in natural cosmetic exports to Latin America and Southeast Asia in 2023, as demand for natural products in these regions rises. This represents a key opportunity for U.S. brands to capitalize on international growth, aided by favorable trade agreements and lower tariffs on organic goods.
Scope of the Report
|
By Product Type |
Skin Care Hair Care Make-up Fragrances Oral Care |
|
By Distribution Channel |
Offline (Specialty Stores, Supermarkets/Hypermarkets, Pharmacies) Online |
|
By End-User |
Women Men Children |
|
By Ingredient Type |
Plant-based Mineral-based Animal-derived Synthetic-free Certified Organic |
|
By Region |
North East South East Midwest West Coast Central |
Products
Key Target Audience
Natural Cosmetics Manufacturers
Retailers (Specialty Stores, Supermarkets/Hypermarkets)
E-Commerce Platforms
Ingredient Suppliers
Investors and Venture Capitalist Firms
Government and Regulatory Bodies (FDA, USDA)
Organic Certification Bodies
Packaging and Logistics Providers
Companies
Players Mentioned in the Report
L'Oral USA
The Este Lauder Companies
Procter & Gamble
The Honest Company
Burt's Bees (Clorox)
Coty Inc.
Unilever USA
Johnson & Johnson
Weleda
Tatcha LLC
Table of Contents
1. USA Natural Cosmetics Market Overview
1.1. Definition and Scope
1.2. Market Taxonomy
1.3. Market Growth Rate
1.4. Market Segmentation Overview
2. USA Natural Cosmetics Market Size (In USD Billion)
2.1. Historical Market Size
2.2. Year-On-Year Growth Analysis
2.3. Key Market Developments and Milestones
3. USA Natural Cosmetics Market Analysis
3.1. Growth Drivers
3.1.1. Increasing Consumer Demand for Natural Ingredients
3.1.2. Rising Health and Environmental Consciousness
3.1.3. Growing Preference for Cruelty-Free and Vegan Products
3.1.4. Expanding Online Retail Channels
3.2. Market Challenges
3.2.1. High Cost of Natural Ingredients
3.2.2. Strict Regulatory Approvals for Organic Certification
3.2.3. Limited Shelf Life of Natural Products
3.2.4. Brand Proliferation Leading to Market Fragmentation
3.3. Opportunities
3.3.1. Innovations in Sustainable Packaging
3.3.2. Expansion into Emerging Markets
3.3.3. Introduction of Personalized Natural Cosmetics
3.3.4. Growth of E-commerce and Direct-to-Consumer (DTC) Sales
3.4. Trends
3.4.1. Use of Plant-Based Ingredients
3.4.2. Demand for Multi-functional Natural Products
3.4.3. Increasing Popularity of Clean Beauty
3.4.4. Rise of Indie Brands
3.5. Government Regulations
3.5.1. FDA Standards on Organic and Natural Labels
3.5.2. Regulations on Synthetic-Free and Non-Toxic Ingredients
3.5.3. Compliance with Global Organic Cosmetic Standards
3.5.4. Trade Tariffs and Impact on Imported Raw Materials
3.6. SWOT Analysis
3.7. Stakeholder Ecosystem (Suppliers, Manufacturers, Distributors, Retailers)
3.8. Porters Five Forces Analysis
3.9. Competition Ecosystem (Competitive Intensity, Bargaining Power of Suppliers and Buyers)
4. USA Natural Cosmetics Market Segmentation
4.1. By Product Type (In Value %)
4.1.1. Skin Care
4.1.2. Hair Care
4.1.3. Make-up
4.1.4. Fragrances
4.1.5. Oral Care
4.2. By Distribution Channel (In Value %)
4.2.1. Offline (Specialty Stores, Supermarkets/Hypermarkets, Pharmacies)
4.2.2. Online
4.3. By End-User (In Value %)
4.3.1. Women
4.3.2. Men
4.3.3. Children
4.4. By Ingredient Type (In Value %)
4.4.1. Plant-based
4.4.2. Mineral-based
4.4.3. Animal-derived (Natural but Ethical Sources)
4.4.4. Synthetic-free
4.4.5. Certified Organic
4.5. By Region (In Value %)
4.5.1. North East
4.5.2. South East
4.5.3. Midwest
4.5.4. West Coast
4.5.5. Central
5. USA Natural Cosmetics Market Competitive Analysis
5.1. Detailed Profiles of Major Companies
5.1.1. L'Oral USA
5.1.2. Este Lauder Companies Inc.
5.1.3. Procter & Gamble
5.1.4. Unilever PLC
5.1.5. Johnson & Johnson
5.1.6. Coty Inc.
5.1.7. Burts Bees (The Clorox Company)
5.1.8. The Honest Company
5.1.9. Weleda
5.1.10. Tatcha LLC
5.1.11. RMS Beauty
5.1.12. Tata Harper
5.1.13. Herbivore Botanicals
5.1.14. Juice Beauty
5.1.15. Aveda (Este Lauder)
5.2. Cross Comparison Parameters
(No. of Employees, Revenue, Global Presence, Product Range, Ingredient Sourcing, R&D Investment, Sustainability Practices, Certification & Standards Compliance)
5.3. Market Share Analysis
5.4. Strategic Initiatives
5.5. Mergers and Acquisitions
5.6. Investment Analysis
5.7. Venture Capital Funding
5.8. Government Grants
5.9. Private Equity Investments
6. USA Natural Cosmetics Market Regulatory Framework
6.1. FDA and USDA Standards
6.2. Organic Certification Requirements
6.3. Compliance with Sustainability Certifications (COSMOS, Ecocert)
6.4. Regulations on Labeling and Claims (Cruelty-Free, Non-Toxic)
7. USA Natural Cosmetics Market Future Size (In USD Billion)
7.1. Future Market Size Projections
7.2. Key Factors Driving Future Market Growth
8. USA Natural Cosmetics Market Future Segmentation
8.1. By Product Type (In Value %)
8.2. By Distribution Channel (In Value %)
8.3. By End-User (In Value %)
8.4. By Ingredient Type (In Value %)
8.5. By Region (In Value %)
9. USA Natural Cosmetics Market Analysts' Recommendations
9.1. TAM/SAM/SOM Analysis
9.2. Customer Cohort Analysis
9.3. Marketing Initiatives
9.4. White Space Opportunity Analysis
Research Methodology
Step 1: Identification of Key Variables
The first step involved mapping out the entire value chain of the USA Natural Cosmetics market. This process focused on identifying and defining key variables such as demand for natural ingredients, consumer behavior, and sustainability trends through thorough desk research using secondary sources, proprietary databases, and industry reports.
Step 2: Market Analysis and Construction
In this phase, historical data on product sales, consumer preferences, and the penetration of natural cosmetics were analyzed. This data helped in determining the current market size and market penetration, leading to accurate revenue projections.
Step 3: Hypothesis Validation and Expert Consultation
To verify the market trends and assumptions, expert consultations were carried out via in-depth interviews with executives from key companies. These consultations validated the growth hypotheses, providing valuable insights on R&D investments, sourcing practices, and consumer demand.
Step 4: Research Synthesis and Final Output
The final synthesis involved consolidating data from secondary research, expert interviews, and proprietary databases to create a comprehensive analysis. This approach ensured that the insights were accurate and covered all aspects of the natural cosmetics market, from product formulations to future market trends.
Frequently Asked Questions
1. How big is the USA Natural Cosmetics market?
The USA Natural Cosmetics market is valued at USD 1.5 billion, based on a five-year historical analysis. This market is primarily driven by increasing consumer awareness about the harmful effects of synthetic ingredients and the rising preference for organic, cruelty-free, and environmentally sustainable products.
2. What are the challenges in the USA Natural Cosmetics market?
Challenges include the high cost of sourcing natural ingredients, strict regulatory requirements for organic certification, and competition from established cosmetic brands, which can impact smaller indie brands' market entry and growth.
3. Who are the major players in the USA Natural Cosmetics market?
Key players in the market include L'Oral USA, The Este Lauder Companies, Procter & Gamble, The Honest Company, and Burts Bees (Clorox). These companies dominate due to their extensive distribution networks, strong brand recognition, and commitment to sustainability.
4. What are the growth drivers of the USA Natural Cosmetics market?
The market is propelled by rising environmental consciousness, consumer preference for organic and cruelty-free products, and the expansion of e-commerce platforms, which allow consumers greater access to niche, natural brands.
Why Buy From Us?
 Framework")
What makes us stand out is that our consultants follows Robust, Refine and Result (RRR) methodology. i.e. Robust for clear definitions, approaches and sanity checking, Refine for differentiating respondents facts and opinions and Result for presenting data with story

We have set a benchmark in the industry by offering our clients with syndicated and customized market research reports featuring coverage of entire market as well as meticulous research and analyst insights.

While we don't replace traditional research, we flip the method upside down. Our dual approach of Top Bottom & Bottom Top ensures quality deliverable by not just verifying company fundamentals but also looking at the sector and macroeconomic factors.

With one step in the future, our research team constantly tries to show you the bigger picture. We help with some of the tough questions you may encounter along the way: How is the industry positioned? Best marketing channel? KPI's of competitors? By aligning every element, we help maximize success.

Our report gives you instant access to the answers and sources that other companies might choose to hide. We elaborate each steps of research methodology we have used and showcase you the sample size to earn your trust.

If you need any support, we are here! We pride ourselves on universe strength, data quality, and quick, friendly, and professional service.