USA Natural Gas Market Outlook to 2030

Region:North America

Author(s):Shubham Kashyap

Product Code:KROD8050

Published On

December 2024

Total pages

95

About the Report

USA Natural Gas Market Overview

  • The USA Natural Gas Market reached a valuation of USD 450 million, primarily driven by rising global demand for natural gas as a cleaner fuel alternative across various sectors, including power generation and industry. Key products such as Liquefied Natural Gas (LNG) and Compressed Natural Gas (CNG) dominate due to their versatility and advancements in storage and transportation technologies, which enable efficient supply chains. The market's growth is further supported by increased focus on reducing carbon emissions and promoting renewable energy integration, positioning natural gas as a transitional energy source for achieving sustainable development goals.

USA Natural Gas Market Size

  • Key regions like Texas, Pennsylvania, and Louisiana play a crucial role in the natural gas market due to extensive natural gas reserves, well-established extraction infrastructure, and favorable regulatory policies. These states benefit from advancements in fracking technologies, making them dominant producers in the national market. Their prominence is bolstered by strategic access to both domestic and export markets, facilitating a steady supply chain that meets growing demand domestically and internationally.
  • The Federal Energy Regulatory Commission (FERC) and the Department of Energy (DOE) oversee regulations impacting natural gas pricing, safety, and export protocols. In 2024, FERC introduced new regulations to streamline LNG export approvals, aiming to expedite project timelines. This regulatory support underpins the U.S.s ambition to secure a stable and efficient natural gas market, enhancing competitiveness on the global stage.

USA Natural Gas Market Segmentation

  • By Product Type: The Market is segmented by product type into Liquefied Natural Gas (LNG) and Compressed Natural Gas (CNG). Among these, Liquefied Natural Gas (LNG) holds the largest market share due to its higher energy density and efficiency in long-distance transportation, making it ideal for export. LNG has gained widespread adoption for both industrial and power generation applications, with consistent growth driven by increasing global demand and investments in LNG export facilities.

USA Natural Gas Market Segmentation By Product Type

  • By Application: The market is further segmented by application into Power Generation and Industrial Use. Power generation has the dominant share due to its essential role in energy transition efforts, as natural gas is often seen as a cleaner alternative to coal. The widespread conversion of coal-fired plants to natural gas, alongside government incentives, has bolstered the demand for natural gas in this segment.

USA Natural Gas Market Segmentation By Application

USA Natural Gas Market Competitive Landscape

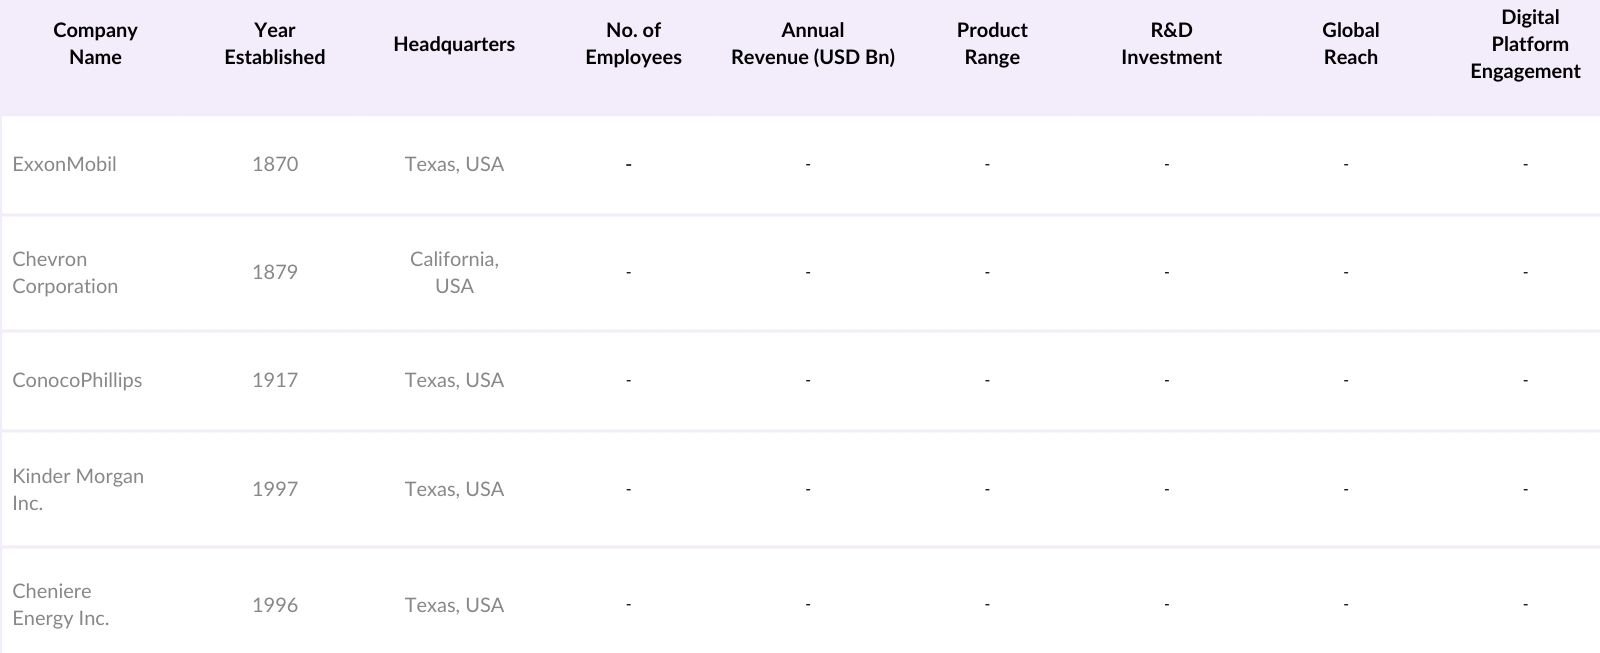
The USA Natural Gas Market is dominated by well-established companies such as ExxonMobil, Chevron Corporation, and ConocoPhillips. These industry giants maintain a competitive edge through significant investments in LNG infrastructure, advancements in extraction technologies, and strategic partnerships. Additionally, their focus on carbon management initiatives and sustainable energy solutions reinforces their market position as demand for cleaner energy grows.

USA Natural Gas Market Competitive Landscape

USA Natural Gas Market Analysis

Growth Drivers

  • Increased LNG Export Capacity: In 2024, the U.S. natural gas market has seen significant expansion in LNG (Liquefied Natural Gas) export capacity, with facilities capable of exporting up to 12 billion cubic feet per day (bcf/d), responding to heightened international demand for U.S. natural gas. This growth is largely driven by surging demand from Europe and Asia, where energy shortages have elevated LNG imports from the U.S., marking a noteable increase in export volumes compared to 2023. Government data highlights that the U.S. is now among the top global LNG exporters, contributing to energy security in allied nations.
  • Demand Surge in Power Generation: Natural gas remains the largest source for U.S. electricity generation, with power plants consuming over 35 bcf/d in 2024, as per EIA reports. The shift away from coal and nuclear power due to emissions regulations has fueled the demand surge, solidifying natural gas as a low-emission alternative for baseload power. The governments ongoing policies to curb carbon emissions have further incentivized utilities to depend on natural gas, particularly with power demand spiking during peak summer and winter seasons.
  • Domestic Production Advancements: In 2024, the U.S. natural gas production has reached approximately 100 bcf/d, supported by advancements in extraction technologies and increased drilling efficiencies. The U.S. Energy Information Administration (EIA) data indicates that prolific shale basins, like the Permian and Marcellus, are instrumental, with a 10% production hike in regions optimized by horizontal drilling and hydraulic fracturing. Domestic output remains pivotal to offsetting increased export volumes while stabilizing local supply for industrial and residential usage.

Challenges

  • Environmental and Regulatory Pressures: The U.S. natural gas market faces regulatory uncertainties, particularly around methane emissions and operational permits. The Environmental Protection Agency (EPA) has proposed stricter methane standards, impacting operators by requiring upgrades to infrastructure for compliance. These evolving policies could challenge exploration and production efficiency, especially if further regulations are introduced without clear and stable guidelines for compliance.
  • High Operational Costs: Operational expenses in the natural gas sector have risen due to factors like labor shortages and escalating equipment costs. Rising wages for skilled workers and higher costs for materials, particularly steel, continue to pressure production budgets. These operational expenses, coupled with the need to meet environmental compliance, add financial strain, underscoring the importance of cost management for long-term market sustainability.

USA Natural Gas Market Future Outlook

The USA Natural Gas Market is projected to experience steady growth for the next five years, fueled by increasing investments in LNG infrastructure, continued global demand for natural gas, and advancements in extraction technologies. As natural gas continues to bridge the gap between traditional fossil fuels and renewables, the market is well-positioned to support the global energy transition. Market players are expected to expand their export capacities and invest in eco-friendly extraction technologies, enhancing their competitiveness in the evolving energy landscape.

Future Market Opportunities

  • Expansion of Renewable Natural Gas (RNG): Renewable natural gas (RNG) is gaining traction, with production output surpassing 402,000 British thermal units (MMBTU) in 2024, representing a substantial increase from 2023, as reported by the DOE. RNG facilities are increasingly being integrated into waste management and agricultural operations, capturing methane emissions and providing a renewable energy source. This shift aligns with federal incentives, which support RNG development, positioning the U.S. as a leader in renewable methane utilization for grid and transport applications.
  • Hydrogen Integration Potential: The integration of hydrogen into the natural gas mix, particularly in industrial applications, is advancing with DOE-backed pilot projects injecting up to 5% hydrogen into existing pipelines. In 2024, the DOE estimates that hydrogen blending could reduce carbon emissions from natural gas combustion by up to 2%. This advancement is seen as a way to decarbonize natural gas without disrupting current infrastructure significantly, reflecting a strategic move toward low-carbon fuel solutions.

Scope of the Report

By Product Type

Compressed Natural Gas (CNG)

Liquefied Natural Gas (LNG)

Synthetic Natural Gas (SNG)

By Application

Power Generation

Industrial

Residential

Transportation

By Technology

Pipeline Transmission

LNG Terminals

Compression and Liquefaction Technology

By Distribution Channel

Direct Distribution

Wholesale/Reseller

By Region

Northeast

Midwest

South

West

Products

Key Target Audience

  • Investors and Venture Capitalist Firms

  • Banks and Financial Institutions

  • Government and Regulatory Bodies (Federal Energy Regulatory Commission, Department of Energy)

  • Natural Gas Production Companies

  • Industrial Consumers (Manufacturing and Heavy Industries)

  • Utility Companies and Power Generators

  • Technology and Equipment Suppliers for the Oil & Gas Industry

  • Environmental Agencies (EPA)

Companies

Players Mentioned in the Report

  • ExxonMobil

  • Chevron Corporation

  • ConocoPhillips

  • Kinder Morgan Inc.

  • Cheniere Energy Inc.

  • Williams Companies Inc.

  • EQT Corporation

  • Dominion Energy Inc.

  • Antero Resources Corporation

  • National Fuel Gas Company

  • Marathon Oil Corporation

  • Enterprise Products Partners LP

  • Cabot Oil & Gas Corporation

  • Pioneer Natural Resources

  • Southwestern Energy

Table of Contents

01 USA Natural Gas Market Overview

1.1 Definition and Scope

1.2 Market Taxonomy

1.3 Market Growth Rate

1.4 Market Segmentation Overview

02 USA Natural Gas Market Size (in USD Mn)

2.1 Historical Market Size

2.2 Year-On-Year Growth Analysis

2.3 Key Developments and Milestones

03 USA Natural Gas Market Analysis

3.1 Growth Drivers (Energy Transition, Export Demand)

3.1.1 Increased LNG Export Capacity

3.1.2 Domestic Production Advancements

3.1.3 Demand Surge in Power Generation

3.2 Market Challenges (Infrastructure Bottlenecks, Policy Changes)

3.2.1 Regulatory Uncertainties

3.2.2 High Operational Costs

3.2.3 Environmental Concerns and Permits

3.3 Opportunities (Technological Innovation, Green Natural Gas)

3.3.1 Expansion of Renewable Natural Gas (RNG)

3.3.2 Hydrogen Integration Potential

3.3.3 Enhanced LNG Transportation Infrastructure

3.4 Trends (Decarbonization Initiatives, Technology Adoption)

3.4.1 Smart Pipelines and Monitoring Systems

3.4.2 Carbon Capture and Storage (CCS) Integration

3.4.3 LNG Bunkering in Marine Applications

3.5 Government Regulation (Federal Incentives, Safety Standards)

3.5.1 Clean Energy Incentives

3.5.2 Emission Standards for Methane

3.5.3 State-Level Policy Variations

3.5.4 FERC and DOE Regulations

3.6. SWOT Analysis

3.7 Stakeholder Ecosystem (Supply Chain, Industry Associations)

3.8 Porters Five Forces Analysis

3.9 Competitive Ecosystem

04 USA Natural Gas Market Segmentation

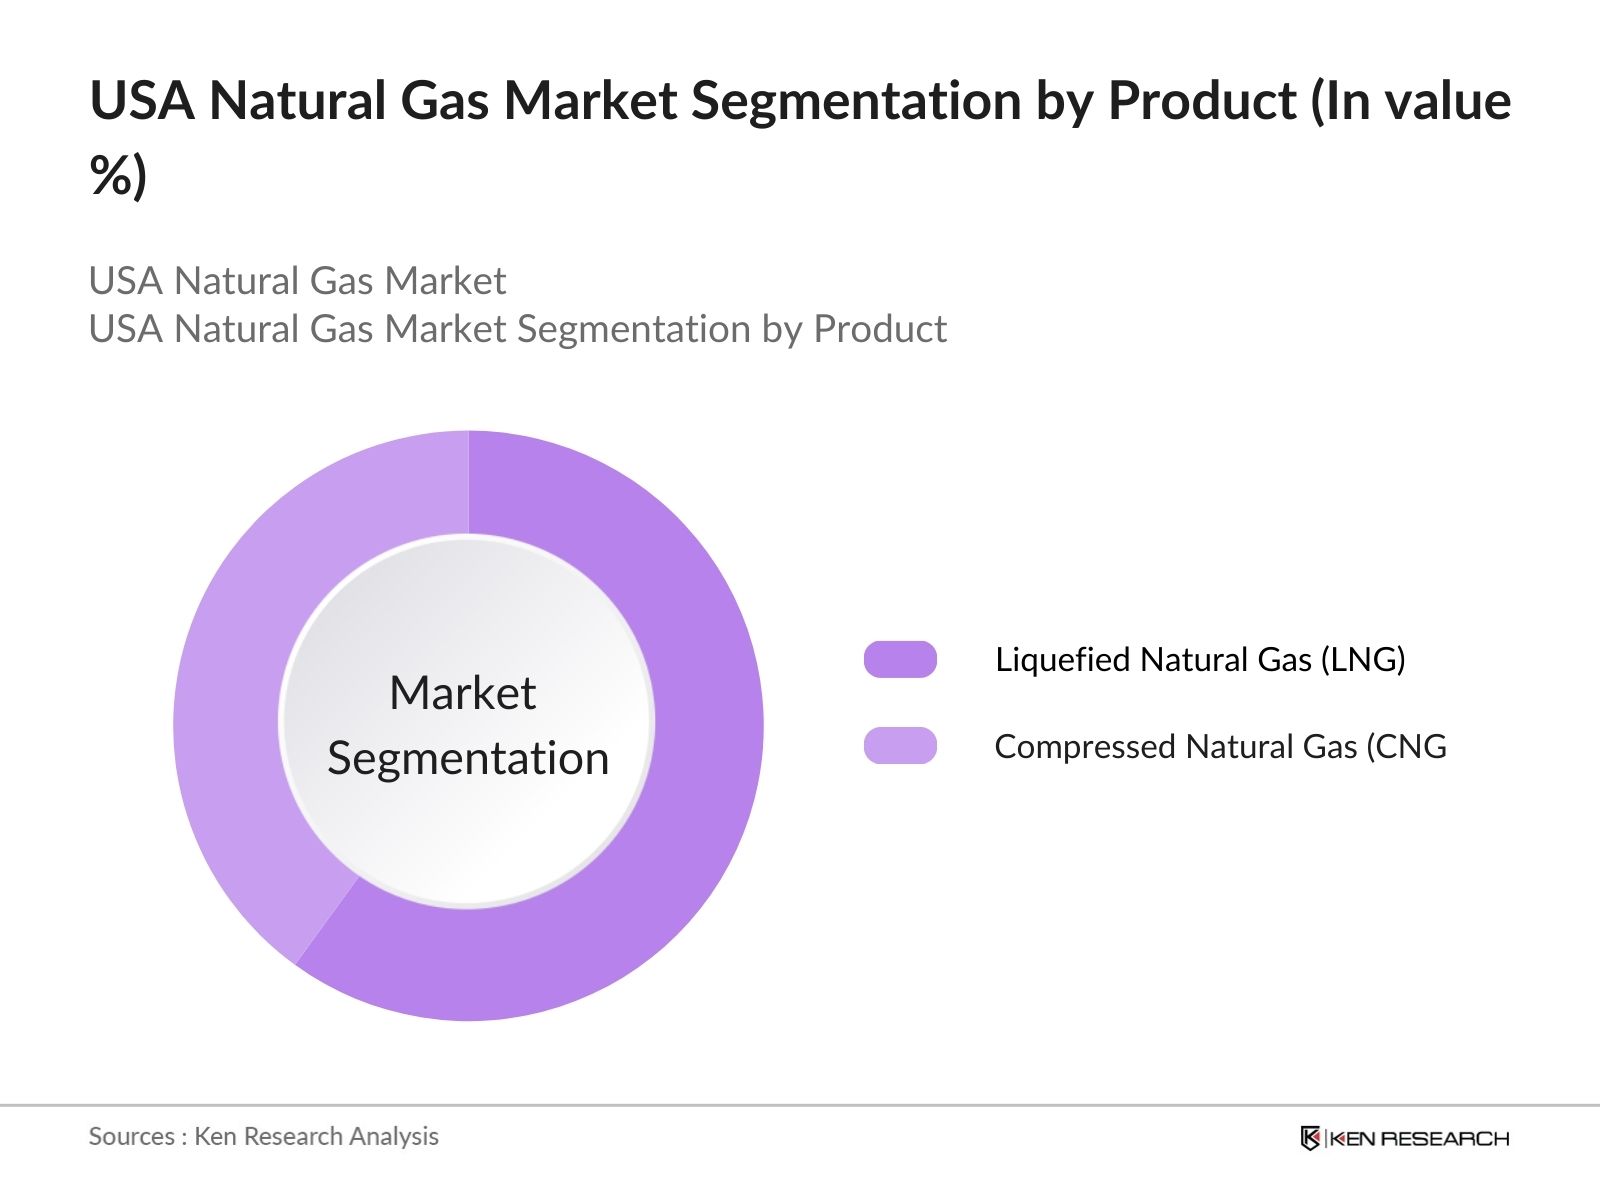
4.1 By Product Type (in Value %)

4.1.1 Compressed Natural Gas (CNG)

4.1.2 Liquefied Natural Gas (LNG)

4.1.3 Synthetic Natural Gas (SNG)

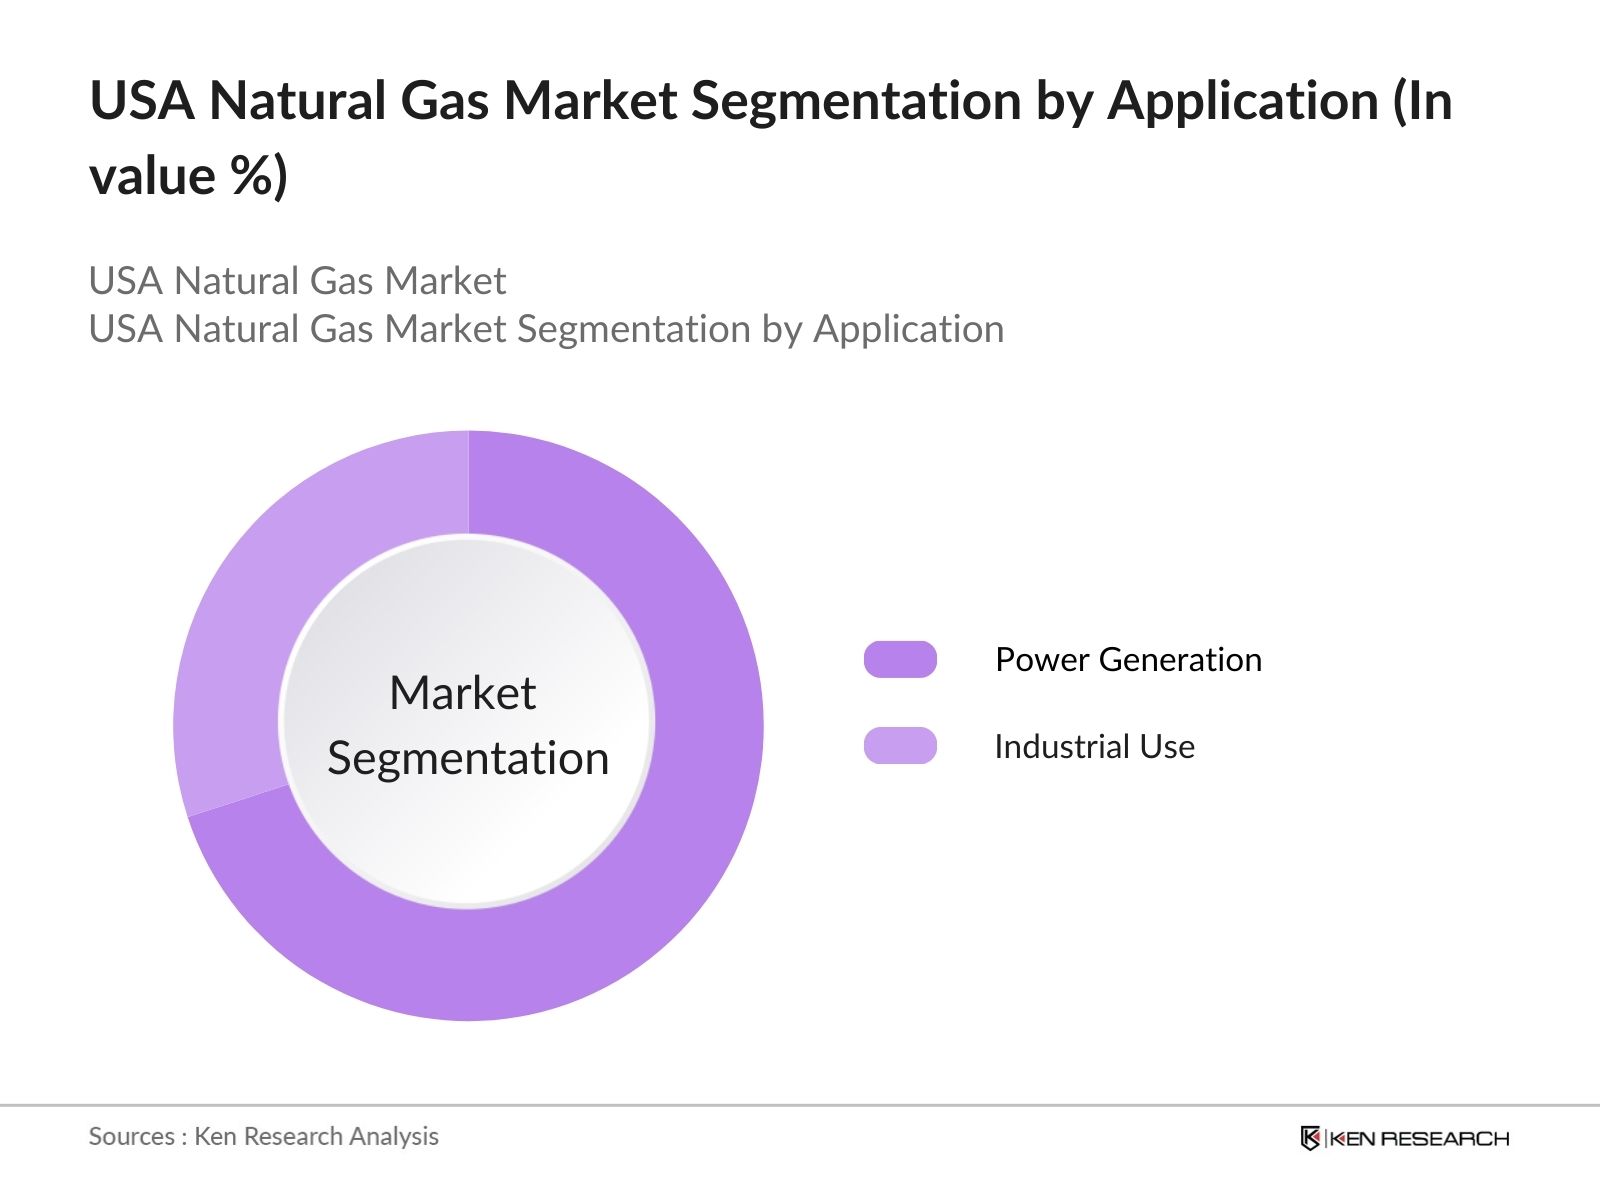
4.2 By Application (in Value %)

4.2.1 Power Generation

4.2.2 Industrial

4.2.3 Residential

4.2.4 Transportation

4.3 By Technology (in Value %)

4.3.1 Pipeline Transmission

4.3.2 LNG Terminals

4.3.3 Compression and Liquefaction Technology

4.4 By Distribution Channel (in Value %)

4.4.1 Direct Distribution

4.4.2 Wholesale/Reseller

4.5 By Region (in Value %)

4.5.1 Northeast

4.5.2 Midwest

4.5.3 South

4.5.4 West

05 USA Natural Gas Market Competitive Analysis

5.1 Profiles of Major Companies

5.1.1 ExxonMobil

5.1.2 Chevron Corporation

5.1.3 ConocoPhillips

5.1.4 Kinder Morgan Inc.

5.1.5 Cheniere Energy Inc.

5.1.6 Williams Companies Inc.

5.1.7 Dominion Energy Inc.

5.1.8 EQT Corporation

5.1.9 Enterprise Products Partners LP

5.1.10 Antero Resources Corporation

5.1.11 National Fuel Gas Company

5.1.12 Marathon Oil Corporation

5.1.13 Pioneer Natural Resources

5.1.14 Cabot Oil & Gas Corporation

5.1.15 Southwestern Energy

5.2 Cross-Comparison Parameters (Production Volume, Revenue, Market Share, Distribution Network, LNG Export Capacity, Carbon Management Initiatives, Innovation Index, Capital Expenditure)

5.3 Market Share Analysis

5.4 Strategic Initiatives

5.5 Mergers and Acquisitions

5.6 Investment Analysis

5.7 Venture Capital Funding

5.8 Government Grants

5.9 Private Equity Investments

06 USA Natural Gas Market Regulatory Framework

6.1 Environmental Standards

6.2 Compliance Requirements

6.3 Certification Processes

6.4 Federal and State-Level Incentives

07 USA Natural Gas Future Market Size (in USD Mn)

7.1 Future Market Size Projections

7.2 Key Factors Driving Future Growth

08 USA Natural Gas Future Market Segmentation

8.1 By Product Type (in Value %)

8.2 By Application (in Value %)

8.3 By Technology (in Value %)

8.4 By Distribution Channel (in Value %)

8.5 By Region (in Value %)

09 USA Natural Gas Market Analysts Recommendations

9.1 Total Available Market (TAM), Serviceable Available Market (SAM), and Serviceable Obtainable Market (SOM) Analysis

9.2 Customer Cohort Analysis

9.3 Marketing Initiatives

9.4 White Space Opportunity Analysis

Disclaimer Contact Us

Research Methodology

Step 1: Identification of Key Variables


The initial phase involves creating a comprehensive market ecosystem map encompassing major stakeholders in the USA Natural Gas Market. This process relies on desk research from proprietary and secondary databases to gather relevant information on industry-level variables.

Step 2: Market Analysis and Construction


Historical data on production, distribution, and consumption patterns within the USA Natural Gas Market is compiled and analyzed. This step is crucial for establishing baseline projections and evaluating market dynamics under current regulatory and economic conditions.

Step 3: Hypothesis Validation and Expert Consultation


The analysis is supplemented with insights from industry experts and primary data sources through structured interviews. Experts from production companies and industry associations provide key insights into market trends and forecast assumptions.

Step 4: Research Synthesis and Final Output


Finally, data from secondary and primary sources is synthesized to produce a robust market report, supported by detailed insights into growth drivers, challenges, and future opportunities for the USA Natural Gas Market.

Frequently Asked Questions

01. How big is the USA Natural Gas Market?

The USA Natural Gas Market reached a valuation of USD 450 million, with growth driven by rising demand for cleaner energy across industrial and power generation sectors.

02. What are the challenges in the USA Natural Gas Market?

Challenges in the USA Natural Gas Market include stringent environmental regulations, rising operational costs, and supply chain disruptions impacting timely production and distribution.

03. Who are the major players in the USA Natural Gas Market?

Key players in the USA Natural Gas Market include ExxonMobil, Chevron Corporation, ConocoPhillips, and Cheniere Energy Inc., known for their advanced production and export capabilities.

04. What are the growth drivers of the USA Natural Gas Market?

The USA Natural Gas Market is propelled by increasing global demand for natural gas, advancements in extraction technologies, and expanding LNG export capacities.

Why Buy From Us?

RRR
Refine Robust Result (RRR) Framework

What makes us stand out is that our consultants follows Robust, Refine and Result (RRR) methodology. i.e. Robust for clear definitions, approaches and sanity checking, Refine for differentiating respondents facts and opinions and Result for presenting data with story

Our Reach Is Unmatched

We have set a benchmark in the industry by offering our clients with syndicated and customized market research reports featuring coverage of entire market as well as meticulous research and analyst insights.

Research
Shifting the Research Paradigm

While we don't replace traditional research, we flip the method upside down. Our dual approach of Top Bottom & Bottom Top ensures quality deliverable by not just verifying company fundamentals but also looking at the sector and macroeconomic factors.

Insite
More Insights-Better Decisions

With one step in the future, our research team constantly tries to show you the bigger picture. We help with some of the tough questions you may encounter along the way: How is the industry positioned? Best marketing channel? KPI's of competitors? By aligning every element, we help maximize success.

Trust
Transparency and Trust

Our report gives you instant access to the answers and sources that other companies might choose to hide. We elaborate each steps of research methodology we have used and showcase you the sample size to earn your trust.

support
Round the Clock Support

If you need any support, we are here! We pride ourselves on universe strength, data quality, and quick, friendly, and professional service.

Why Client Choose Us?

400000+ Reports in repository
150+ Consulting project a year
100+ Analysts
8000+ Client Queries in 2022