


USA Non-Alcoholic Beverages Market Outlook to 2030
Region:North America
Author(s):Sanjeev
Product Code:KROD4362
December 2024
98
About the Report
USA Non-Alcoholic Beverages Market Overview
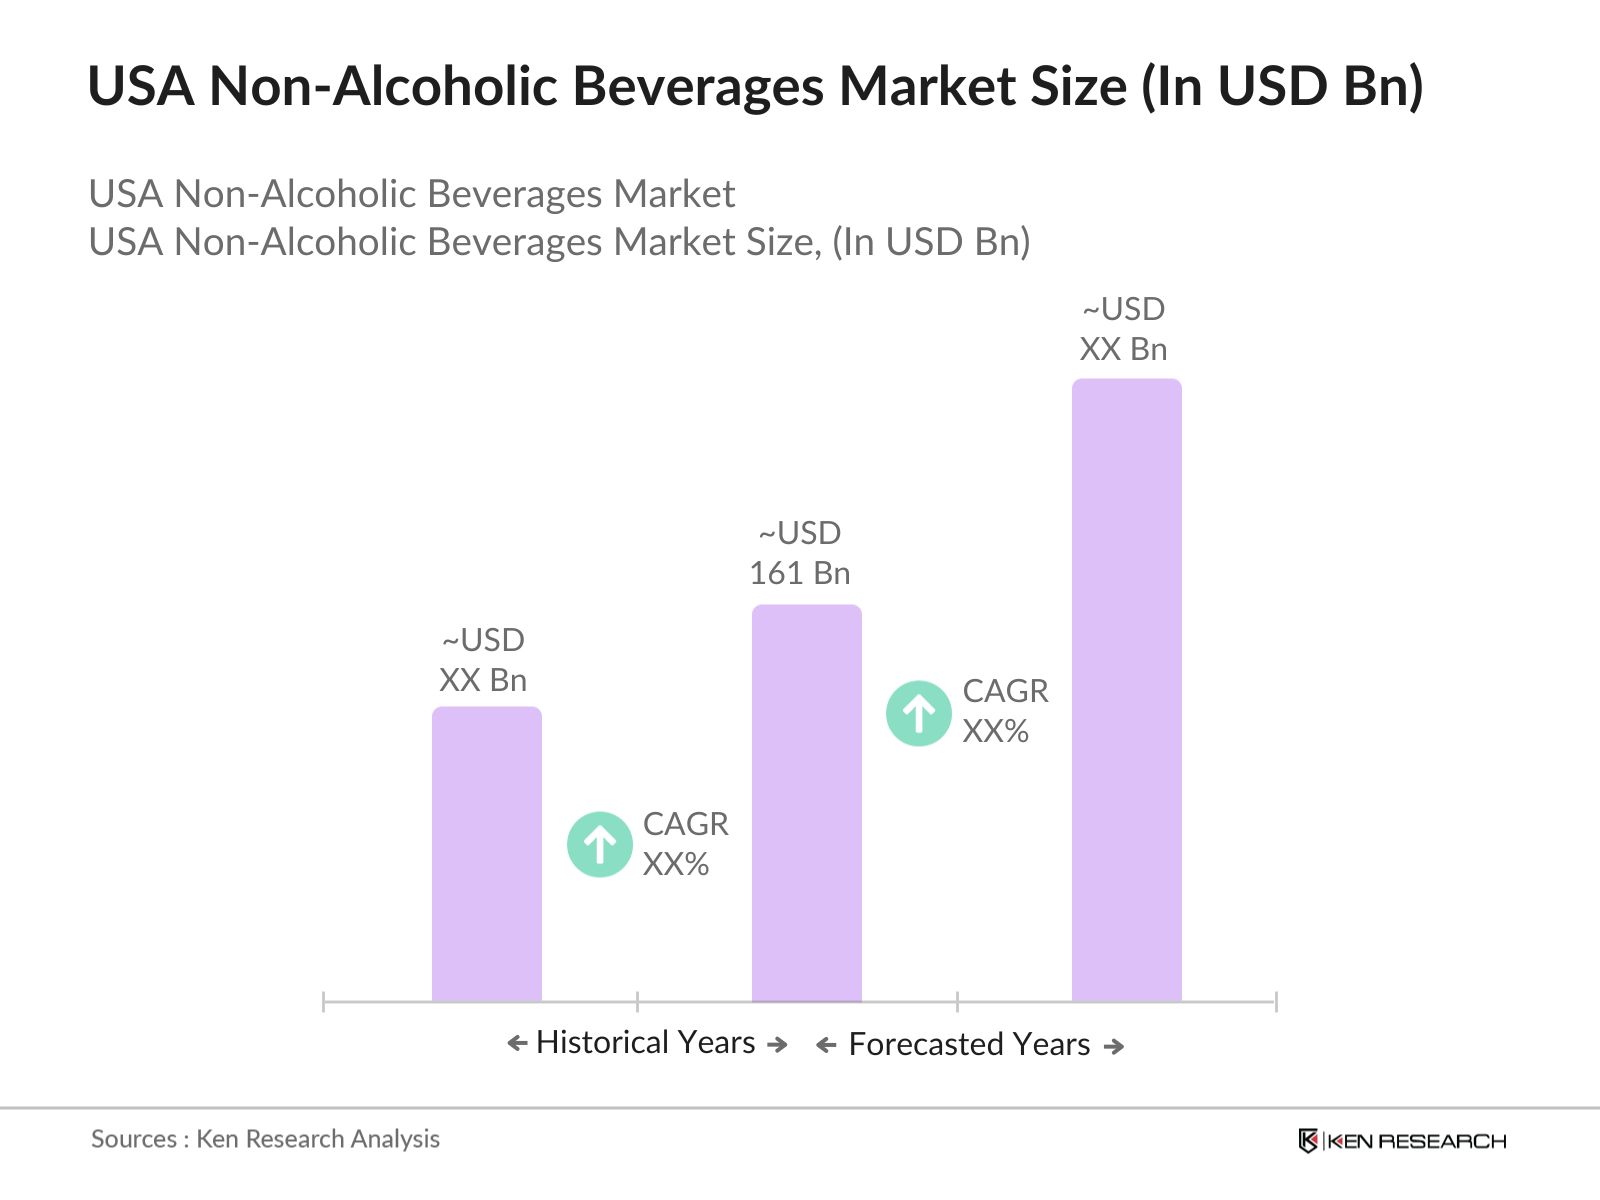
- The USA non-alcoholic beverages market is valued at USD 161 billion, driven by changing consumer preferences and a focus on healthier alternatives. This market encompasses a wide array of products including carbonated soft drinks, juices, bottled water, and functional beverages. The demand is fueled by rising health awareness, the increasing availability of low-calorie, organic, and plant-based options, and innovations in packaging and flavor. Additionally, the surge in e-commerce and direct-to-consumer models has made it easier for brands to reach their consumers, contributing to the market's growth based on a five-year historical analysis.
- Key cities and states dominate the market due to their large populations and diverse consumer bases. California, New York, and Texas lead due to their progressive consumer behavior and high demand for premium and healthy beverage options. Californias health-conscious demographic and its leadership in setting food and beverage trends drive growth, while New York and Texas offer a mix of urban markets and diverse consumer needs. Furthermore, the convenience of distribution channels in these regions solidifies their leadership within the USA non-alcoholic beverages market.
- USDA Organic Certification remains a critical factor in the U.S. non-alcoholic beverages market, particularly for organic beverages. In 2024, USDA rules mandated stringent labeling requirements to ensure that products labeled as organic meet specific production standards. There were over 28,000 USDA-certified organic farms and processors in the U.S. in 2023, reflecting the growing supply chain for organic beverages. Consumers continue to prioritize organic certification, driving demand for USDA-certified organic products, including plant-based milks and juices.
USA Non-Alcoholic Beverages Market Segmentation
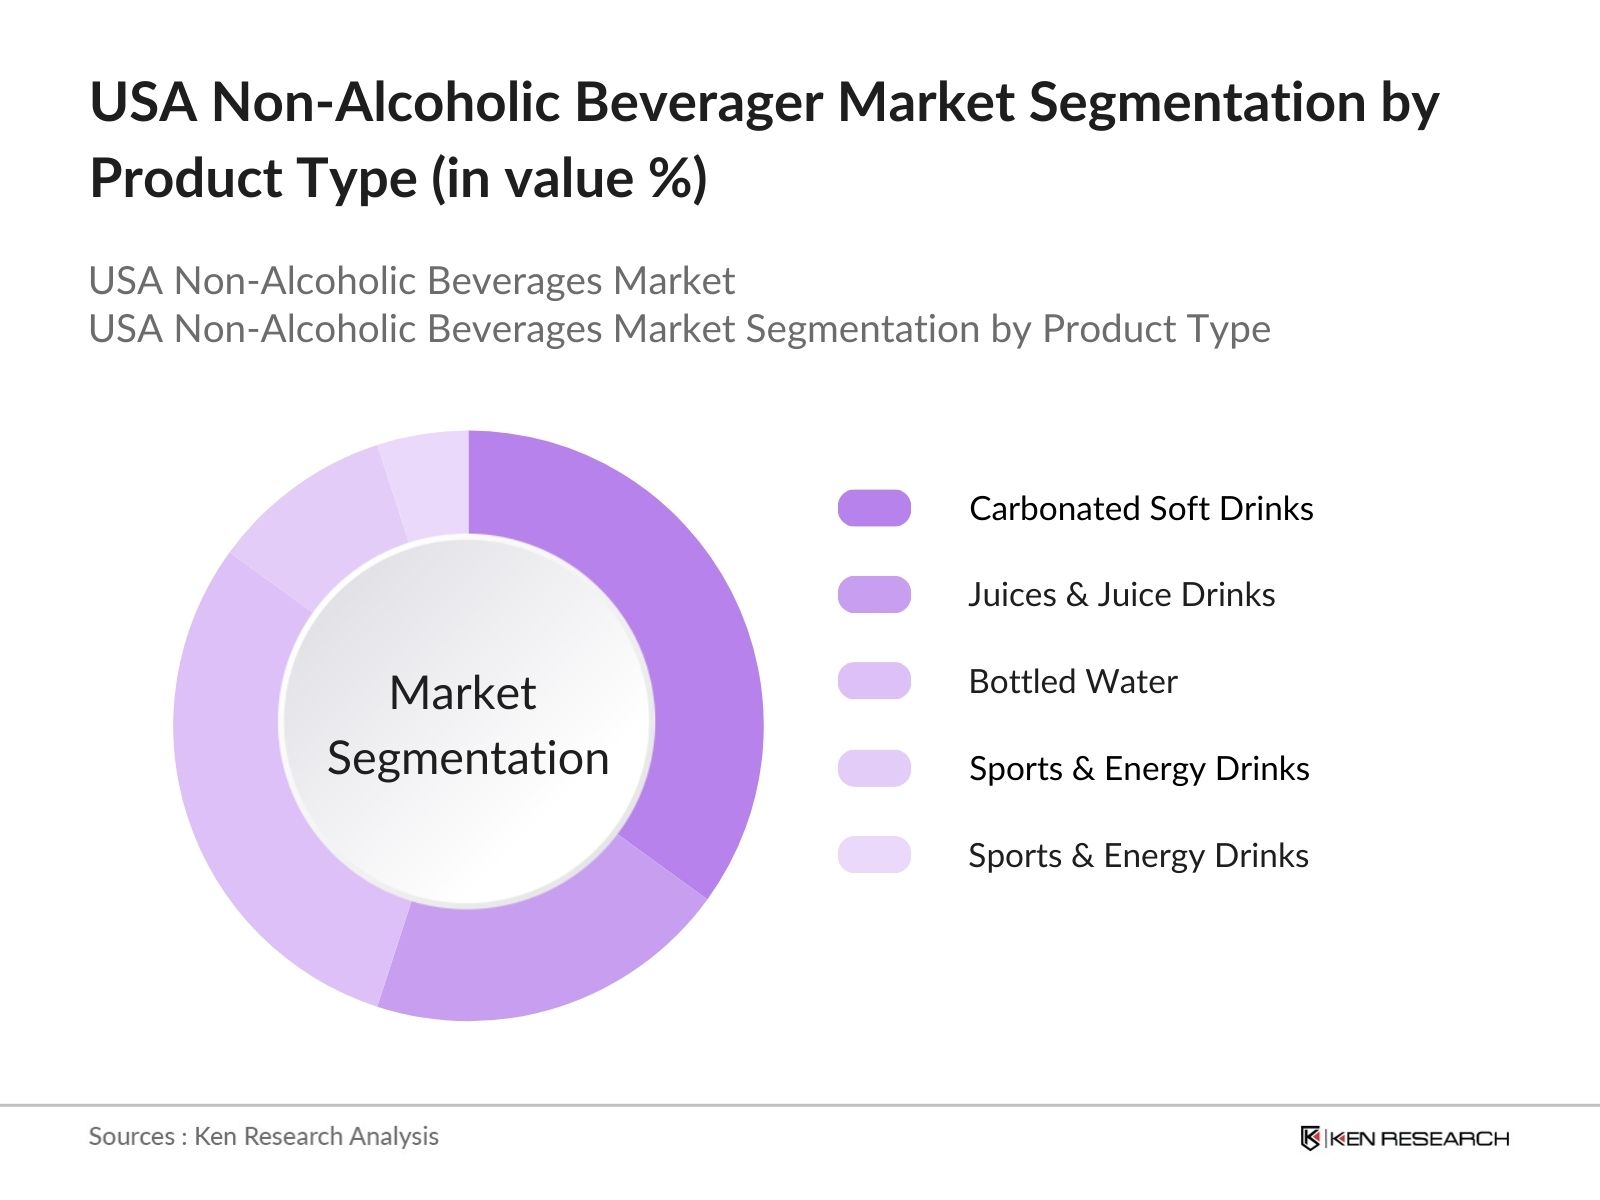
- By Product Type: The market is segmented by product type into carbonated soft drinks, juices, bottled water, sports & energy drinks, and ready-to-drink (RTD) teas and coffees. In this category, carbonated soft drinks maintain a dominant market share. This is attributed to their engrained presence and continuing popularity among consumers, despite growing health concerns. Brands like Coca-Cola and Pepsi have established strong brand loyalty over the years, which has played a crucial role in sustaining their market dominance. However, the bottled water segment is also rising rapidly, driven by the increasing shift toward healthier, sugar-free options and the premiumization of water products such as flavored and mineral-infused water.
???????
- By Distribution Channel: The market is also segmented by distribution channels into supermarkets/hypermarkets, convenience stores, online retail, and direct-to-consumer (DTC) channels. Supermarkets and hypermarkets account for the largest share of sales, driven by their expansive product selection and consumer trust. Consumers continue to prefer the convenience and immediate availability of beverages offered in these stores. However, online retail is rapidly gaining traction, boosted by the pandemics influence on consumer shopping habits and the ease of subscription-based purchases. The DTC channel is particularly appealing for functional and premium beverage brands, offering a direct relationship with consumers.
???????
USA Non-Alcoholic Beverages Competitive Landscape
The USA non-alcoholic beverages market is dominated by several global giants, as well as some prominent local players. Major companies like Coca-Cola, PepsiCo, and Nestl Waters North America dominate due to their vast distribution networks, extensive product portfolios, and innovative marketing strategies. These firms have the financial resources and infrastructure to invest in R&D, allowing them to consistently introduce new products aligned with current trends such as functional and plant-based beverages. At the same time, emerging brands focusing on niche categories like kombucha or cold-pressed juices are also gaining market traction.
|
Company |
Establishment Year |
Headquarters |
Revenue (2023) |
Product Portfolio |
Sustainability Initiatives |
Market Penetration |
R&D Investment |
Brand Loyalty Programs |
Geographical Presence |
|
The Coca-Cola Company |
1886 |
Atlanta, USA |
|||||||
|
PepsiCo Inc. |
1965 |
New York, USA |
|||||||
|
Nestl Waters North America |
1976 |
Stamford, USA |
|||||||
|
Keurig Dr Pepper Inc. |
1981 |
Burlington, USA |
|||||||
|
Red Bull North America |
1987 |
Santa Monica, USA |
USA Non-Alcoholic Beverages Industry Analysis
Growth Drivers
- Health-conscious consumer trends (Rise in functional and fortified beverages): The USA non-alcoholic beverage market is experiencing significant growth driven by the rising consumer demand for functional beverages. In 2024, functional beverages such as probiotic drinks and fortified waters accounted for a large share of the market, as consumers prioritize gut health, immunity, and hydration. According to the FDA, 62 million adults in the U.S. suffer from digestive health issues, leading to a growing preference for prebiotic and probiotic-infused drinks. The increased focus on health and wellness has also fueled demand for beverages fortified with vitamins and minerals.
- Growing demand for plant-based and organic beverages: In 2024, the demand for plant-based beverages, such as almond milk and oat milk, continues to grow due to shifting dietary preferences toward vegan and organic products. The USDA Organic Certification plays a significant role in boosting consumer confidence in organic beverages, with over 2.3 million certified organic acres in the U.S. as of 2022. This trend is further supported by USDA reports showing that sales of organic beverages grew significantly, making them a staple in health-conscious households.
- Increasing penetration of convenient distribution channels (E-commerce, DTC, etc.): E-commerce and direct-to-consumer (DTC) sales channels have seen rapid expansion within the U.S. non-alcoholic beverage market. By 2024, online grocery sales accounted for approximately $115 billion, and beverages represented a significant portion of this. E-commerce platforms and DTC brands have improved accessibility to non-alcoholic drinks, with companies like PepsiCo and Coca-Cola launching DTC portals to meet consumer demand for convenience. This shift is further supported by rising internet penetration, which reached 91% of U.S. households in 2023, facilitating seamless online transactions.
Market Challenges
- High operational costs (Raw material sourcing, supply chain bottlenecks): The non-alcoholic beverage market in the U.S. faces high operational costs due to sourcing raw materials and dealing with supply chain disruptions. By 2024, the average cost of transporting goods in the U.S. increased to $2.75 per mile, as per the U.S. Department of Transportation. This has driven up prices for raw materials, such as sugar and aluminum for cans. Beverage manufacturers also contend with increased costs from disruptions in global supply chains caused by geopolitical tensions and inflationary pressures, affecting profitability and operational efficiency.
- Intense competition from private-label and niche brands: The U.S. non-alcoholic beverage sector faces stiff competition from private-label brands, which are gaining market share due to their lower price points and increasing quality. Retailers such as Walmart and Costco have expanded their private-label offerings in non-alcoholic drinks, further intensifying competition. According to the U.S. Bureau of Labor Statistics, over 45% of consumers in 2023 reported purchasing private-label beverages, primarily driven by inflationary pressures and consumer interest in affordable yet quality alternatives.
USA Non-Alcoholic Beverages Market Future Outlook
Over the next five years, the USA non-alcoholic beverages market is expected to show consistent growth driven by evolving consumer preferences for healthier, functional beverages and increasing investments in sustainability initiatives. The rise of e-commerce and direct-to-consumer sales will continue to shape distribution models, while innovations in packaging will cater to both consumer convenience and environmental concerns. Furthermore, the integration of plant-based and organic beverages into mainstream consumption will likely accelerate as consumer demand for clean-label products grows.
Future Market Opportunities
- Expansion of premium product categories (Cold-pressed juices, kombucha): The U.S. premium non-alcoholic beverages market, particularly cold-pressed juices and kombucha, has seen significant growth. Cold-pressed juice sales surged by 10% in 2023, driven by consumer interest in fresh, natural beverages with minimal processing. Kombucha sales have also risen as consumers seek probiotic-rich drinks for digestive health. The increased disposable income of American households, which averaged $70,784 in 2023, has supported demand for premium beverages, which are positioned as healthier alternatives to conventional sugary drinks.
- Innovations in packaging sustainability (Eco-friendly alternatives): Sustainable packaging innovations present a key opportunity in the non-alcoholic beverage market. In 2024, the U.S. beverage industry is shifting toward eco-friendly alternatives such as plant-based plastics and aluminum cans with higher recycling rates. The U.S. Environmental Protection Agency (EPA) reports that aluminum can recycling rates reached 55% in 2023, offering a viable solution to reduce waste. Furthermore, leading beverage brands are introducing fully recyclable packaging, supporting environmentally conscious consumers and aligning with corporate sustainability goals.
Scope of the Report
|
By Product Type |
Carbonated Soft Drinks Juices & Juice Drinks Bottled Water Sports & Energy Drinks Ready-to-Drink Teas and Coffees |
|
By End-User |
Household Consumption On-premise (Restaurants, Cafes, Bars) Institutional Sales (Hospitals, Schools) |
|
By Distribution Channel |
Supermarkets/Hypermarkets Convenience Stores Online Retail Direct-to-Consumer (DTC) |
|
By Packaging Type |
Plastic Bottles Cans, Glass Bottles Cartons |
|
By Region |
North East West South |
Products
USA Non-Alcoholic Beverages Key Target Audience
Non-alcoholic beverage manufacturers
Raw material suppliers
Supermarkets/Hypermarkets
Convenience store chains
Banks and Financial Institutes
Online retailers and e-commerce platforms
Investment and venture capitalist firms
Government and regulatory bodies (FDA, USDA)
Packaging and bottling companies
Companies
USA Non-Alcoholic Beverages Major Players
The Coca-Cola Company
PepsiCo Inc.
Nestl Waters North America
Keurig Dr Pepper Inc.
Red Bull North America
Monster Beverage Corporation
Arizona Beverages USA
Danone North America
The Kraft Heinz Company
Bolthouse Farms Inc.
Vita Coco
Hint Inc.
Bai Brands LLC
Talking Rain Beverage Company
National Beverage Corp.
Table of Contents
USA Non-Alcoholic Beverages Market Overview
Definition and Scope
Market Taxonomy (Product Types, End-Users, Distribution Channels)
Market Growth Rate (Volume and Revenue)
Market Segmentation Overview (5 Key Segments)
USA Non-Alcoholic Beverages Market Size (In USD Bn)
Historical Market Size
Year-On-Year Growth Analysis
Key Market Developments and Milestones (Government Policies, Consumer Behavior Shifts, Technological Developments)
USA Non-Alcoholic Beverages Market Analysis
3.1. Growth Drivers (Consumer Preferences, Health Trends, Innovations)
Health-conscious consumer trends (Rise in functional and fortified beverages)
Growing demand for plant-based and organic beverages
Increasing penetration of convenient distribution channels (E-commerce, DTC, etc.)
Supportive government policies (FDA regulations, USDA Organic Certification)
3.2. Market Challenges (Operational and Structural)
High operational costs (Raw material sourcing, supply chain bottlenecks)
Intense competition from private-label and niche brands
Regulatory constraints (FDA labeling laws, sugar taxation policies)
3.3. Opportunities (Unmet Needs and Strategic Areas)
Expansion of premium product categories (Cold-pressed juices, kombucha)
Innovations in packaging sustainability (Eco-friendly alternatives)
Growth potential in low-calorie and sugar-free beverages (Sparkling water, zero-sugar sodas)
3.4. Trends (Key Consumer and Industry Shifts)
Increased focus on sustainability and eco-friendly packaging
Rise of functional beverages (Prebiotic, probiotic, adaptogen-infused drinks)
Growth in digital and direct-to-consumer sales models
Collaborative innovations in flavors and health benefits (Co-branded health drinks)
3.5. Government Regulations
Food and Drug Administration (FDA) Regulations (Nutritional labeling, safety standards)
USDA Organic Certifications (Labeling requirements, organic certifications)
Federal and State Level Beverage Taxation Policies (Sugar tax, recycling laws)
Import and Export Tariffs (Tariff implications on beverage ingredients)
3.6. SWOT Analysis
Strengths: Strong distribution networks, diverse product portfolios
Weaknesses: High costs in R&D and sustainability initiatives
Opportunities: Expansion in functional and health beverage categories
Threats: Regulatory pressures, price sensitivity
3.7. Stakeholder Ecosystem
Raw Material Suppliers (Fruit concentrates, sweeteners, flavor additives)
Manufacturing and Bottling Companies
Distributors and Retailers (Grocery chains, online platforms)
Consumers (Health-conscious buyers, Gen Z, Millennials)
3.8. Porters Five Forces
Bargaining Power of Suppliers
Bargaining Power of Buyers
Threat of Substitutes
Threat of New Entrants
Industry Rivalry
3.9. Competitive Ecosystem
Product Differentiation Strategies (Functional benefits, low-calorie options)
Innovation Pipelines (Plant-based beverages, innovative flavors)
Sustainability Initiatives (Eco-friendly packaging, reduced carbon footprints)
USA Non-Alcoholic Beverages Market Segmentation
4.1. By Product Type (In Value %)
Carbonated Soft Drinks
Juices & Juice Drinks
Bottled Water
Sports & Energy Drinks
Ready-to-Drink Teas and Coffees
4.2. By End-User (In Value %)
Household Consumption
On-premise (Restaurants, Cafes, Bars)
Institutional Sales (Hospitals, Schools)
4.3. By Distribution Channel (In Value %)
Supermarkets/Hypermarkets
Convenience Stores
Online Retail
Direct-to-Consumer (DTC)
4.4. By Packaging Type (In Value %)
Plastic Bottles
Cans
Glass Bottles
Cartons
4.5. By Region (In Value %)
North
East
South
West
USA Non-Alcoholic Beverages Market Competitive Analysis
5.1 Detailed Profiles of Major Competitors
The Coca-Cola Company
PepsiCo Inc.
Nestl Waters North America
Keurig Dr Pepper Inc.
Red Bull North America
Monster Beverage Corporation
The Kraft Heinz Company
Danone North America
National Beverage Corp.
Arizona Beverages USA
Bolthouse Farms Inc.
Bai Brands LLC
Vita Coco
Hint Inc.
Talking Rain Beverage Company
5.2 Cross Comparison Parameters (Market-Specific)
Revenue, Market Share
Distribution Reach
Sustainability Initiatives
Number of SKUs (Stock Keeping Units)
Product Innovation Pipeline
Consumer Engagement (Brand Loyalty, Advertising Spend)
Retail Partnerships
Geographical Presence
5.3 Market Share Analysis
5.4 Strategic Initiatives
5.5 Mergers And Acquisitions
5.6 Investment Analysis
5.7 Venture Capital Funding
5.8 Government Grants
5.9 Private Equity Investments
USA Non-Alcoholic Beverages Market Regulatory Framework
FDA Compliance Regulations (Labeling, Ingredient Standards)
Beverage Taxation Policies (Sugar taxes, health-related tariffs)
Recycling and Waste Management Regulations (Bottle bills, sustainability targets)
Import-Export Tariff Regulations (Impact on raw materials and finished products)
USA Non-Alcoholic Beverages Future Market Size (In USD Bn)
Future Market Size Projections
Key Factors Driving Future Market Growth (Consumer Behavior Shifts, Regulatory Changes, Technological Advancements)
USA Non-Alcoholic Beverages Future Market Segmentation
8.1. By Product Type (In Value %)
8.2. By End-User (In Value %)
8.3. By Distribution Channel (In Value %)
8.4. By Packaging Type (In Value %)
8.5. By Region (In Value %)
USA Non-Alcoholic Beverages Market Analysts Recommendations
TAM/SAM/SOM Analysis (Total Addressable Market, Serviceable Available Market, Serviceable Obtainable Market)
Customer Cohort Analysis (Consumer Segmentation, Preferences)
Marketing Initiatives (Brand Engagement Strategies, Health-focused Campaigns)
White Space Opportunity Analysis (Unmet Needs, Growth Areas)
Disclaimer Contact UsResearch Methodology
Step 1: Identification of Key Variables
The initial phase of research involves constructing an ecosystem map encompassing all major stakeholders within the USA Non-Alcoholic Beverages Market. This step is grounded in extensive desk research, utilizing both secondary and proprietary databases to gather comprehensive industry-level data. The primary objective is to identify and define the critical variables influencing market dynamics.
Step 2: Market Analysis and Construction
In this phase, we compile and analyze historical data pertaining to the USA Non-Alcoholic Beverages Market. This includes assessing market penetration, product sales, and consumer behavior trends. Furthermore, the analysis evaluates revenue generation by key market segments, ensuring the reliability and accuracy of market size estimates.
Step 3: Hypothesis Validation and Expert Consultation
Hypotheses based on initial research findings are developed and subsequently validated through interviews with industry experts from beverage companies, retail chains, and regulatory bodies. These consultations provide invaluable operational insights directly from market practitioners, which will help refine and corroborate market data.
Step 4: Research Synthesis and Final Output
The final phase of the research involves synthesizing all findings, supplemented by interactions with beverage manufacturers and retailers. This step aims to validate and complement data obtained through both top-down and bottom-up approaches, ensuring a comprehensive and validated analysis of the USA non-alcoholic beverages market.
Frequently Asked Questions
01. How big is the USA Non-Alcoholic Beverages Market?
The USA non-alcoholic beverages market is valued at USD 161 billion. The market has been driven by the increasing consumer shift towards healthier options, innovative product offerings, and the growth of e-commerce channels.
02. What are the challenges in the USA Non-Alcoholic Beverages Market?
The USA non-alcoholic beverages market faces challenges such as rising raw material costs, regulatory constraints around sugar content and labeling, and high competition from private-label brands and startups focusing on niche products.
03. Who are the major players in the USA Non-Alcoholic Beverages Market?
The USA non-alcoholic beverages market is dominated by key players such as The Coca-Cola Company, PepsiCo Inc., Nestl Waters North America, Keurig Dr Pepper Inc., and Red Bull North America. These companies maintain their dominance through strong distribution networks, brand loyalty, and continuous innovation.
04. What are the growth drivers of the USA Non-Alcoholic Beverages Market?
Growth is propelled by rising health consciousness among consumers, demand for plant-based and functional beverages, innovations in packaging, and increased penetration of online retail and direct-to-consumer sales models.
05. What are the emerging trends in the USA Non-Alcoholic Beverages Market?
Emerging trends in the USA non-alcoholic beverages market include the rise of functional beverages infused with probiotics, adaptogens, and prebiotics, as well as an increased focus on sustainable packaging solutions and a shift towards organic and natural ingredients.
Why Buy From Us?
 Framework")
What makes us stand out is that our consultants follows Robust, Refine and Result (RRR) methodology. i.e. Robust for clear definitions, approaches and sanity checking, Refine for differentiating respondents facts and opinions and Result for presenting data with story

We have set a benchmark in the industry by offering our clients with syndicated and customized market research reports featuring coverage of entire market as well as meticulous research and analyst insights.

While we don't replace traditional research, we flip the method upside down. Our dual approach of Top Bottom & Bottom Top ensures quality deliverable by not just verifying company fundamentals but also looking at the sector and macroeconomic factors.

With one step in the future, our research team constantly tries to show you the bigger picture. We help with some of the tough questions you may encounter along the way: How is the industry positioned? Best marketing channel? KPI's of competitors? By aligning every element, we help maximize success.

Our report gives you instant access to the answers and sources that other companies might choose to hide. We elaborate each steps of research methodology we have used and showcase you the sample size to earn your trust.

If you need any support, we are here! We pride ourselves on universe strength, data quality, and quick, friendly, and professional service.