


USA Real Estate Market Outlook to 2030
Region:North America
Author(s):Mukul
Product Code:KROD4196
October 2024
92
About the Report
USA Real Estate Market Overview
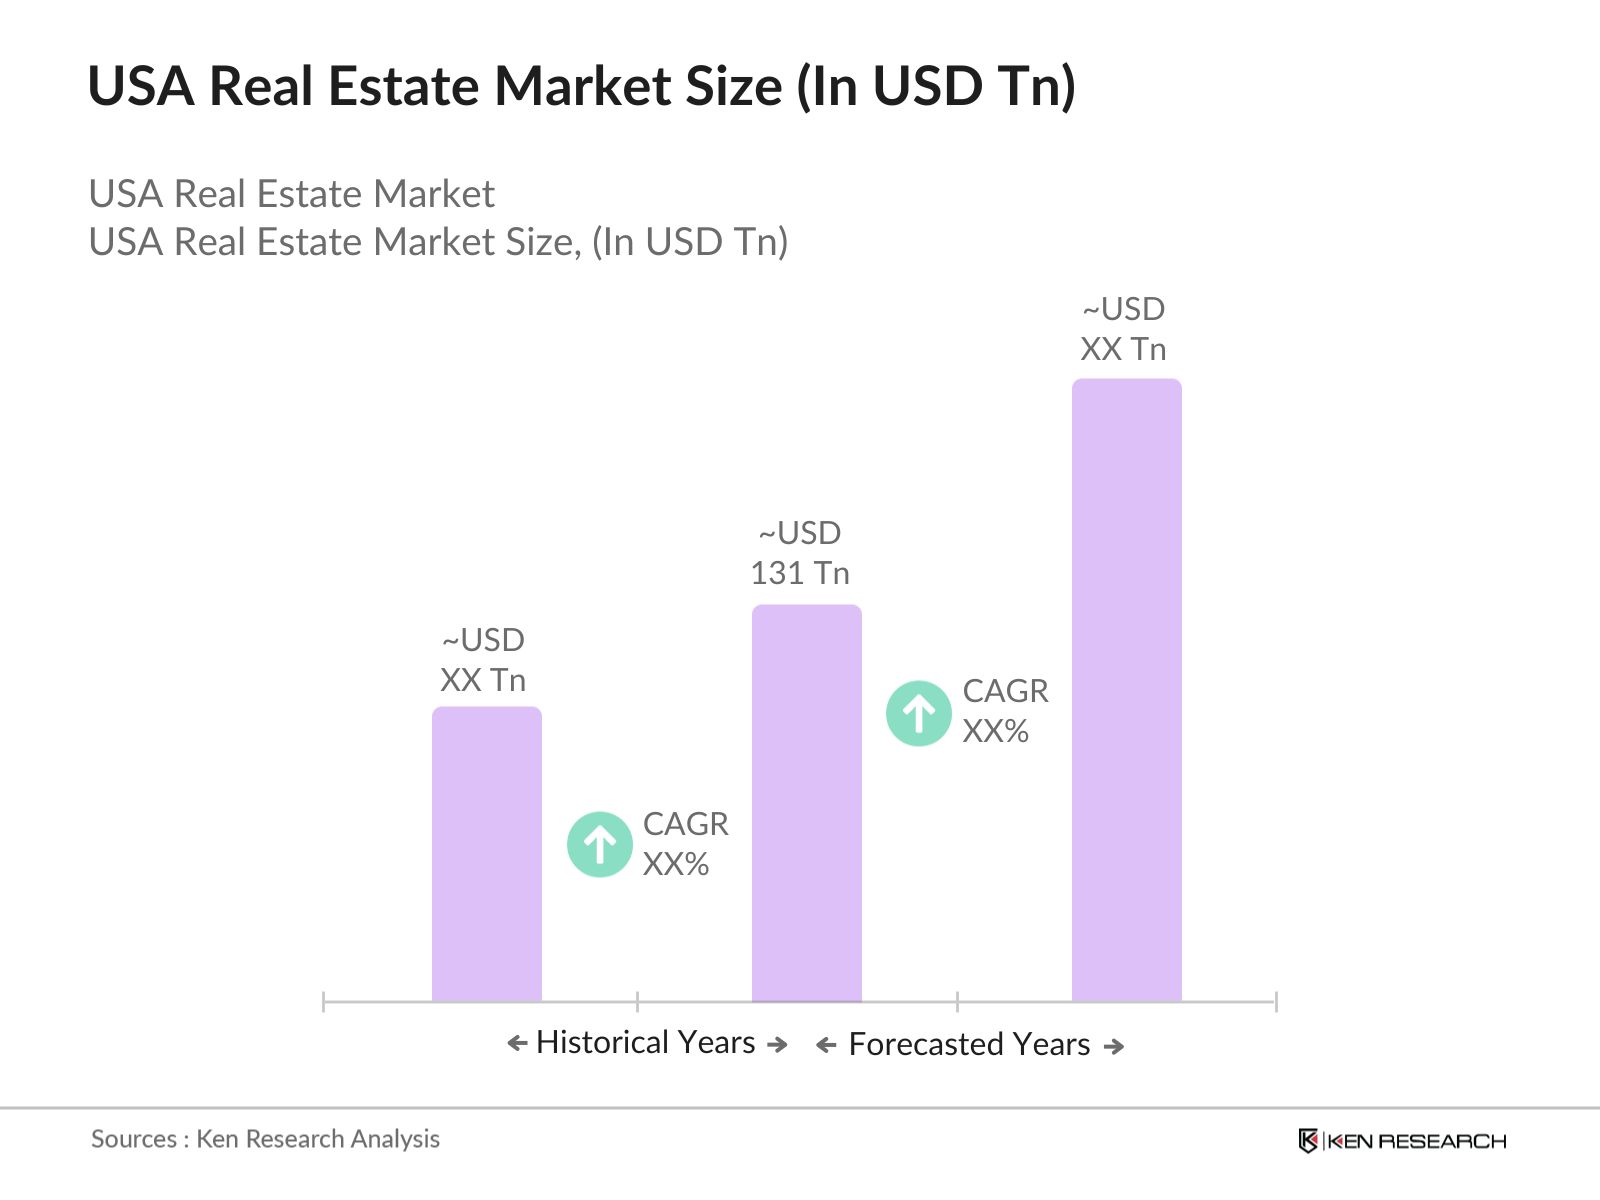
- The USA real estate market is valued at USD 131 trillion, based on a comprehensive analysis of residential, commercial, and industrial properties across the nation. This market is driven by several factors, including strong economic performance, a rising population, and a favorable mortgage interest rate environment. A significant portion of demand is coming from residential housing due to increased homeownership rates and the expansion of suburban and exurban areas. These drivers, coupled with robust investment in commercial real estate, sustain market growth.
- Cities such as New York, Los Angeles, and San Francisco dominate the market due to their large populations, thriving economies, and global financial importance. These cities attract high levels of foreign investment and are home to many Fortune 500 companies, further cementing their dominance in the real estate market. The urban infrastructure and economic activity make these cities prime locations for both commercial and residential properties.
- The Federal Housing Finance Agency (FHFA) raised loan limits in 2024, with the conforming loan limit for single-family homes increasing to $726,200. This policy adjustment helps buyers in high-cost areas like Washington, D.C., and San Francisco secure financing for properties that exceed previous loan limits. Additionally, FHA mortgage insurance programs continue to support first-time homebuyers, with 1.1 million homes insured under FHA programs in 2024, further increasing homeownership opportunities in regions with historically low homeownership rates.
USA Real Estate Market Segmentation
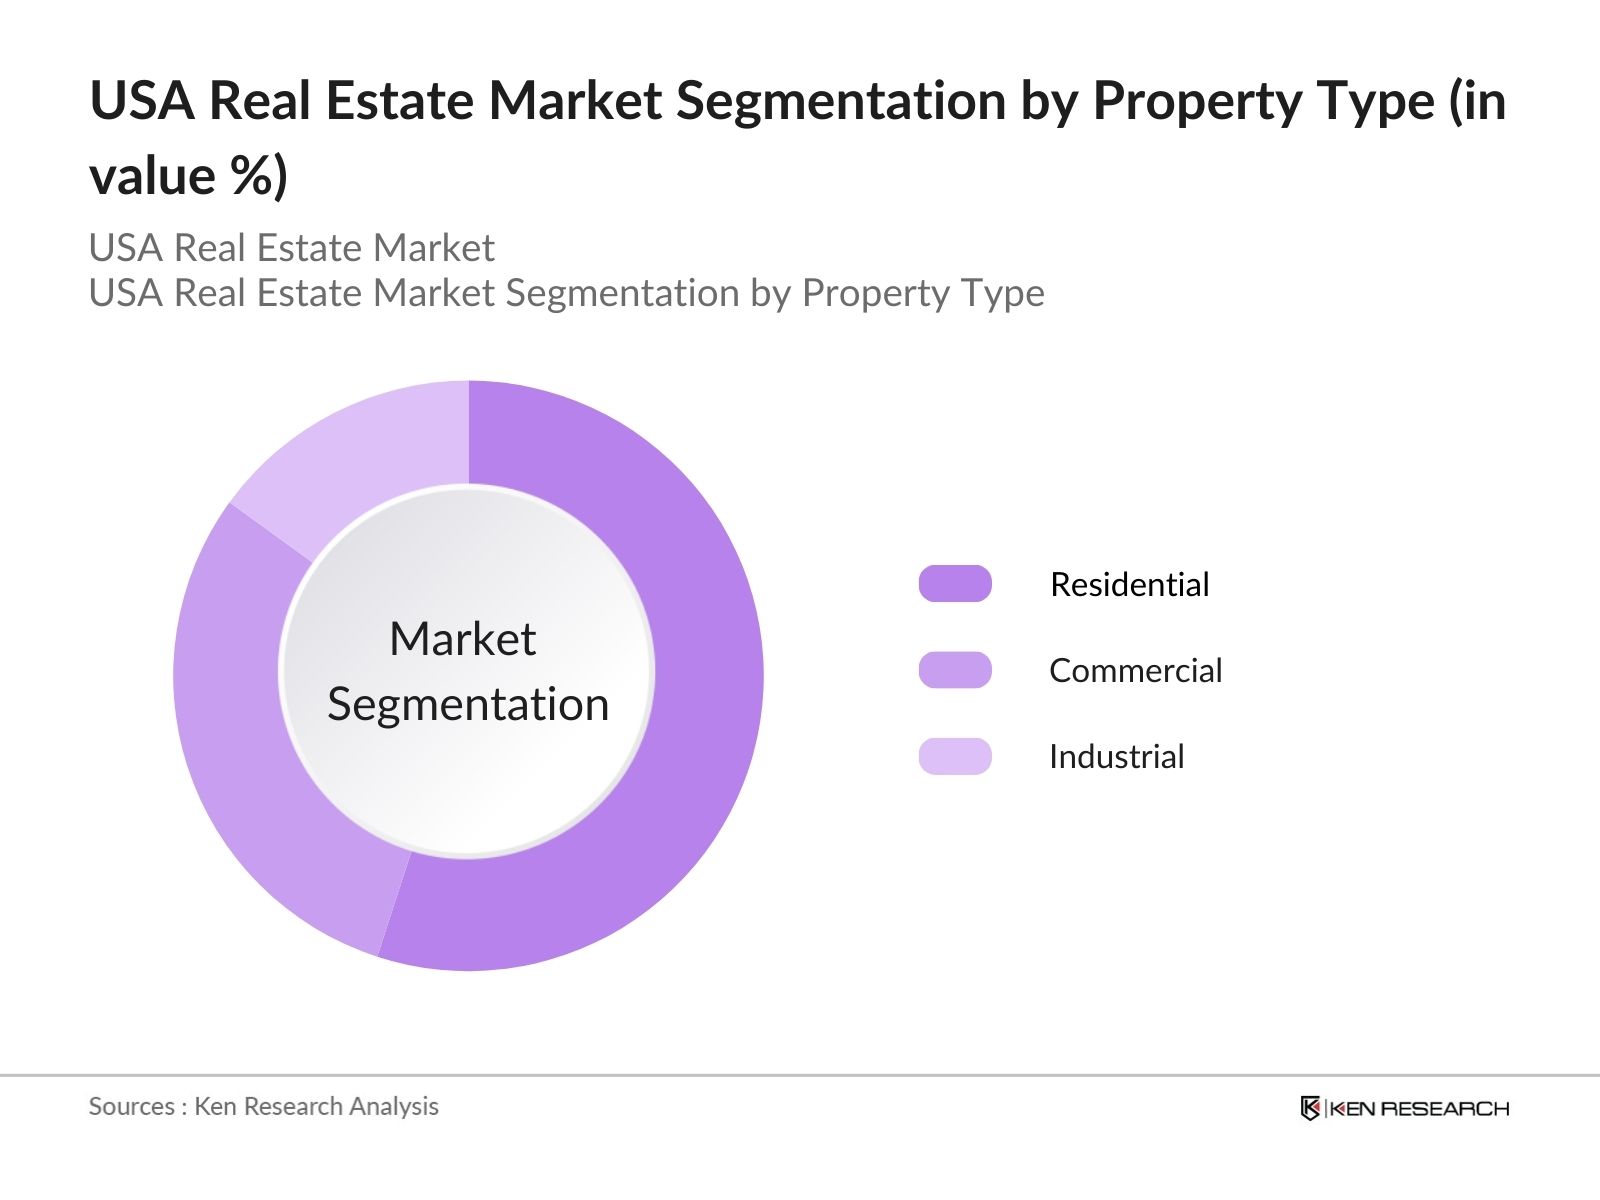
- By Property Type: The USA real estate market is segmented by property type into residential, commercial, and industrial properties. In recent years, the residential segment has maintained a dominant the market, driven by the increased demand for housing across both urban and suburban areas. This is particularly notable in states like Texas, Florida, and Arizona, where new housing developments are on the rise due to population growth and favorable tax policies. Furthermore, low mortgage rates have spurred home buying, further strengthening the residential sector's market share.
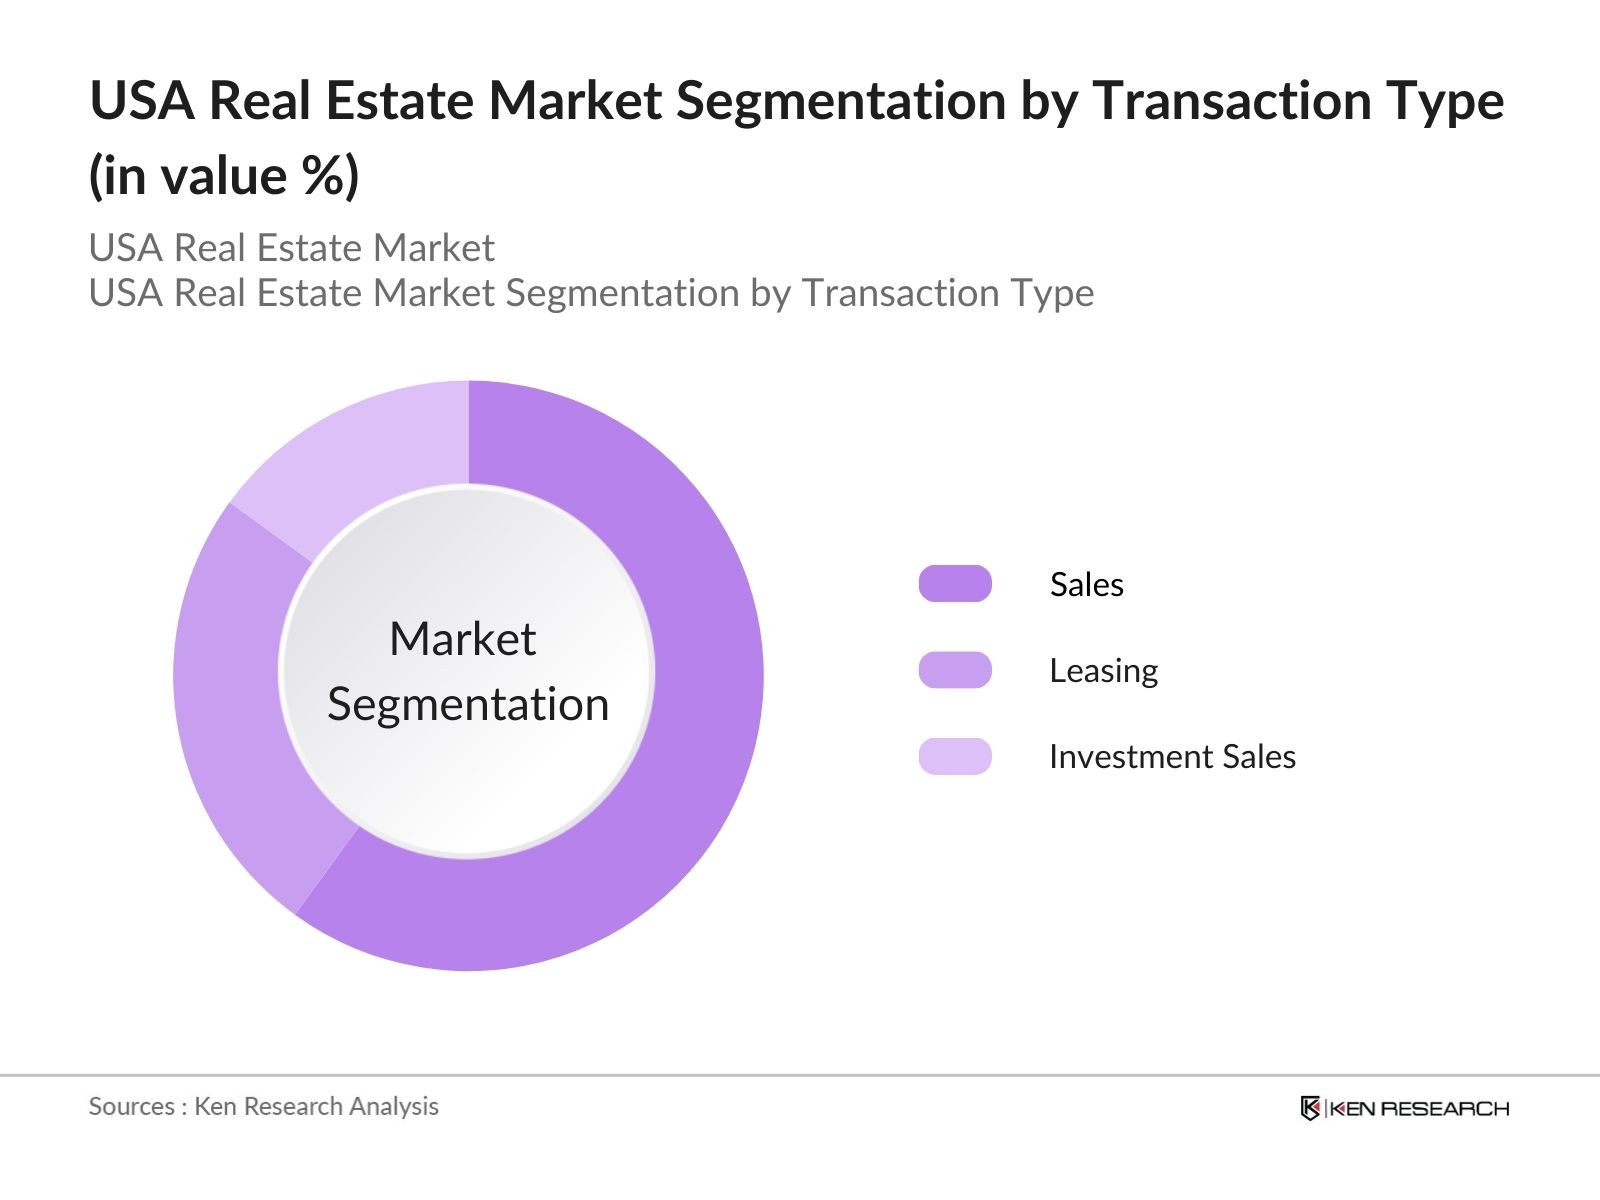
- By Transaction Type: The USA Real Estate Market is segmented by transaction type into sales, leasing, and investment sales. Sales dominate the market, as homeownership continues to be a critical financial goal for many Americans, particularly in suburban areas. The increase in real estate investment trust (REIT) activity, particularly in the multifamily residential and industrial sectors, has also driven this segment's growth. However, leasing remains a critical component in urban markets, especially for office and retail spaces, where businesses prefer long-term lease agreements over property purchases.
USA Real Estate Market Competitive Landscape
The USA real estate market is characterized by the presence of major national players, as well as regional firms with deep roots in specific markets. The consolidation of real estate firms in key metropolitan areas indicates a trend toward larger companies controlling significant portions of the market, especially in commercial and industrial real estate sectors. Key players like CBRE and JLL have made considerable investments in technology and sustainability, keeping them at the forefront of the competitive landscape.
|
Company Name |
Establishment Year |
Headquarters |
Market Focus |
Revenue (USD bn) |
Employees |
Properties Managed |
Geographic Reach |
Notable Projects |
Market Cap (USD bn) |
|
CBRE Group Inc. |
1906 |
Los Angeles, CA |
|||||||
|
Jones Lang LaSalle (JLL) |
1783 |
Chicago, IL |
|||||||
|
Cushman & Wakefield |
1917 |
Chicago, IL |
|||||||
|
Redfin Corporation |
2004 |
Seattle, WA |
|||||||
|
Zillow Group |
2006 |
Seattle, WA |
USA Real Estate Industry Analysis
Market Growth Drivers
- Population Growth and Urbanization: The U.S. population in 2024 is estimated at 334 million, with key urban areas such as New York and Los Angeles experiencing population densities of over 10,000 individuals per square mile. This urban concentration is driving housing demand in metro regions. Furthermore, internal migration patterns show an influx into Sun Belt cities like Austin and Phoenix, which grew by approximately 30,000 new residents each between 2022 and 2023, according to U.S. Census Bureau data. With continuous urbanization, this dynamic fosters long-term housing market growth by increasing demand for both residential and commercial real estate.
- Economic Expansion: The U.S. economy showed resilience in 2024, with a GDP of $25.9 trillion, according to the IMF. Unemployment has stabilized at 3.8% in mid-2024, leading to increased household incomes, now averaging $79,900 per year. This rising income bolsters homebuying potential, especially in suburban and rural areas. With the economy expanding and unemployment low, housing demand is rising, particularly for new constructions and higher-end residential units in areas with strong job markets, such as the tech-heavy West Coast cities and the Midwests industrial hubs.
- Low-Interest Rate Environment: In 2024, the Federal Funds Rate remains low at 3.25%, keeping mortgage rates around 6.7% for a 30-year fixed mortgage. This creates favorable conditions for homebuyers, particularly first-time buyers and those seeking to refinance existing loans. Lower borrowing costs are stimulating the real estate market by increasing affordability for potential homeowners. Federal Reserve policies are expected to maintain these relatively low rates, encouraging continued investment in residential and commercial properties, especially in regions like Texas and Florida where real estate markets are thriving.
Market Restraints
- Supply Chain Disruptions (Construction Costs, Labor Shortage): In 2024, U.S. construction costs surged, with materials such as lumber averaging $620 per thousand board feet, exacerbating housing shortages. Labor shortages in the construction sector, with 315,000 unfilled positions as per the Bureau of Labor Statistics, further strain the supply chain. These disruptions are delaying new housing projects and pushing up prices for both materials and labor, limiting the ability of developers to meet growing housing demands, particularly in high-demand urban centers like Dallas and Atlanta.
- Regulatory Hurdles (Zoning Restrictions, Permitting Delays): Zoning restrictions and permitting delays are major impediments in real estate development across the U.S. In cities like Seattle, the average time to secure building permits has increased to 14 months in 2024, limiting the pace of new developments. Zoning laws that restrict high-density construction further compound the issue, particularly in regions with stringent regulations like San Francisco and Washington D.C. These regulatory hurdles are constraining the housing supply at a time when demand is surging, pushing up prices and limiting affordable housing development.
USA Real Estate Market Future Outlook
Over the next five years, the USA real estate market is expected to exhibit significant growth, driven by sustained demand for residential properties, continued economic expansion, and increased foreign investment. Additionally, the adoption of smart home technologies, growth in the PropTech sector, and investments in sustainable infrastructure will likely drive future developments in both commercial and residential real estate. These trends will be supported by a stable interest rate environment and growing interest in suburban and exurban property markets, especially as remote work continues to reshape housing demand patterns.
Market Opportunities
- Growth in PropTech Solutions: The U.S. real estate market is witnessing rapid adoption of PropTech, with the number of smart homes expected to surpass 80 million by 2025, according to government projections. Digital brokerage platforms, which accounted for over $16 billion in transactions in 2023, are transforming home buying and selling processes. Increased reliance on technology is making real estate transactions more efficient, particularly in densely populated markets such as New York and Los Angeles. As PropTech continues to evolve, it opens new opportunities for improving efficiency in property management and real estate investments.
- Investment in Sustainable and Green Buildings: In 2024, over 12,500 buildings across the U.S. have achieved LEED certification, reflecting a significant trend towards sustainable development. Government programs like the Energy Efficiency Improvement Act are incentivizing developers to invest in green building technologies. Energy-efficient buildings in cities like Boston and San Francisco are seeing higher occupancy rates and rental premiums compared to traditional buildings. This growing trend toward sustainable real estate is fostering investment in energy-efficient housing and commercial properties, offering long-term cost savings and environmental benefits.
Scope of the Report
|
Segment |
Sub-segments |
|
By Property Type |
Residential, Commercial, Industrial, Land Development, Hospitality |
|
By Location |
Urban, Suburban, Exurban, Rural |
|
By Transaction Type |
Sales, Leasing, Investment Sales, REITs |
|
By Buyer Type |
First-Time Buyers, Real Estate Investors, International Buyers |
|
By Financing Type |
Mortgage Loans, Cash Transactions, Institutional Funding |
Products
Key Target Audience
Real Estate Developers
Investors and Venture Capitalist Firms
Government and Regulatory Bodies (U.S. Department of Housing and Urban Development, Federal Housing Finance Agency)
Real Estate Investment Trusts (REITs)
Private Equity Firms
Property Management Companies
Construction Companies
Mortgage Lenders and Banks
Time Period Captured in the Report:
Historical Period: 2018-2023
Base Year: 2023
Forecast Period: 2023-2028
Companies
Players Mentioned in the Report:
CBRE Group Inc.
Jones Lang LaSalle (JLL)
Cushman & Wakefield
Redfin Corporation
Zillow Group
Newmark Group Inc.
Colliers International
Marcus & Millichap Inc.
RE/MAX Holdings Inc.
Berkshire Hathaway HomeServices
Century 21 Real Estate LLC
Keller Williams Realty
Coldwell Banker Real Estate LLC
WeWork Companies LLC
Opendoor Technologies Inc.
Table of Contents
1. USA Real Estate Market Overview
1.1. Definition and Scope
1.2. Market Taxonomy
1.3. Key Real Estate Market Indicators
1.4. Market Growth Rate
1.5. Market Segmentation Overview
2. USA Real Estate Market Size (In USD Bn)
2.1. Historical Market Size
2.2. Year-On-Year Growth Analysis
2.3. Key Market Developments and Milestones
3. USA Real Estate Market Analysis
3.1. Growth Drivers
3.1.1. Population Growth and Urbanization (Population Density, Growth Rate, Migration Patterns)
3.1.2. Economic Expansion (GDP Growth, Unemployment Rate, Household Income)
3.1.3. Low-Interest Rate Environment (Federal Funds Rate, Mortgage Rates)
3.1.4. Government Support and Infrastructure Development (Tax Incentives, Zoning Laws, Federal Funding)
3.2. Market Challenges
3.2.1. Housing Affordability Crisis (Median Home Prices, Affordability Index)
3.2.2. Supply Chain Disruptions (Construction Costs, Labor Shortage)
3.2.3. Regulatory Hurdles (Zoning Restrictions, Permitting Delays)
3.3. Opportunities
3.3.1. Growth in PropTech Solutions (Smart Home Adoption, Digital Brokerage Platforms)
3.3.2. Investment in Sustainable and Green Buildings (LEED Certification, Energy Efficiency Standards)
3.3.3. Expansion in Suburban and Exurban Markets (Suburban Housing Development, Remote Work Trends)
3.4. Trends
3.4.1. Increased Investment in Multifamily Housing (Rental Occupancy Rates, Vacancy Rates)
3.4.2. Rise in Short-Term Rentals (Airbnb Listings, STR Regulations)
3.4.3. Adoption of Virtual Tours and Remote Transactions (Virtual Reality, Blockchain in Real Estate)
3.5. Government Regulations
3.5.1. Fair Housing Act Enforcement (Non-Discrimination Policies)
3.5.2. Mortgage Interest Deduction Policies (Tax Codes, Homeownership Benefits)
3.5.3. National Housing Finance Agency Guidelines (Loan Limits, Insurance Programs)
3.6. SWOT Analysis
3.7. Stakeholder Ecosystem (Developers, Brokers, Financial Institutions)
3.8. Porters Five Forces Analysis (Bargaining Power of Buyers, Competitive Rivalry)
3.9. Competitive Ecosystem
4. USA Real Estate Market Segmentation
4.1. By Property Type (In Value %)
4.1.1. Residential (Single-Family Homes, Multifamily Apartments)
4.1.2. Commercial (Office Buildings, Retail Spaces)
4.1.3. Industrial (Warehouses, Logistics Centers)
4.1.4. Land Development (Undeveloped Land, Agricultural Land)
4.1.5. Hospitality (Hotels, Resorts)
4.2. By Location (In Value %)
4.2.1. Urban
4.2.2. Suburban
4.2.3. Exurban
4.2.4. Rural
4.3. By Transaction Type (In Value %)
4.3.1. Sales
4.3.2. Leasing
4.3.3. Investment Sales
4.3.4. Real Estate Investment Trusts (REITs)
4.4. By Buyer Type (In Value %)
4.4.1. First-Time Buyers
4.4.2. Real Estate Investors
4.4.3. International Buyers
4.5. By Financing Type (In Value %)
4.5.1. Mortgage Loans
4.5.2. Cash Transactions
4.5.3. Institutional Funding
5. USA Real Estate Market Competitive Analysis
5.1. Detailed Profiles of Major Companies
5.1.1. CBRE Group Inc.
5.1.2. Jones Lang LaSalle Incorporated (JLL)
5.1.3. Cushman & Wakefield
5.1.4. Newmark Group Inc.
5.1.5. Marcus & Millichap Inc.
5.1.6. Colliers International
5.1.7. Redfin Corporation
5.1.8. Zillow Group
5.1.9. RE/MAX Holdings Inc.
5.1.10. Berkshire Hathaway HomeServices
5.1.11. Century 21 Real Estate LLC
5.1.12. Keller Williams Realty
5.1.13. Coldwell Banker Real Estate LLC
5.1.14. WeWork Companies LLC
5.1.15. Opendoor Technologies Inc.
5.2. Cross Comparison Parameters (No. of Properties Sold, Revenue, Market Share, No. of Offices, Employee Count, Inception Year, Headquarters)
5.3. Market Share Analysis
5.4. Strategic Initiatives (Partnerships, Technological Investments)
5.5. Mergers and Acquisitions
5.6. Investment Analysis
5.7. Venture Capital Funding
5.8. Government Grants and Subsidies
5.9. Private Equity Investments
6. USA Real Estate Market Regulatory Framework
6.1. Real Estate Licensing Regulations
6.2. Property Taxation Laws
6.3. Mortgage Lending Rules
6.4. Environmental and Zoning Laws
7. USA Real Estate Future Market Size (In USD Bn)
7.1. Future Market Size Projections
7.2. Key Factors Driving Future Market Growth
8. USA Real Estate Future Market Segmentation
8.1. By Property Type (In Value %)
8.2. By Location (In Value %)
8.3. By Transaction Type (In Value %)
8.4. By Buyer Type (In Value %)
8.5. By Financing Type (In Value %)
9. USA Real Estate Market Analysts Recommendations
9.1. TAM/SAM/SOM Analysis
9.2. Customer Cohort Analysis
9.3. Marketing Initiatives
9.4. White Space Opportunity Analysis
Disclaimer
Contact Us
Research Methodology
Step 1: Identification of Key Variables
The first step involved creating a detailed ecosystem map for the USA real estate market. Through extensive secondary research using reliable databases and proprietary sources, we identified the key variables that drive market growth, including demographic shifts, interest rates, and regulatory changes.
Step 2: Market Analysis and Construction
This phase focused on analyzing historical market data to understand the growth of the real estate market in key segments. We examined factors such as property type demand, transaction types, and geographic location. Data was verified by reviewing multiple industry reports and sources.
Step 3: Hypothesis Validation and Expert Consultation
Industry hypotheses were developed and validated through structured interviews with real estate professionals, including brokers and developers. These insights helped to refine the market analysis and added qualitative depth to the research findings.
Step 4: Research Synthesis and Final Output
The final step involved synthesizing data from various sources, including property developers and real estate management firms. This step ensured the accuracy of market size estimates and growth forecasts, providing a comprehensive view of the USA real estate market.
Frequently Asked Questions
01. How big is the USA Real Estate Market?
The USA real estate market is valued at USD 131 trillion, driven by steady population growth, urbanization, and favorable economic conditions, particularly in major metropolitan areas.
02. What are the challenges in the USA Real Estate Market?
Challenges include high property prices in major cities, rising construction costs, and supply chain disruptions, which have caused delays in the delivery of new projects.
03. Who are the major players in the USA Real Estate Market?
Key players in the market include CBRE Group Inc., JLL, Cushman & Wakefield, Redfin Corporation, and Zillow Group. These companies have a wide market reach and are influential in shaping the market trends.
04. What are the growth drivers of the USA Real Estate Market?
Growth is driven by factors such as the low interest rate environment, an expanding economy, and the shift towards remote work, which has increased demand for suburban and exurban properties.
Why Buy From Us?
 Framework")
What makes us stand out is that our consultants follows Robust, Refine and Result (RRR) methodology. i.e. Robust for clear definitions, approaches and sanity checking, Refine for differentiating respondents facts and opinions and Result for presenting data with story

We have set a benchmark in the industry by offering our clients with syndicated and customized market research reports featuring coverage of entire market as well as meticulous research and analyst insights.

While we don't replace traditional research, we flip the method upside down. Our dual approach of Top Bottom & Bottom Top ensures quality deliverable by not just verifying company fundamentals but also looking at the sector and macroeconomic factors.

With one step in the future, our research team constantly tries to show you the bigger picture. We help with some of the tough questions you may encounter along the way: How is the industry positioned? Best marketing channel? KPI's of competitors? By aligning every element, we help maximize success.

Our report gives you instant access to the answers and sources that other companies might choose to hide. We elaborate each steps of research methodology we have used and showcase you the sample size to earn your trust.

If you need any support, we are here! We pride ourselves on universe strength, data quality, and quick, friendly, and professional service.