
USA RV Vehicle Market Outlook to 2030
Region:North America
Author(s):Naman Rohilla
Product Code:KROD8495
December 2024
88
About the Report
USA RV Vehicle Market Overview
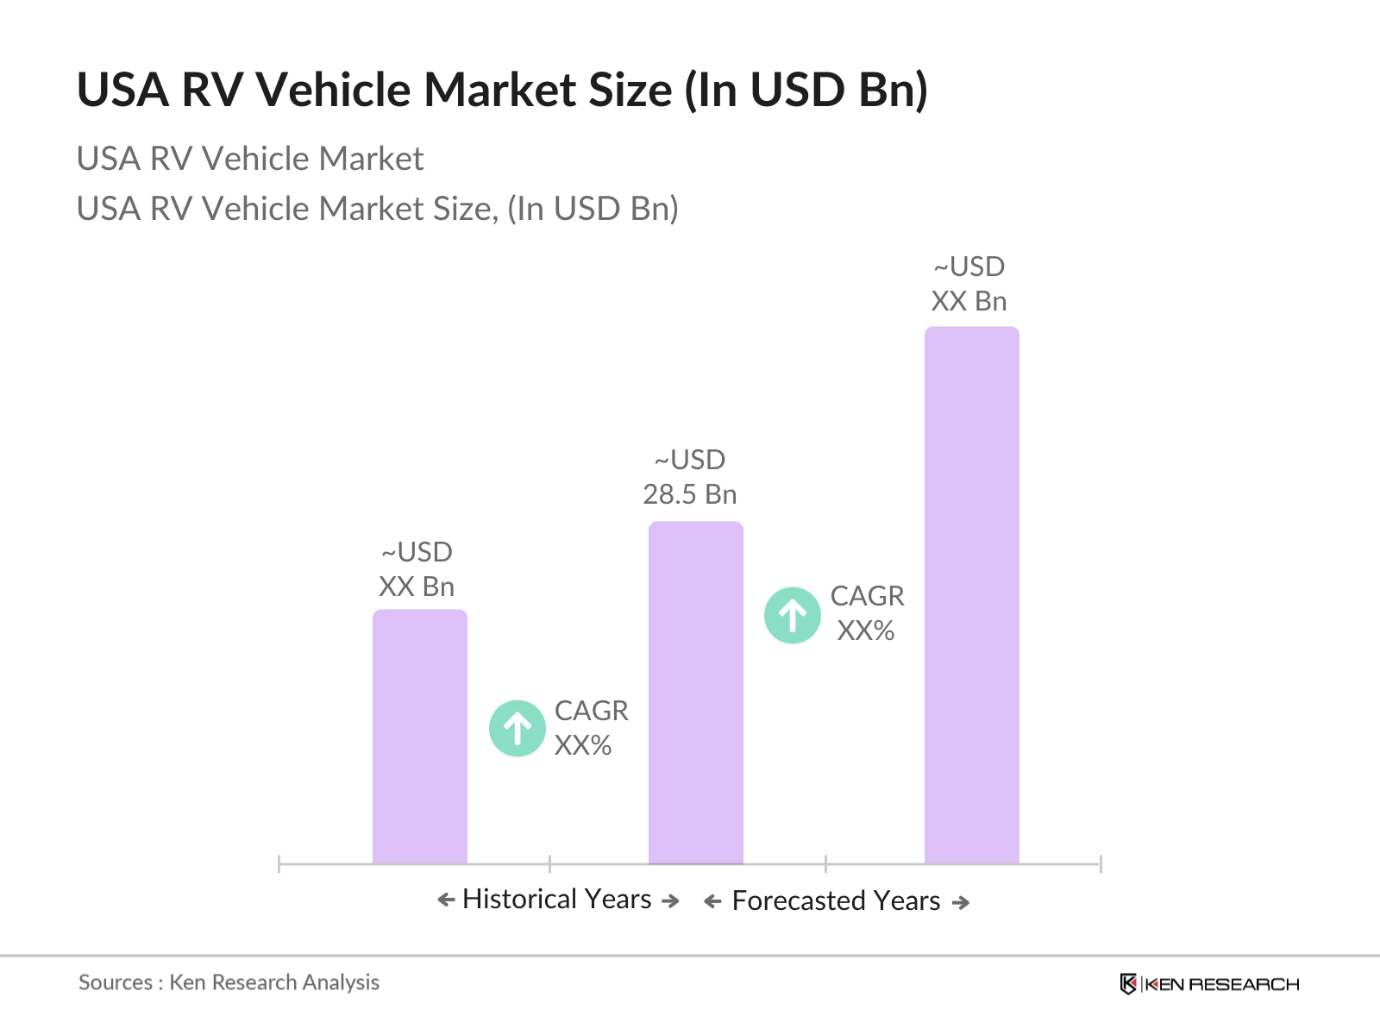
- The USA RV Vehicle Market, valued at USD 28.5 billion, has shown steady growth driven by a strong post-pandemic demand for outdoor travel and leisure options. This upward trajectory aligns with trends favouring domestic travel over international options, supported by factors such as enhanced interest in RV ownership and the expansion of RV rental platforms. Financing options and brand incentives further make RVs accessible to a broader consumer base, driving sustained growth within the market.
- Key regions in the U.S., particularly states like California, Texas, and Florida, lead in RV sales and demand due to their extensive road networks, diverse tourist destinations, and favourable climate conditions. These states also host major recreational vehicle events and hubs for RV manufacturers, fostering a supportive ecosystem for consistent demand and supply within the market.
- The Environmental Protection Agency mandates stringent emission standards for recreational vehicles, limiting permissible emissions to enhance air quality. These standards influence manufacturing choices, pushing for innovation in emission control systems and aligning RV production with national environmental goals.
USA RV Vehicle Market Segmentation
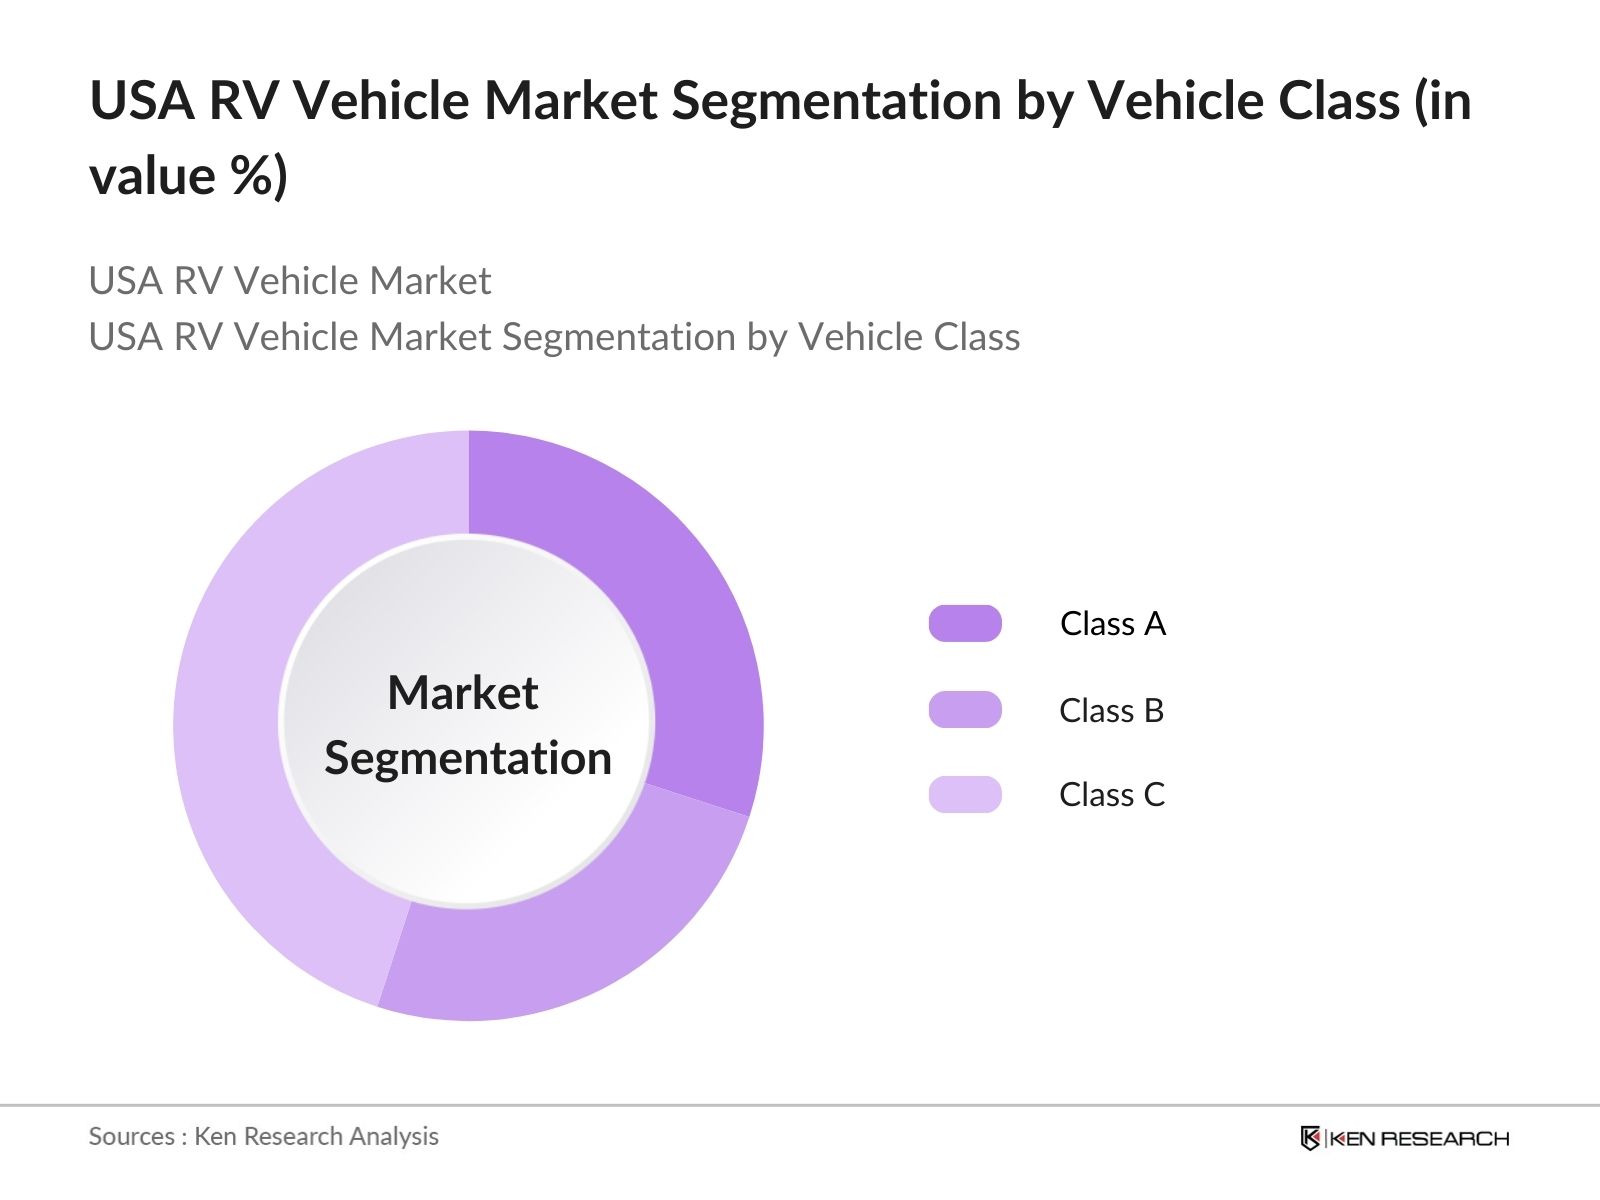
- By Vehicle Class: The USA RV Vehicle Market is segmented by vehicle class, including Class A, Class B, and Class C RVs. Recently, Class C RVs have demonstrated a dominant market share due to their affordability and convenient size, making them a popular choice for family travel. Brands like Thor Industries and Winnebago Industries have tapped into this preference, establishing strong positions in this segment through targeted product launches and marketing efforts emphasizing versatility and ease of handling.
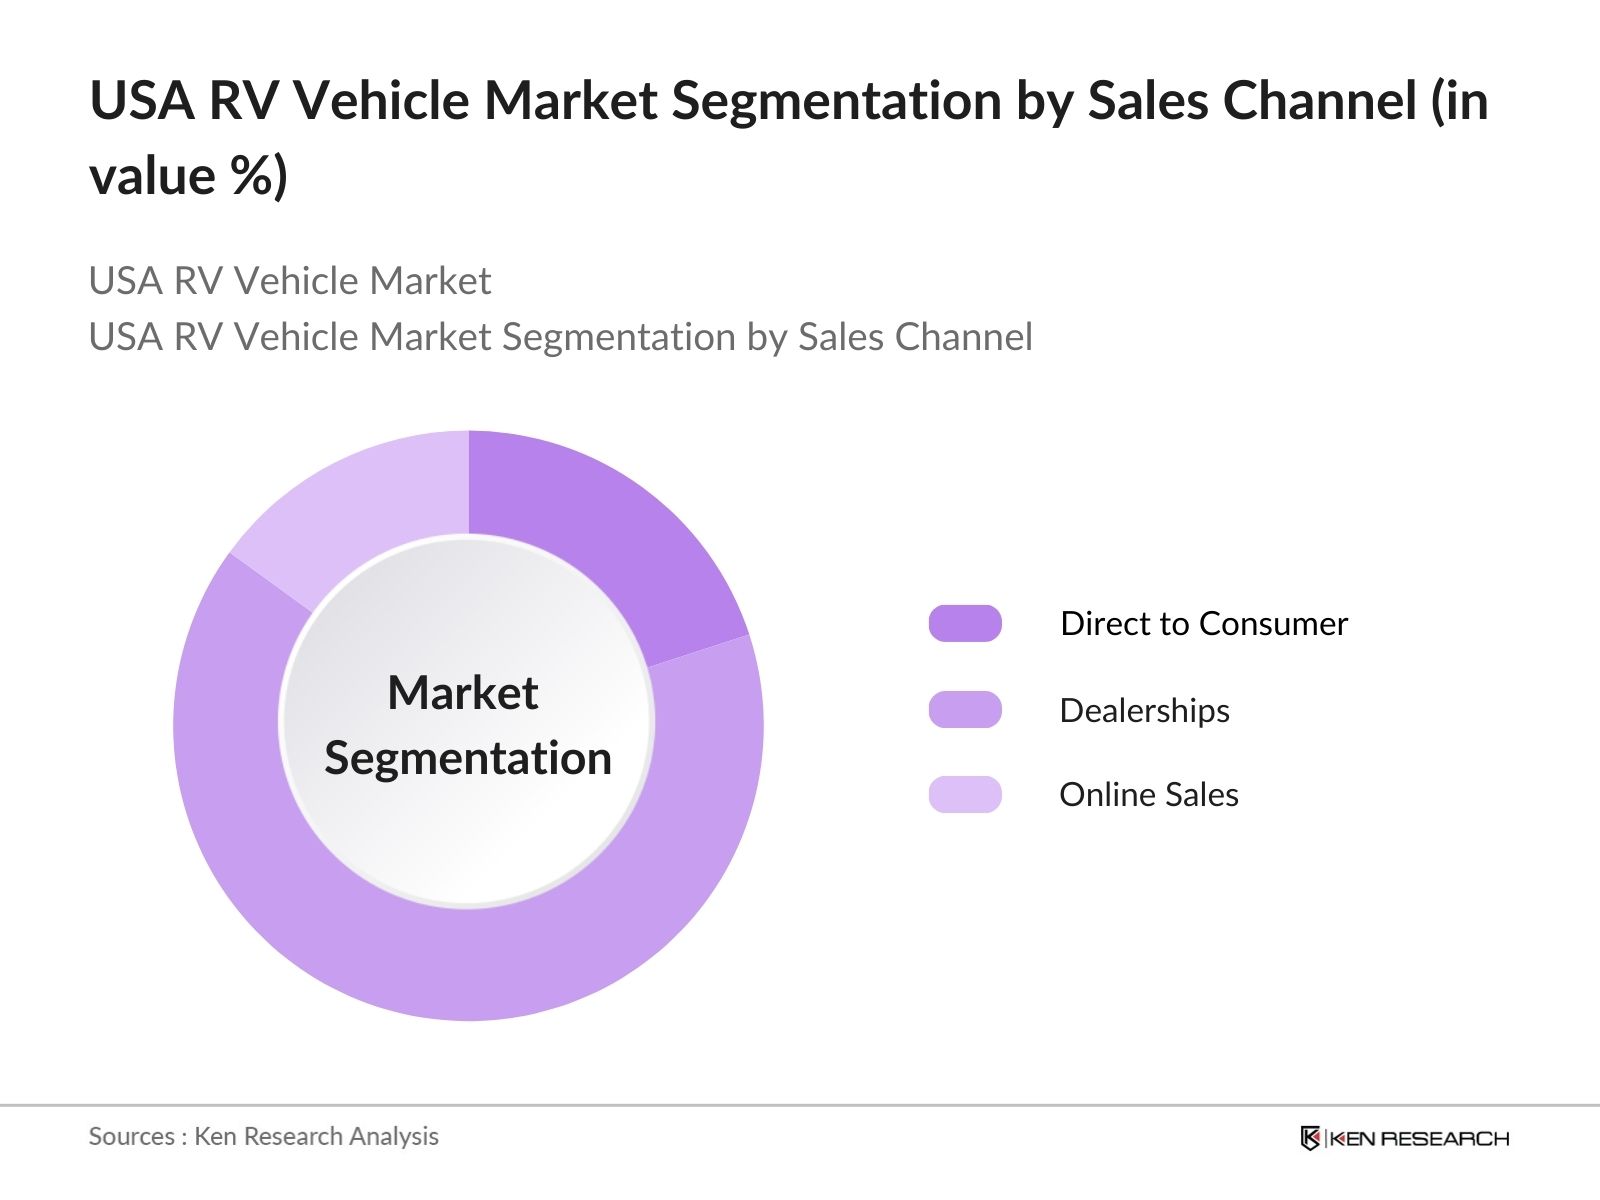
- By Sales Channel: The market further segments by sales channel, including Direct to Consumer, Dealerships, and Online Sales. Dealerships hold a major portion of market share due to the reliance on in-person inspections and financing options that often accompany RV purchases. Established dealership networks by companies such as Camping World and Lazydays contribute to this segments dominance, with substantial investments in showroom expansions, customer service, and financing support.
USA RV Vehicle Market Competitive Landscape
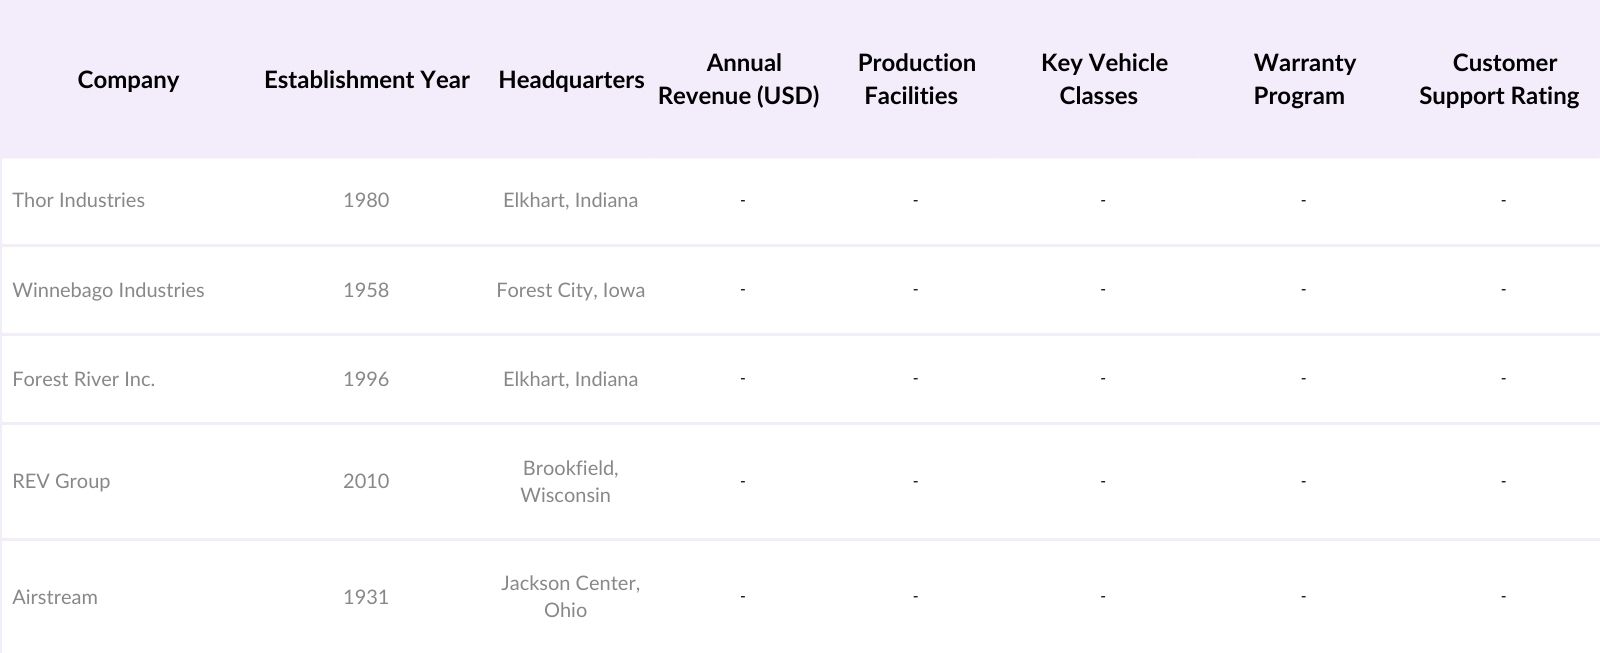
The USA RV Vehicle Market is shaped by prominent manufacturers, with a few dominant players leading the way in terms of production capacity, innovation, and consumer reach. Major manufacturers such as Thor Industries and Winnebago Industries exert substantial influence on the market through targeted investments, strong brand loyalty, and extensive dealership networks.
USA RV Vehicle Market Analysis
Market Growth Drivers
- Rise in Domestic Tourism: The U.S. tourism industry has witnessed a substantial increase in domestic travel, with 1.9 billion trips recorded in 2024, driven by shifting preferences toward local explorations, as per the National Travel and Tourism Office. As more travelers prioritize health safety and privacy, the RV market benefits from the ability of RVs to offer controlled environments compared to public travel modes. The increase in national park attendance, with over 300 million visits, also underscores the trend toward domestic, vehicle-based travel, including RVs. Source.
- Increasing Popularity of Remote Work: In 2024, remote work policies continued to grow, with over 34 million U.S. employees having flexible work options, according to the U.S. Bureau of Labor Statistics. This shift has created demand for adaptable travel solutions like RVs, allowing professionals to work remotely while traveling. RV sales correlate strongly with this demand for mobility and flexibility, catering to people who combine work and leisure without a fixed location.
- Consumer Preference for Family Travel Options: Family travel has emerged as a growth factor in RV demand, with AAA reporting that family-focused trips accounted for nearly 70% of domestic trips in 2024. RVs cater to family needs by providing space, comfort, and the flexibility to travel with family amenities, making them a favored choice among multi-member households seeking affordable family vacations.
Market Challenges
- High Initial Purchase Costs: RVs require a high initial investment, with average costs for new units reaching around $70,000, as noted by the U.S. Bureau of Economic Analysis in 2024. These upfront costs pose a barrier to market entry for budget-conscious consumers, especially in times of economic uncertainty. The high purchase price can deter younger, lower-income consumers, potentially limiting market reach.
- Maintenance and Operating Expenses: Maintenance costs for RVs remain a substantial expense, with the American Automobile Association estimating annual maintenance and repair costs averaging $1,500. Rising fuel costs, averaging $3.84 per gallon as per the U.S. Energy Information Administration, further add to RV operating expenses, posing a constraint on affordability and limiting travel frequency for budget-sensitive users.
USA RV Vehicle Market Future Outlook
Over the next five years, the USA RV Vehicle Market is anticipated to experience further growth, supported by continuous consumer interest in domestic travel, advancements in RV technology, and the introduction of electric RV options. Enhanced manufacturing processes and increased interest in eco-friendly RVs are expected to further accelerate the markets expansion. Additionally, rental platforms may play a larger role, contributing to accessibility and market penetration.
Market Opportunities
- Technological Upgrades: The push for electric RVs and autonomous technology is creating new market opportunities, especially as the U.S. Department of Energy allocates $400 million in funding for electric vehicle infrastructure. This initiative supports RV manufacturers aiming to transition to electric models, appealing to environmentally conscious consumers and potentially reducing long-term operating costs.
- Growth in Rental and Sharing Platforms: The U.S. rental market for RVs has grown, with 14 million rentals recorded in 2024, per the Department of Commerce. Rental platforms are capitalizing on this by offering diverse RV options, catering to users preferring short-term use over ownership. This growth trend in RV rentals supports consumer flexibility and affordability, expanding access to the RV lifestyle.
Scope of the Report
|
Vehicle Class |
Class A Class B Class C |
|
Usage Type |
Personal Ownership Rental and Leasing |
|
Sales Channel |
Direct to Consumer Dealerships Online Sales |
|
Fuel Type |
Gasoline Diesel Electric |
|
Region |
Northeast Midwest South West |
Products
Key Target Audience
RV Dealership Networks
Fleet Management Companies
Rental and Sharing Platforms
Banks and Financial Institutions
Financial Institutions (for RV Financing)
Manufacturers of Vehicle Components (chassis, engines)
Supplier Network (automotive parts, technology providers)
Investor and Venture Capitalist Firms
Government and Regulatory Bodies (Department of Transportation, EPA)
Companies
Players Mentioned in the Report
Thor Industries
Winnebago Industries
Forest River Inc.
REV Group
Airstream
Jayco
Tiffin Motorhomes
Newmar Corporation
Coachmen RV
Nexus RV
Table of Contents
1. USA RV Vehicle Market Overview
1.1 Definition and Scope
1.2 Market Taxonomy
1.3 Market Growth Rate (Price Trends, Demand Analysis)
1.4 Market Segmentation Overview
2. USA RV Vehicle Market Size (In USD Bn)
2.1 Historical Market Size
2.2 Year-On-Year Growth Analysis (Market Size by Class, Segment-Wise Growth)
2.3 Key Market Developments and Milestones (Legislation, Innovations, Brand Milestones)
3. USA RV Vehicle Market Analysis
3.1 Growth Drivers
3.1.1 Rise in Domestic Tourism
3.1.2 Increasing Popularity of Remote Work
3.1.3 Consumer Preference for Family Travel Options
3.1.4 Financing and Ownership Plans
3.2 Market Challenges
3.2.1 High Initial Purchase Costs
3.2.2 Maintenance and Operating Expenses
3.2.3 Economic Sensitivity
3.3 Opportunities
3.3.1 Technological Upgrades (Electric RVs, Autonomous Driving)
3.3.2 Growth in Rental and Sharing Platforms
3.3.3 International Expansion of US Manufacturers
3.4 Trends
3.4.1 Sustainable RV Manufacturing
3.4.2 Compact and Lightweight RV Demand
3.4.3 Integration of Smart Features (IoT)
3.5 Regulatory Environment
3.5.1 Emission Standards
3.5.2 Safety Standards (Roadworthiness, Accident Impact Regulations)
3.5.3 Consumer Protection Laws (Warranties, Resale Protections)
3.6 SWOT Analysis
3.7 Stakeholder Ecosystem (Dealerships, Service Providers, Manufacturers)
3.8 Porters Five Forces
3.9 Competitive Landscape (Pricing, Distribution Channels, Brand Positioning)
4. USA RV Vehicle Market Segmentation
4.1 By Vehicle Class (In Value %)
4.1.1 Class A
4.1.2 Class B
4.1.3 Class C
4.2 By Usage Type (In Value %)
4.2.1 Personal Ownership
4.2.2 Rental and Leasing
4.3 By Sales Channel (In Value %)
4.3.1 Direct to Consumer
4.3.2 Dealerships
4.3.3 Online Sales
4.4 By Fuel Type (In Value %)
4.4.1 Gasoline
4.4.2 Diesel
4.4.3 Electric
4.5 By Region (In Value %)
4.5.1 Northeast
4.5.2 Midwest
4.5.3 South
4.5.4 West
5. USA RV Vehicle Competitive Analysis
5.1 Detailed Profiles of Major Companies
5.1.1 Thor Industries
5.1.2 Winnebago Industries
5.1.3 Forest River Inc.
5.1.4 REV Group
5.1.5 Airstream
5.1.6 Jayco
5.1.7 Tiffin Motorhomes
5.1.8 Newmar Corporation
5.1.9 Coachmen RV
5.1.10 Nexus RV
5.1.11 American Coach
5.1.12 Keystone RV
5.1.13 Grand Design RV
5.1.14 Pleasure-Way Industries
5.1.15 Leisure Travel Vans
5.2 Cross-Comparison Parameters (Production Capacity, Unit Sales, Gross Profit Margins, Technological Advancements, Warranty Programs, Customer Satisfaction, Global Presence, Annual R&D Investment)
5.3 Market Share Analysis
5.4 Strategic Initiatives
5.5 Mergers and Acquisitions
5.6 Investment Analysis
5.7 Venture Capital Funding
5.8 Private Equity Investments
6. USA RV Vehicle Market Regulatory Framework
6.1 Environmental Standards (Emission Limits)
6.2 Compliance Requirements (DOT, NHTSA Standards)
6.3 Certification Processes (EPA, UL Standards)
7. USA RV Vehicle Future Market Size (In USD Bn)
7.1 Future Market Size Projections
7.2 Key Factors Driving Future Market Growth
8. USA RV Vehicle Future Market Segmentation
8.1 By Vehicle Class (In Value %)
8.2 By Usage Type (In Value %)
8.3 By Sales Channel (In Value %)
8.4 By Fuel Type (In Value %)
8.5 By Region (In Value %)
9. USA RV Vehicle Market Analysts Recommendations
9.1 TAM/SAM/SOM Analysis
9.2 Customer Cohort Analysis
9.3 Marketing Initiatives
9.4 White Space Opportunity Analysis
Disclaimer Contact UsResearch Methodology
Step 1: Identification of Key Variables
The research begins by identifying critical variables influencing the U.S. RV Vehicle Market. This involves mapping the market ecosystem, including manufacturers, distributors, and consumers, supported by in-depth desk research to establish foundational market dynamics.
Step 2: Market Analysis and Construction
In this phase, historical data related to market size, production volumes, and consumer demographics are analyzed. This evaluation provides insights into market penetration, consumer preferences, and trends over the past five years.
Step 3: Hypothesis Validation and Expert Consultation
Key hypotheses are formulated and validated through expert consultations across the RV industry, including direct interviews with manufacturing executives, dealership managers, and technology providers, which substantiate the data collected from secondary research.
Step 4: Research Synthesis and Final Output
The concluding step synthesizes data from primary and secondary sources to produce a comprehensive, accurate analysis of the USA RV Vehicle Market. Final insights include validation from industry experts, covering product segments, consumer behaviors, and projected trends.
Frequently Asked Questions
01. How big is the USA RV Vehicle Market?
The USA RV Vehicle Market is valued at USD 28.5 billion, fueled by increasing consumer interest in domestic travel and a favorable economic climate for vehicle financing options.
02. What are the challenges in the USA RV Vehicle Market?
Challenges include high initial purchasing costs, ongoing maintenance expenses, and sensitivity to economic conditions, which may affect the affordability and appeal of RV ownership.
03. Who are the major players in the USA RV Vehicle Market?
Key players include Thor Industries, Winnebago Industries, Forest River Inc., REV Group, and Airstream, who dominate due to extensive production capabilities and established dealership networks.
04. What factors drive growth in the USA RV Vehicle Market?
Growth drivers include the popularity of remote work, enhanced interest in domestic travel, and accessible financing options, which make RVs appealing for a broader range of consumers.
Why Buy From Us?
 Framework")
What makes us stand out is that our consultants follows Robust, Refine and Result (RRR) methodology. i.e. Robust for clear definitions, approaches and sanity checking, Refine for differentiating respondents facts and opinions and Result for presenting data with story

We have set a benchmark in the industry by offering our clients with syndicated and customized market research reports featuring coverage of entire market as well as meticulous research and analyst insights.

While we don't replace traditional research, we flip the method upside down. Our dual approach of Top Bottom & Bottom Top ensures quality deliverable by not just verifying company fundamentals but also looking at the sector and macroeconomic factors.

With one step in the future, our research team constantly tries to show you the bigger picture. We help with some of the tough questions you may encounter along the way: How is the industry positioned? Best marketing channel? KPI's of competitors? By aligning every element, we help maximize success.

Our report gives you instant access to the answers and sources that other companies might choose to hide. We elaborate each steps of research methodology we have used and showcase you the sample size to earn your trust.

If you need any support, we are here! We pride ourselves on universe strength, data quality, and quick, friendly, and professional service.