
USA Sales Performance Management Market Outlook to 2030
Region:North America
Author(s):Naman Rohilla
Product Code:KROD10742
December 2024
84
About the Report
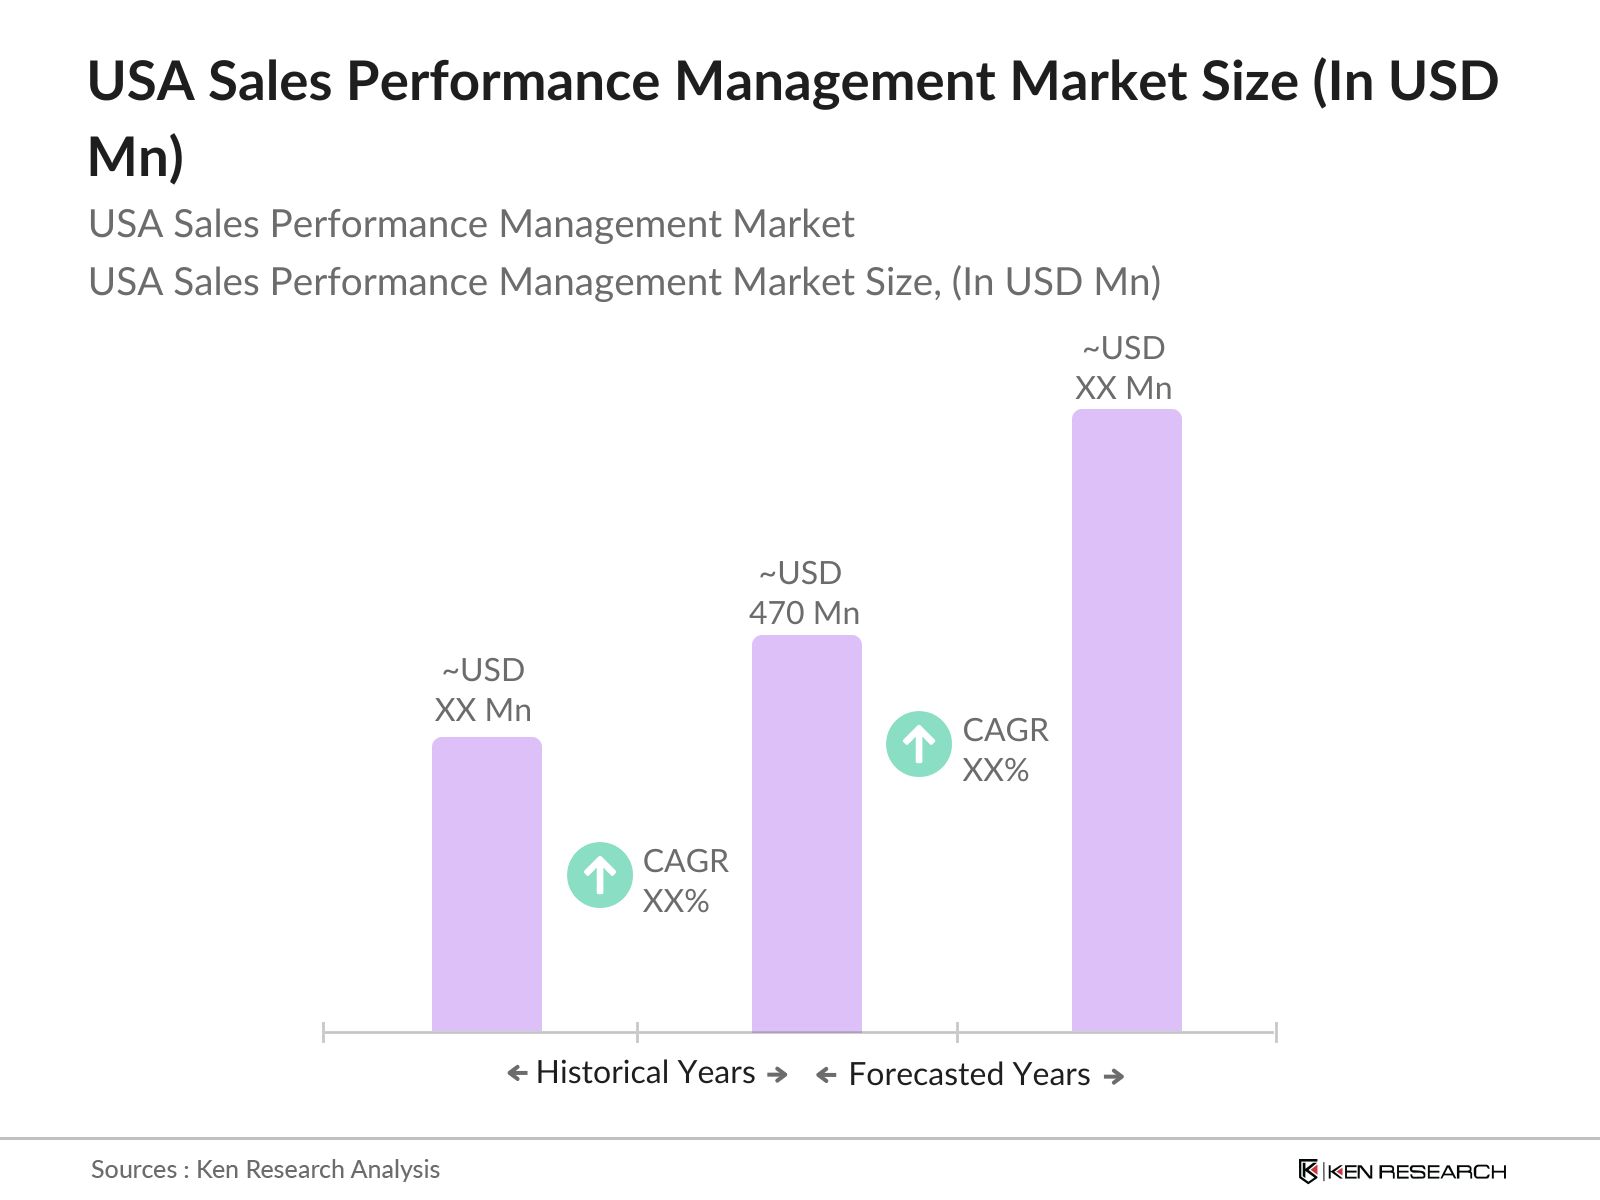
USA Sales Performance Management Market Overview
- The USA Sales Performance Management (SPM) market is valued at USD 470 million, based on a five-year historical analysis. This growth is primarily driven by the increasing emphasis on sales productivity and the adoption of advanced technology solutions. Organizations are leveraging SPM tools to enhance performance tracking, incentivize sales teams, and optimize operational efficiency. Furthermore, the rising demand for cloud-based SPM solutions is propelling market expansion, as businesses seek to streamline sales processes and improve data-driven decision-making.
- The dominant regions within the USA SPM market include metropolitan areas such as New York, San Francisco, and Chicago. These cities thrive due to their concentration of corporate headquarters and technology companies that invest heavily in sales optimization tools. Additionally, the presence of a skilled workforce and advanced IT infrastructure further enhances the market's attractiveness in these locations, fostering a competitive environment for SPM providers to innovate and deliver tailored solutions.
- Compliance with industry standards is a crucial factor influencing the SPM market. In 2022, regulatory bodies implemented various compliance standards affecting data management and sales practices. Companies found themselves needing to align their SPM systems with these regulations to avoid penalties and maintain operational integrity. Approximately 45% of businesses reported investing in compliance training and system updates to meet new standards, highlighting the impact of regulatory compliance on sales performance strategies. As regulatory scrutiny increases, organizations must prioritize compliance in their sales performance management initiatives.
USA Sales Performance Management Market Segmentation
- By Component: The USA Sales Performance Management market is segmented by component into solutions and services. Solutions account for a significant portion of the market, primarily driven by incentive compensation management systems. These systems have become increasingly essential as organizations recognize the need for effective sales force management to drive performance and revenue growth.

- By Deployment Type: The USA Sales Performance Management market is also segmented by deployment type into on-premises and cloud-based solutions. Cloud-based deployment has gained traction, accounting for a larger share of the market. This trend reflects a broader shift towards digital transformation across industries, where businesses seek agility and efficiency in their operations.

USA Sales Performance Management Market Competitive Landscape
The USA Sales Performance Management market is characterized by the presence of several major players who dominate the competitive landscape. Companies like SAP, Oracle, and Anaplan are at the forefront, utilizing their robust technology infrastructures and expansive service offerings to capture significant market share. The consolidation of these key players reflects their ability to influence market trends and set benchmarks for innovation.

USA SPM Market Analysis
Market Growth Drivers
- Increased Emphasis on Sales Optimization: The increasing demand for sales analytics tools reflects a growing recognition of their importance in enhancing organizational efficiency and effectiveness. In the United States, the productivity of labor, measured as output per hour, has shown an upward trend, reaching about $73.22 in 2022, a clear indicator of the value placed on optimizing sales processes. This demand is fueled by businesses recognizing the need to leverage data to make informed decisions, improve sales strategies, and enhance customer engagement. Moreover, organizations investing in sales optimization report a notable increase in revenue, further driving the adoption of advanced sales analytics tools.
- Technological Advancements: Technological advancements, particularly in artificial intelligence (AI), machine learning (ML), and cloud computing, are revolutionizing Sales Performance Management (SPM) solutions. As of 2023, the adoption of cloud computing in enterprises is projected to reach over 85% of all IT budgets, a significant increase from previous years. These technologies enable businesses to automate sales processes, derive insights from data, and enhance decision-making capabilities. Additionally, the integration of AI and ML in sales tools has been linked to a potential increase in sales productivity by up to 50%, showcasing the transformative impact of technology on sales performance management.
- Rise in Hybrid and Remote Work Models: The shift toward hybrid and remote work models has necessitated the need for robust SPM solutions that facilitate remote collaboration and performance tracking. In 2023, approximately 30% of U.S. employees were working in hybrid models, while around 20% were fully remote. This evolution in work culture emphasizes the need for technology that supports sales teams operating from diverse locations. Companies are increasingly investing in digital tools to manage remote teams effectively, leading to enhanced sales processes and improved accountability. As remote work becomes the norm, the demand for innovative SPM solutions that cater to these models continues to grow.
Market Challenges
- Complex Integration with CRM/ERP Systems: Integrating Sales Performance Management systems with existing Customer Relationship Management (CRM) and Enterprise Resource Planning (ERP) systems poses a significant challenge for organizations. As of 2023, nearly 40% of businesses reported difficulties in achieving seamless integration, which can lead to operational inefficiencies. The complexity of different software platforms often results in increased implementation times and costs. Additionally, a study revealed that organizations faced an average downtime of over 10 days during integration phases, underscoring the challenges associated with aligning SPM systems with existing infrastructure.
- High Implementation Costs: The financial burden associated with implementing advanced SPM solutions can be a barrier for many organizations. In 2022, the average cost of deploying a comprehensive SPM solution was estimated at around $200,000 per organization. This figure includes software costs, training, and ongoing maintenance, making it a substantial investment, particularly for small to medium enterprises. Furthermore, ongoing operational costs can add an additional 15-20% annually, impacting budget allocations and financial planning. The perceived high costs deter many businesses from adopting necessary tools, thus hampering their ability to optimize sales performance effectively.
USA SPM Market Future Outlook
Over the next five years, the USA Sales Performance Management market is expected to witness growth driven by continuous advancements in technology, the increasing demand for data analytics, and the ongoing shift towards digital transformation in sales processes. As organizations recognize the critical importance of effective sales management strategies, investment in SPM solutions is anticipated to rise, fostering an environment of innovation and competition among key market players. The convergence of artificial intelligence and machine learning within SPM tools will further enhance their capabilities, enabling companies to derive actionable insights and optimize their sales operations.
Market Opportunities
- Increased Adoption of AI & ML Solutions: The current landscape shows a opportunity for the adoption of AI and ML solutions within SPM tools. In 2023, over 40% of companies reported plans to invest in AI-driven sales tools, indicating a strong trend toward leveraging technology for improved decision-making and efficiency. With AI's capability to analyze vast datasets quickly, organizations are likely to see enhanced sales forecasting accuracy and customer insights. The growing emphasis on data-driven strategies positions AI and ML as essential components of future SPM systems, offering businesses a pathway to optimize their sales processes and performance.
- Expansion of Sales Performance Tools in SMEs: Small and medium enterprises (SMEs) are increasingly recognizing the value of Sales Performance Management tools, creating significant growth opportunities. As of 2022, SMEs accounted for approximately 99.9% of all U.S. businesses, yet many lack access to sophisticated sales tools. Current statistics indicate that nearly 50% of SMEs plan to invest in sales performance tools in the next year, seeking to enhance productivity and competitiveness. This shift presents a lucrative opportunity for solution providers to cater to this underserved market segment and drive innovation tailored to SME needs.
Scope of the Report
|
Segment |
Sub-segments |
|
Component |
- Solutions: Incentive Compensation Management, Territory Management, Sales Analytics, Sales Planning and Monitoring |
|
Deployment Type |
- On-premises |
|
Organization Size |
- SMEs |
|
Industry Vertical |
- BFSI |
|
Region |
- Northeast |
Products
Key Target Audience
Investors and Venture Capitalist Firms
Government and Regulatory Bodies (e.g., U.S. Securities and Exchange Commission)
Sales and Marketing Executives
Business Development Managers
C-Level Executives
IT Decision Makers
Financial Analysts
Industry Analysts
Companies
Players Mentioned in the Report
SAP
Oracle
Anaplan
Xactly
Varicent
NICE Systems
Salesforce
Performio
Incentives Solutions
CallidusCloud
Table of Contents
1. USA SPM Market Overview
1.1. Definition and Scope
1.2. Market Taxonomy
1.3. Market Growth Rate
1.4. Market Segmentation Overview
2. USA SPM Market Size (In USD Bn)
2.1. Historical Market Size
2.2. Year-On-Year Growth Analysis
2.3. Key Market Developments and Milestones
3. USA SPM Market Analysis
3.1. Growth Drivers
3.1.1. Increased Emphasis on Sales Optimization (Increased demand for sales analytics tools)
3.1.2. Technological Advancements (Use of AI, ML, and Cloud in SPM solutions)
3.1.3. Rise in Hybrid and Remote Work Models
3.2. Market Challenges
3.2.1. Complex Integration with CRM/ERP Systems
3.2.2. High Implementation Costs
3.2.3. Data Privacy and Security Concerns
3.3. Opportunities
3.3.1. Increased Adoption of AI & ML Solutions
3.3.2. Expansion of Sales Performance Tools in SMEs
3.3.3. Growth in Mobile and Remote Sales Capabilities
3.4. Trends
3.4.1. Shift Toward Cloud-based SPM Solutions
3.4.2. Increased Focus on Sales Coaching and Training
3.4.3. Rise in Data-driven Sales Strategies
3.5. Government Regulation
3.5.1. Industry Compliance Standards
3.5.2. Data Security Regulations
3.6. SWOT Analysis
3.7. Stakeholder Ecosystem
3.8. Porters Five Forces
3.9. Competitive Ecosystem
4. USA SPM Market Segmentation
4.1. By Component (In Value %)
4.1.1. Solutions (Incentive Compensation Management, Territory Management, Sales Analytics)
4.1.2. Services (Consulting, Integration & Implementation, Training & Education)
4.2. By Deployment Type (In Value %)
4.2.1. On-premises
4.2.2. Cloud
4.3. By Organization Size (In Value %)
4.3.1. SMEs
4.3.2. Large Enterprises
4.4. By Industry Vertical (In Value %)
4.4.1. BFSI
4.4.2. Retail
4.4.3. Healthcare
4.4.4. IT & Telecom
4.4.5. Others
4.5. By Region (In Value %)
4.5.1. Northeast
4.5.2. Midwest
4.5.3. South
4.5.4. West
5. USA SPM Market Competitive Analysis
5.1. Detailed Profiles of Major Companies
5.1.1. SAP SE
5.1.2. Oracle
5.1.3. NICE
5.1.4. Anaplan, Inc.
5.1.5. Xactly
5.1.6. Performio
5.1.7. Varicent
5.1.8. beqom
5.1.9. Salesforce
5.1.10. IBM
5.1.11. Microsoft
5.1.12. CallidusCloud (SAP)
5.1.13. Optymyze
5.1.14. Incentive Solutions
5.1.15. Synygy
5.2. Cross Comparison Parameters (Market Presence, Revenue, Employee Count, Key Markets, Product Range, Customer Base, R&D Investment, Strategic Initiatives)
5.3. Market Share Analysis
5.4. Strategic Initiatives (Partnerships, Acquisitions, Product Launches)
5.5. Investment Analysis
5.6. Mergers and Acquisitions
5.7. Venture Capital and Private Equity Involvement
5.8. Government Grants
6. USA SPM Market Regulatory Framework
6.1. Compliance Requirements
6.2. Industry Standards and Certifications
6.3. Data Protection Laws and Regulations
7. Future Market Size of USA SPM Market (In USD Bn)
7.1. Forecasted Market Size Projections
7.2. Key Factors Driving Future Market Growth
8. Future Market Segmentation
8.1. By Component (In Value %)
8.2. By Deployment Type (In Value %)
8.3. By Organization Size (In Value %)
8.4. By Industry Vertical (In Value %)
8.5. By Region (In Value %)
9. USA SPM Market Analysts Recommendations
9.1. TAM/SAM/SOM Analysis
9.2. Customer Cohort Analysis
9.3. Marketing Initiatives
9.4. White Space Opportunity Analysis
Disclaimer Contact UsResearch Methodology
Step 1: Identification of Key Variables
The initial phase involves constructing an ecosystem map encompassing all major stakeholders within the USA Sales Performance Management market. This step is underpinned by extensive desk research, utilizing a combination of secondary and proprietary databases to gather comprehensive industry-level information. The primary objective is to identify and define the critical variables that influence market dynamics.
Step 2: Market Analysis and Construction
In this phase, we will compile and analyze historical data pertaining to the USA Sales Performance Management market. This includes assessing market penetration, the ratio of marketplaces to service providers, and the resultant revenue generation. Furthermore, an evaluation of service quality statistics will be conducted to ensure the reliability and accuracy of the revenue estimates.
Step 3: Hypothesis Validation and Expert Consultation
Market hypotheses will be developed and subsequently validated through computer-assisted telephone interviews (CATIs) with industry experts representing a diverse array of companies. These consultations will provide valuable operational and financial insights directly from industry practitioners, which will be instrumental in refining and corroborating the market data.
Step 4: Research Synthesis and Final Output
The final phase involves direct engagement with multiple sales performance management software manufacturers to acquire detailed insights into product segments, sales performance, consumer preferences, and other pertinent factors. This interaction will serve to verify and complement the statistics derived from the bottom-up approach, thereby ensuring a comprehensive, accurate, and validated analysis of the USA Sales Performance Management market.
Frequently Asked Questions
01. How big is the USA Sales Performance Management market?
The USA Sales Performance Management market is valued at USD 470 million, driven by the increasing need for sales optimization and technological advancements in performance management solutions.
02. What are the challenges in the USA Sales Performance Management market?
Challenges include complexities in integrating new solutions with existing systems, data privacy concerns, and the high costs associated with implementation and maintenance of SPM systems.
03. Who are the major players in the USA Sales Performance Management market?
Key players include SAP, Oracle, Anaplan, Xactly, and Varicent. These companies dominate the market due to their extensive product offerings, strong brand reputation, and continuous innovation in sales management technologies.
04. What are the growth drivers of the USA Sales Performance Management market?
Growth drivers include the increasing emphasis on data-driven decision-making, the shift towards cloud-based solutions, and the growing demand for automated sales processes to enhance efficiency and productivity.
Why Buy From Us?
 Framework")
What makes us stand out is that our consultants follows Robust, Refine and Result (RRR) methodology. i.e. Robust for clear definitions, approaches and sanity checking, Refine for differentiating respondents facts and opinions and Result for presenting data with story

We have set a benchmark in the industry by offering our clients with syndicated and customized market research reports featuring coverage of entire market as well as meticulous research and analyst insights.

While we don't replace traditional research, we flip the method upside down. Our dual approach of Top Bottom & Bottom Top ensures quality deliverable by not just verifying company fundamentals but also looking at the sector and macroeconomic factors.

With one step in the future, our research team constantly tries to show you the bigger picture. We help with some of the tough questions you may encounter along the way: How is the industry positioned? Best marketing channel? KPI's of competitors? By aligning every element, we help maximize success.

Our report gives you instant access to the answers and sources that other companies might choose to hide. We elaborate each steps of research methodology we have used and showcase you the sample size to earn your trust.

If you need any support, we are here! We pride ourselves on universe strength, data quality, and quick, friendly, and professional service.