
USA Set-Top Box Market Outlook to 2030
Region:North America
Author(s):Abhinav kumar
Product Code:KROD7577
December 2024
88
About the Report
USA Set-Top Box Market Overview
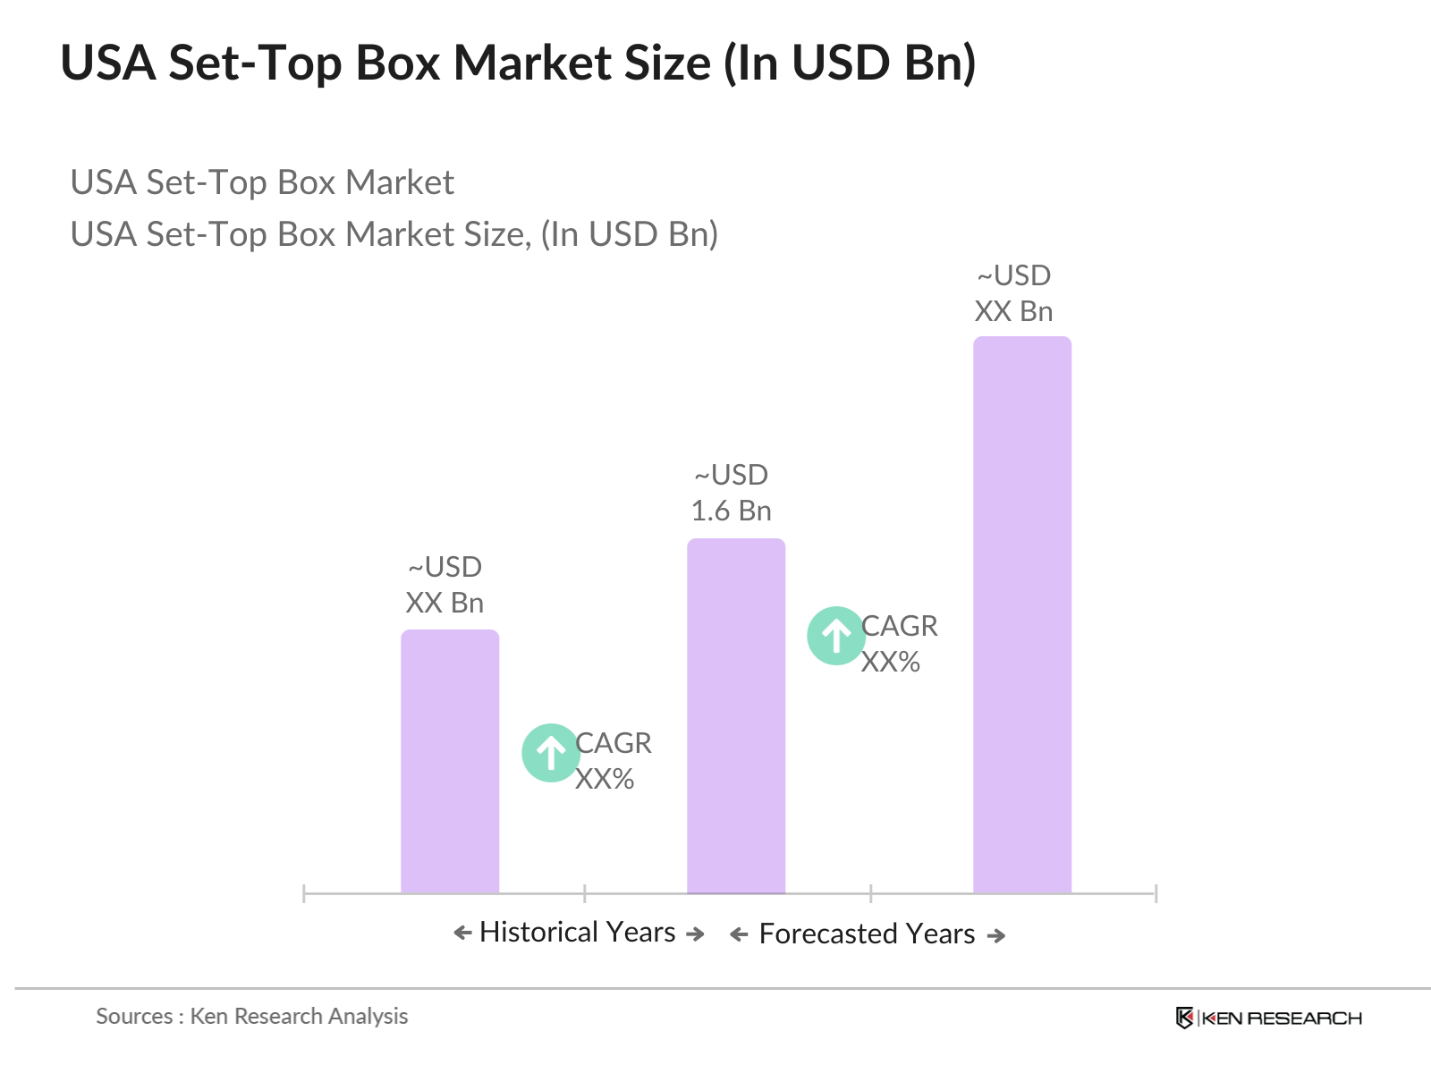
- The USA Set-Top Box market is valued at USD 1.6 billion based on a five-year historical analysis. This market is driven by the rapid transition from traditional cable TV to digital platforms, fueled by the increasing demand for Over-the-Top (OTT) streaming services. Consumer preferences for higher resolution content (4K, 8K) and features like AI-based recommendations are also significant growth drivers. Technological advancements in IPTV and hybrid set-top boxes have further contributed to the growth, supporting an expanding base of tech-savvy consumers.
- In the USA, dominant cities like New York, Los Angeles, and Chicago lead the market due to their higher broadband penetration and greater demand for high-quality content delivery. States like California and New York also benefit from more extensive infrastructure supporting IPTV services and high-definition broadcasting. These cities attract significant investment from both domestic and international set-top box manufacturers, further reinforcing their leadership in the market.
- The FCCs ongoing regulation of broadcasting spectrum allocation directly impacts the set-top box market by enabling efficient digital transmission. The U.S. government has allocated over 600 MHz of spectrum for broadband use, benefiting the expansion of IPTV services and digital broadcasting technologies. In addition, net neutrality policies ensure equal access to online content, supporting OTT services that rely on set-top boxes.
USA Set-Top Box Market Segmentation
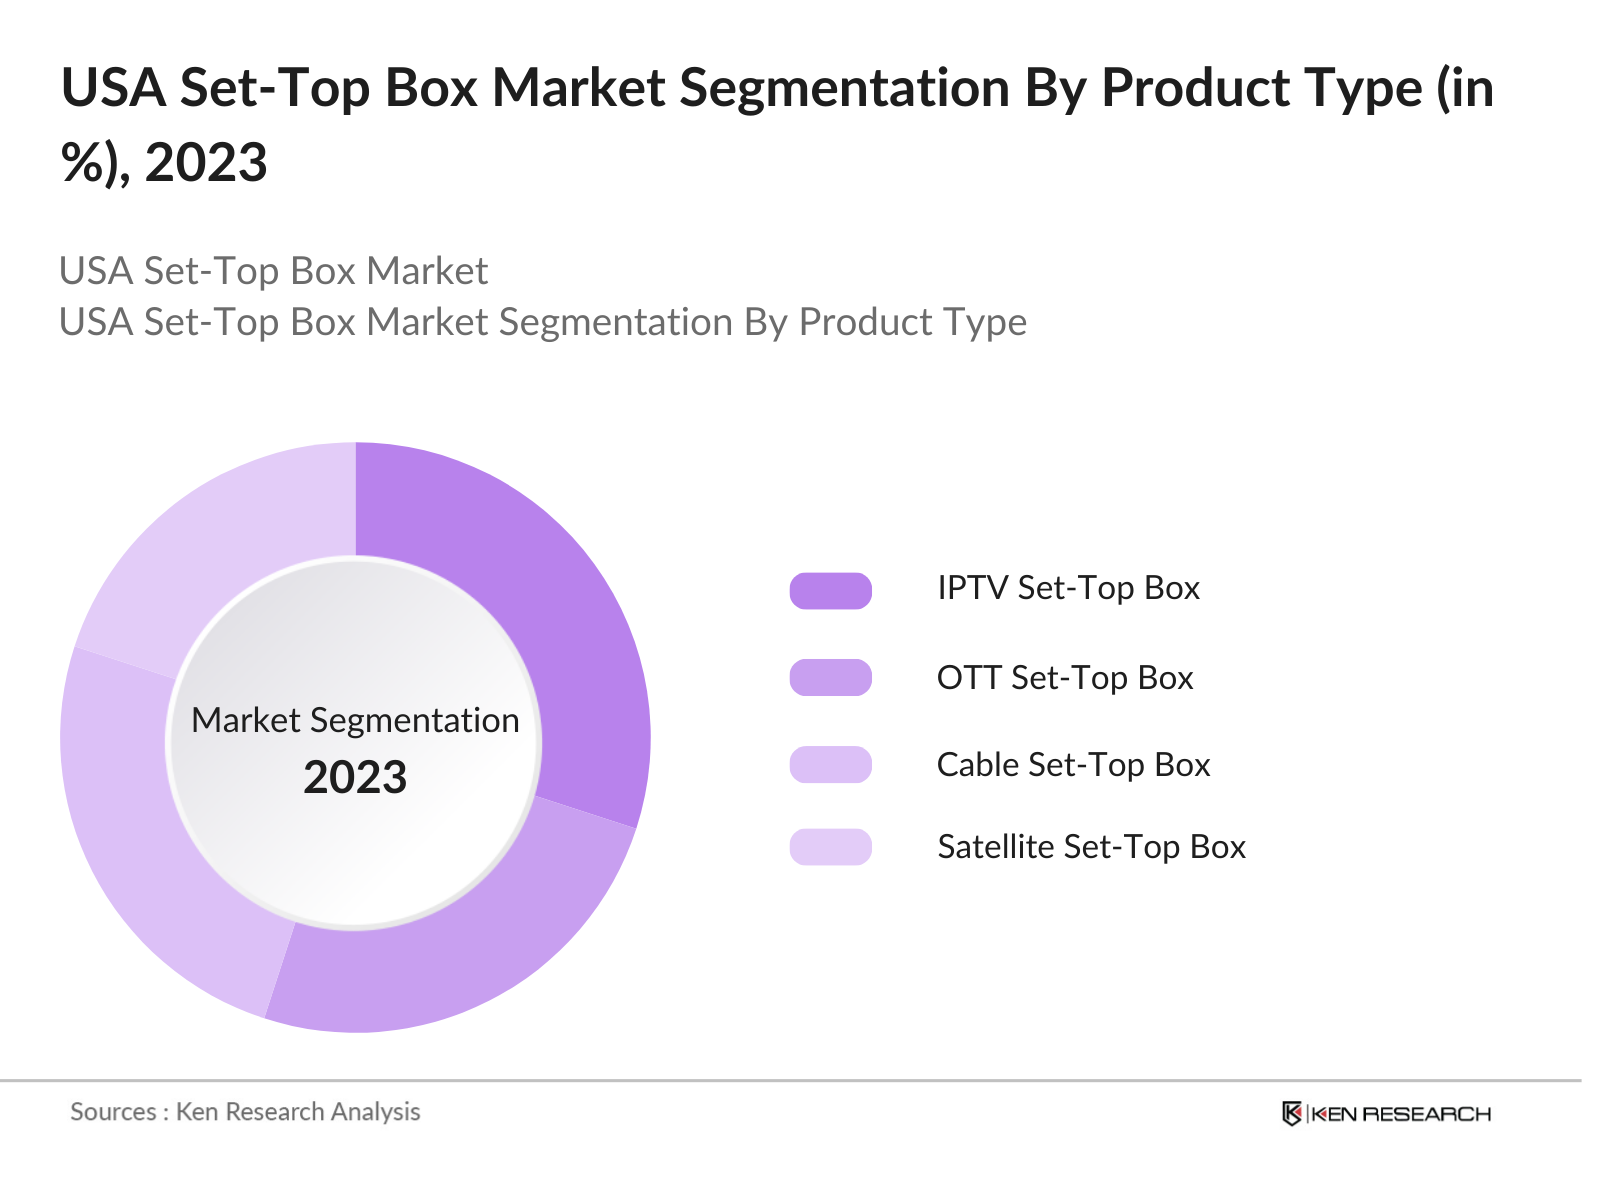
By Product Type: The USA Set-Top Box market is segmented by product type into cable set-top boxes, satellite set-top boxes, IPTV set-top boxes, and OTT set-top boxes. Recently, OTT set-top boxes have a dominant market share in the USA due to the widespread adoption of streaming services such as Netflix, Hulu, and Amazon Prime. These services offer convenience and a vast library of on-demand content, attracting consumers away from traditional cable and satellite TV. Brands like Roku and Amazon Fire TV have captured a significant portion of this market through competitive pricing and a robust ecosystem of content partnerships.
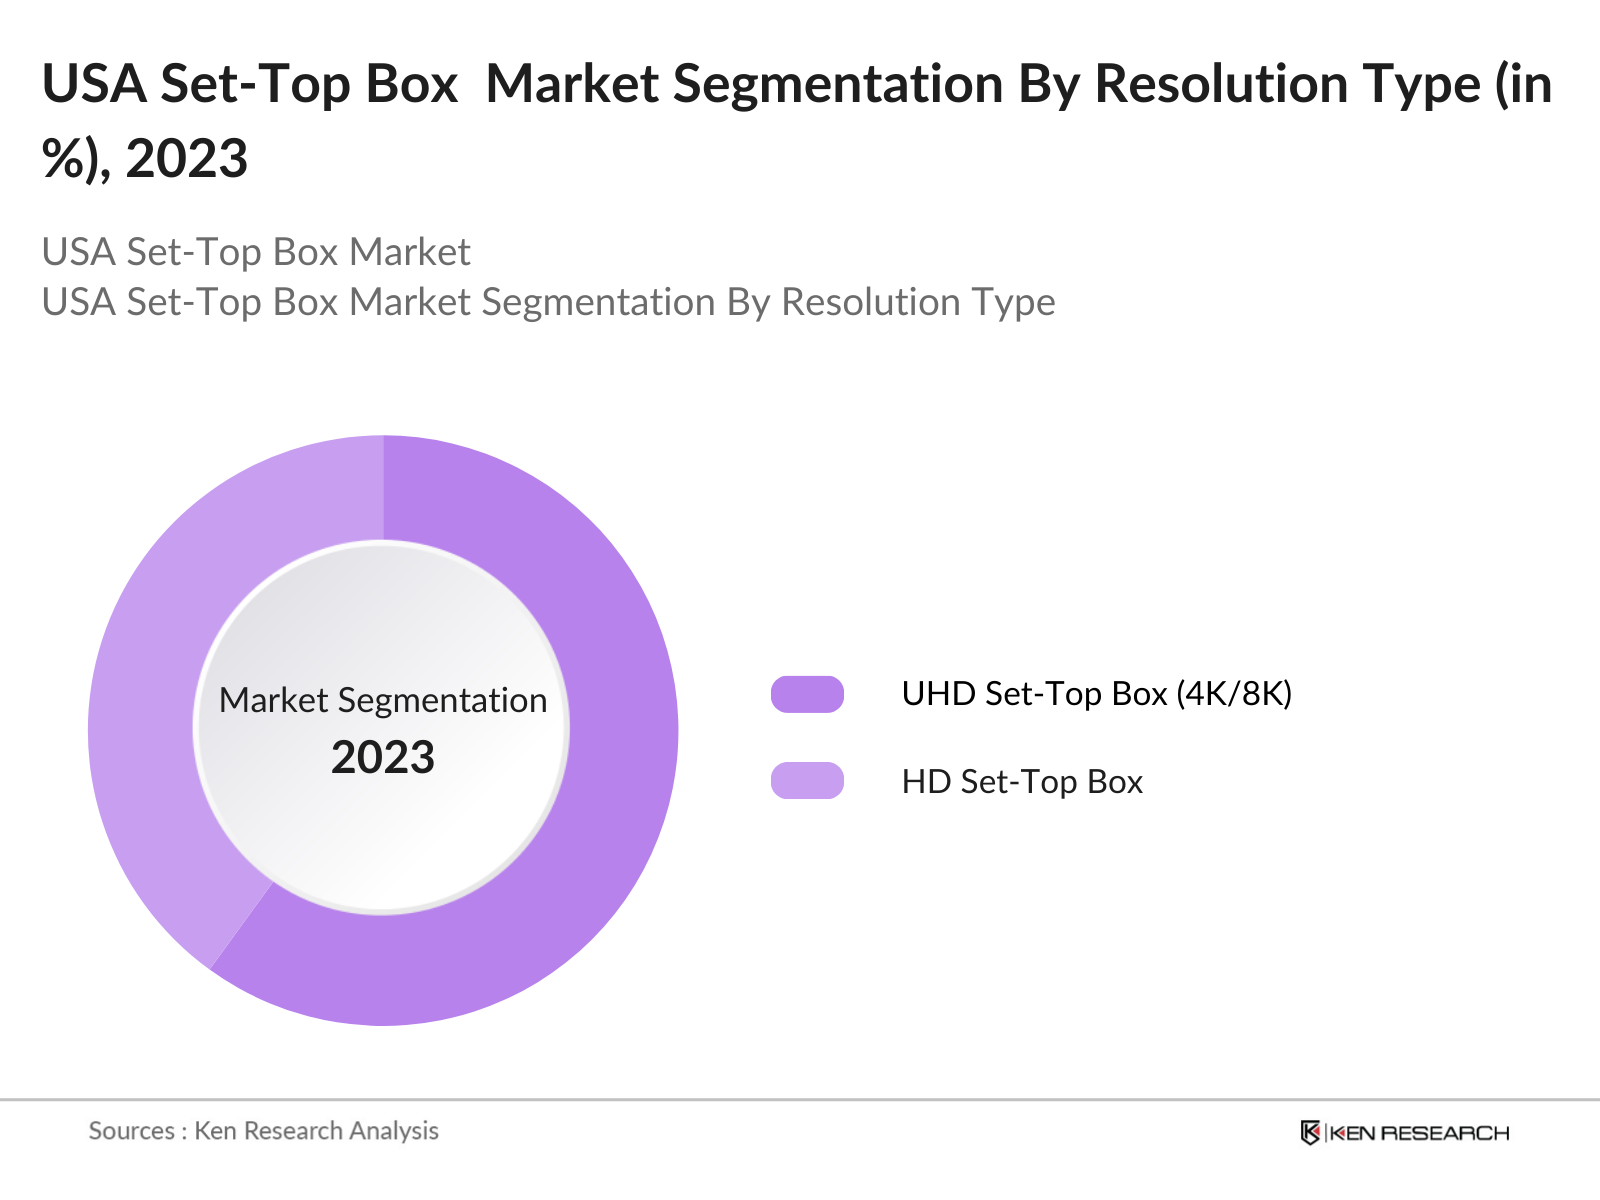
By Resolution: The USA Set-Top Box market is further segmented by resolution into HD set-top boxes and UHD (4K/8K) set-top boxes. UHD set-top boxes have gained a dominant share in this segment, driven by growing consumer demand for better picture quality, especially for streaming and live sports events. With 4K and 8K content becoming increasingly available, consumers are upgrading their devices to support this higher resolution, while broadcasters are enhancing their services to provide ultra-HD content. The demand for UHD is further accelerated by the increasing affordability of 4K/8K TVs.
USA Set-Top Box Market Competitive Landscape
The USA Set-Top Box market is dominated by key players who have established a strong presence through innovation, partnerships, and acquisitions. Companies like ARRIS, Technicolor, and Samsung leverage advanced technology integration, including voice control and smart home compatibility, to maintain their competitive edge. The introduction of hybrid devices that combine OTT with traditional broadcast services has further consolidated their market positions.
|
Company |
Year of Establishment |
Headquarters |
Product Range |
Technology Integration |
Global Presence |
R&D Spend |
Partnerships |
New Product Launches |
|
ARRIS (CommScope) |
1995 |
Suwanee, GA |
_ |
_ |
_ |
_ |
_ |
_ |
|
Technicolor |
1953 |
Issy-les-Moulineaux, FR |
_ |
_ |
_ |
_ |
_ |
_ |
|
Samsung Electronics |
1969 |
Suwon, South Korea |
_ |
_ |
_ |
_ |
_ |
_ |
|
Roku, Inc. |
2002 |
Los Gatos, CA |
_ |
_ |
_ |
_ |
_ |
_ |
|
Amazon (Fire TV) |
1994 |
Seattle, WA |
_ |
_ |
_ |
_ |
_ |
_ |
USA Set-Top Box Industry Analysis
Growth Drivers
- Increasing Demand for Streaming Services: The growing popularity of over-the-top (OTT) streaming services like Netflix, Amazon Prime, and Hulu is significantly driving the demand for set-top boxes in the USA. In 2023, more than 82% of U.S. households had at least one streaming service subscription, resulting in a growing requirement for devices that facilitate seamless content delivery. Set-top boxes are becoming essential for consumers looking to enhance their OTT viewing experience through superior hardware. OTT platforms contribute significantly to the $780 billion U.S. media and entertainment industry.
- Technological Advancements in Broadcasting: Technological advancements in broadcasting, including 4K and 8K resolutions, have pushed manufacturers to develop high-performance set-top boxes capable of supporting these resolutions. The United States already leads in 4K TV adoption, with over 52 million households owning 4K-enabled televisions in 2023. The integration of artificial intelligence (AI) for enhanced content recommendation and voice control features is further transforming set-top boxes into smart devices. The U.S. tech sectors $1.8 trillion contribution to the economy aids in promoting advanced technological ecosystems.
- Rising Adoption of IPTV Services: IPTV services are gaining traction due to the expansion of fiber-optic networks across the U.S., which deliver high-speed internet connections essential for seamless streaming. By 2023, over 45 million U.S. households were connected to fiber-optic internet, up from 39 million in 2022, indicating robust infrastructure development. Set-top boxes compatible with IPTV services are poised to gain from this trend, as consumers seek to maximize the quality of their content. The $80 billion allocated to broadband infrastructure by the U.S. government further accelerates this shift.
Market Challenges
- Decline in Traditional Cable Subscriptions: The shift away from traditional cable services, commonly known as "cord-cutting," poses a challenge for the set-top box market in the U.S. Cable subscriptions declined by nearly 6 million households in 2022, leaving about 69.3 million pay-TV households by 2023. This declining trend directly affects the demand for cable-specific set-top boxes as more consumers turn to streaming devices and smart TVs for content consumption.
- High Competition from Alternative Devices: The U.S. market for set-top boxes faces significant competition from alternative devices such as smart TVs and streaming devices like Roku, Amazon Fire Stick, and Apple TV. Over 50 million households in the U.S. were reported to own smart TVs in 2023, providing a strong alternative to traditional set-top boxes. This competition limits the market share of standalone set-top boxes, requiring manufacturers to innovate by adding features like AI integration and cloud DVR capabilities to maintain relevance.
USA Set-Top Box Market Future Outlook
Over the next five years, the USA Set-Top Box market is expected to experience steady growth, driven by continuous technological advancements and consumer demand for better content streaming options. Integration of AI, voice control, and enhanced connectivity (Wi-Fi 6, 5G) is likely to increase the appeal of new devices, as consumers look for seamless entertainment solutions. Furthermore, as more consumers shift from traditional cable to IPTV and OTT services, there will be significant opportunities for manufacturers to introduce hybrid devices catering to both live TV and streaming content.
Opportunities
- Growing Demand for Personalized Content: The growing demand for personalized content experiences in the U.S. presents an opportunity for set-top box manufacturers to integrate AI and machine learning (ML) features. AI-enabled set-top boxes that recommend content based on user preferences are becoming increasingly popular, especially with nearly 70% of U.S. consumers preferring personalized content. The expansion of AI in the entertainment sectorworth $400 billion in the U.S.supports this opportunity.
- Emerging Markets for Hybrid Set-Top Boxes: Hybrid set-top boxes, which combine OTT streaming and traditional cable services, present a growth opportunity in the U.S. market. As of 2023, around 40 million households continue to subscribe to both cable and streaming services, reflecting a demand for devices that can bridge both worlds. These hybrid set-top boxes are well-positioned to cater to a diverse consumer base that seeks flexibility in content consumption
Scope of the Report
|
Product Type |
Cable Satellite IPTV OTT |
|
Resolution |
HD UHD (4K/8K) |
|
Distribution Channel |
Direct to Consumer Retail Online Sales |
|
End-User |
Residential Commercial |
|
Region |
North-East South Midwest West |
Products
Key Target Audience Organizations and Entities Who Can Benefit by Subscribing This Report:
Broadcast Service Providing Companies
Telecom Operators
Internet Service Provider Companies
Smart Home Integrator Companies
Content Provider Companies
Consumer Electronics Manufacturing Industries
Investors and Venture Capitalist Firms
Government and Regulatory Bodies (e.g., Federal Communications Commission - FCC)
Companies
Players Mentioned in the Report
ARRIS (CommScope)
Technicolor SA
Samsung Electronics
Roku, Inc.
Amazon (Fire TV)
Huawei Technologies Co. Ltd.
Apple Inc. (Apple TV)
Cisco Systems Inc.
Echostar Corporation
Kaonmedia
Table of Contents
1. USA Set-Top Box Market Overview
1.1. Definition and Scope
1.2. Market Taxonomy
1.3. Market Growth Rate
1.4. Market Segmentation Overview
2. USA Set-Top Box Market Size (In USD Mn)
2.1. Historical Market Size
2.2. Year-On-Year Growth Analysis
2.3. Key Market Developments and Milestones
3. USA Set-Top Box Market Analysis
3.1. Growth Drivers
3.1.1. Increasing Demand for Streaming Services
3.1.2. Technological Advancements in Broadcasting
3.1.3. Rising Adoption of IPTV Services
3.1.4. Government Digitalization Initiatives
3.2. Market Challenges
3.2.1. Decline in Traditional Cable Subscriptions
3.2.2. High Competition from Alternative Devices
3.2.3. High Initial Cost of Advanced Set-Top Boxes
3.2.4. Cybersecurity and Piracy Concerns
3.3. Opportunities
3.3.1. Growing Demand for Personalized Content
3.3.2. Emerging Markets for Hybrid Set-Top Boxes
3.3.3. Expansion in Smart Home Ecosystem Integration
3.3.4. Strategic Collaborations with OTT Providers
3.4. Trends
3.4.1. Rise in Subscription-Based Set-Top Box Services
3.4.2. Increasing Use of Voice-Assisted Remotes
3.4.3. Cloud-Based DVR Services
3.4.4. Focus on Energy Efficiency
3.5. Government Regulation
3.5.1. FCC Regulations on Broadcasting
3.5.2. Digital Conversion Policies
3.5.3. Content Licensing Laws
3.6. SWOT Analysis
3.7. Stakeholder Ecosystem
3.8. Porters Five Forces Analysis
3.9. Competition Ecosystem
4. USA Set-Top Box Market Segmentation
4.1. By Product Type (In Value %)
4.1.1. Cable Set-Top Box
4.1.2. Satellite Set-Top Box
4.1.3. IPTV Set-Top Box
4.1.4. OTT Set-Top Box
4.2. By Resolution (In Value %)
4.2.1. HD Set-Top Box
4.2.2. UHD Set-Top Box (4K/8K)
4.3. By Distribution Channel (In Value %)
4.3.1. Direct to Consumer
4.3.2. Retail Distribution
4.3.3. Online Sales Channels
4.4. By End-User (In Value %)
4.4.1. Residential
4.4.2. Commercial (Hospitality, Education, Corporates)
4.5. By Region (In Value %)
4.5.1. North-East
4.5.2. South
4.5.3. Midwest
4.5.4. West
5. USA Set-Top Box Market Competitive Analysis
5.1 Detailed Profiles of Major Companies
5.1.1. ARRIS (CommScope)
5.1.2. Technicolor SA
5.1.3. Samsung Electronics
5.1.4. Huawei Technologies Co. Ltd.
5.1.5. Roku, Inc.
5.1.6. Amazon.com, Inc. (Fire TV)
5.1.7. Apple Inc. (Apple TV)
5.1.8. Sagemcom Broadband SAS
5.1.9. Skyworth Digital
5.1.10. Echostar Corporation (Dish Network)
5.1.11. Kaonmedia
5.1.12. Zinwell Corporation
5.1.13. HUMAX Electronics Co. Ltd.
5.1.14. Cisco Systems Inc.
5.1.15. Advanced Digital Broadcast (ADB) Group
5.2 Cross Comparison Parameters (Revenue, Number of Employees, R&D Spend, Product Offerings, Headquarters, Market Share, Inception Year, Product Launches)
5.3. Market Share Analysis
5.4. Strategic Initiatives (Partnerships, Collaborations, New Product Development)
5.5. Mergers And Acquisitions
5.6. Investment Analysis
5.7. Venture Capital Funding
5.8. Private Equity Investments
6. USA Set-Top Box Market Regulatory Framework
6.1. FCC Broadcasting Guidelines
6.2. Content and Digital Rights Management Compliance
6.3. Certification and Licensing Standards (UL, CE Marking)
7. USA Set-Top Box Future Market Size (In USD Mn)
7.1. Future Market Size Projections
7.2. Key Factors Driving Future Market Growth (Consumer Demand for Personalized Content, Increased Adoption of Smart Home Technologies)
8. USA Set-Top Box Future Market Segmentation
8.1. By Product Type (In Value %)
8.2. By Resolution (In Value %)
8.3. By Distribution Channel (In Value %)
8.4. By End-User (In Value %)
8.5. By Region (In Value %)
9. USA Set-Top Box Market Analysts' Recommendations
9.1. TAM/SAM/SOM Analysis
9.2. Customer Cohort Analysis
9.3. Marketing Initiatives (B2B, Direct to Consumer Campaigns)
9.4. White Space Opportunity Analysis (Emerging Markets, Untapped Consumer Segments)
Research Methodology
Step 1: Identification of Key Variables
The research begins with the identification of all stakeholders within the USA Set-Top Box Market, using extensive desk research. This includes collecting information from secondary databases and proprietary sources to define the variables influencing market dynamics, such as consumer trends, technology adoption rates, and competitive strategies.
Step 2: Market Analysis and Construction
This step involves the collection of historical data, including set-top box penetration rates, consumer preferences, and revenue generation from different product types. Market analysts evaluate service quality and compare trends across different regions, ensuring reliable revenue estimates.
Step 3: Hypothesis Validation and Expert Consultation
To ensure accuracy, the data and hypotheses are validated through expert consultations. Interviews with industry leaders provide insights into operational challenges, technological advancements, and the future of the market. This feedback is crucial for corroborating data and refining forecasts.
Step 4: Research Synthesis and Final Output
The final phase of research involves synthesizing data from set-top box manufacturers, service providers, and content aggregators. The output is a comprehensive analysis of the USA Set-Top Box Market, including validated forecasts and segmented insights.
Frequently Asked Questions
1. How big is the USA Set-Top Box Market?
The USA Set-Top Box market is valued at USD 1.6 billion, driven by increasing consumer demand for OTT streaming services, high-definition content, and advanced features like voice control and AI-based recommendations.
2. What are the challenges in the USA Set-Top Box Market?
Key challenges include the decline in traditional cable subscriptions, competition from alternative devices like smart TVs and streaming sticks, and increasing concerns over piracy and content security.
3. Who are the major players in the USA Set-Top Box Market?
Major players in the market include ARRIS, Technicolor, Samsung Electronics, Roku, and Amazon (Fire TV). These companies dominate due to their advanced technology integration, strong content partnerships, and global reach.
4. What are the growth drivers of the USA Set-Top Box Market?
Growth drivers include increasing adoption of UHD (4K/8K) content, the rise of OTT platforms, technological advancements in AI and voice control, and government-led digitalization efforts.
Why Buy From Us?
 Framework")
What makes us stand out is that our consultants follows Robust, Refine and Result (RRR) methodology. i.e. Robust for clear definitions, approaches and sanity checking, Refine for differentiating respondents facts and opinions and Result for presenting data with story

We have set a benchmark in the industry by offering our clients with syndicated and customized market research reports featuring coverage of entire market as well as meticulous research and analyst insights.

While we don't replace traditional research, we flip the method upside down. Our dual approach of Top Bottom & Bottom Top ensures quality deliverable by not just verifying company fundamentals but also looking at the sector and macroeconomic factors.

With one step in the future, our research team constantly tries to show you the bigger picture. We help with some of the tough questions you may encounter along the way: How is the industry positioned? Best marketing channel? KPI's of competitors? By aligning every element, we help maximize success.

Our report gives you instant access to the answers and sources that other companies might choose to hide. We elaborate each steps of research methodology we have used and showcase you the sample size to earn your trust.

If you need any support, we are here! We pride ourselves on universe strength, data quality, and quick, friendly, and professional service.