
USA Sports Analytics Market Outlook to 2030
Region:North America
Author(s):Abhinav kumar
Product Code:KROD3875
Region:North America
Author(s):Abhinav kumar
Product Code:KROD3875
December 2024
80
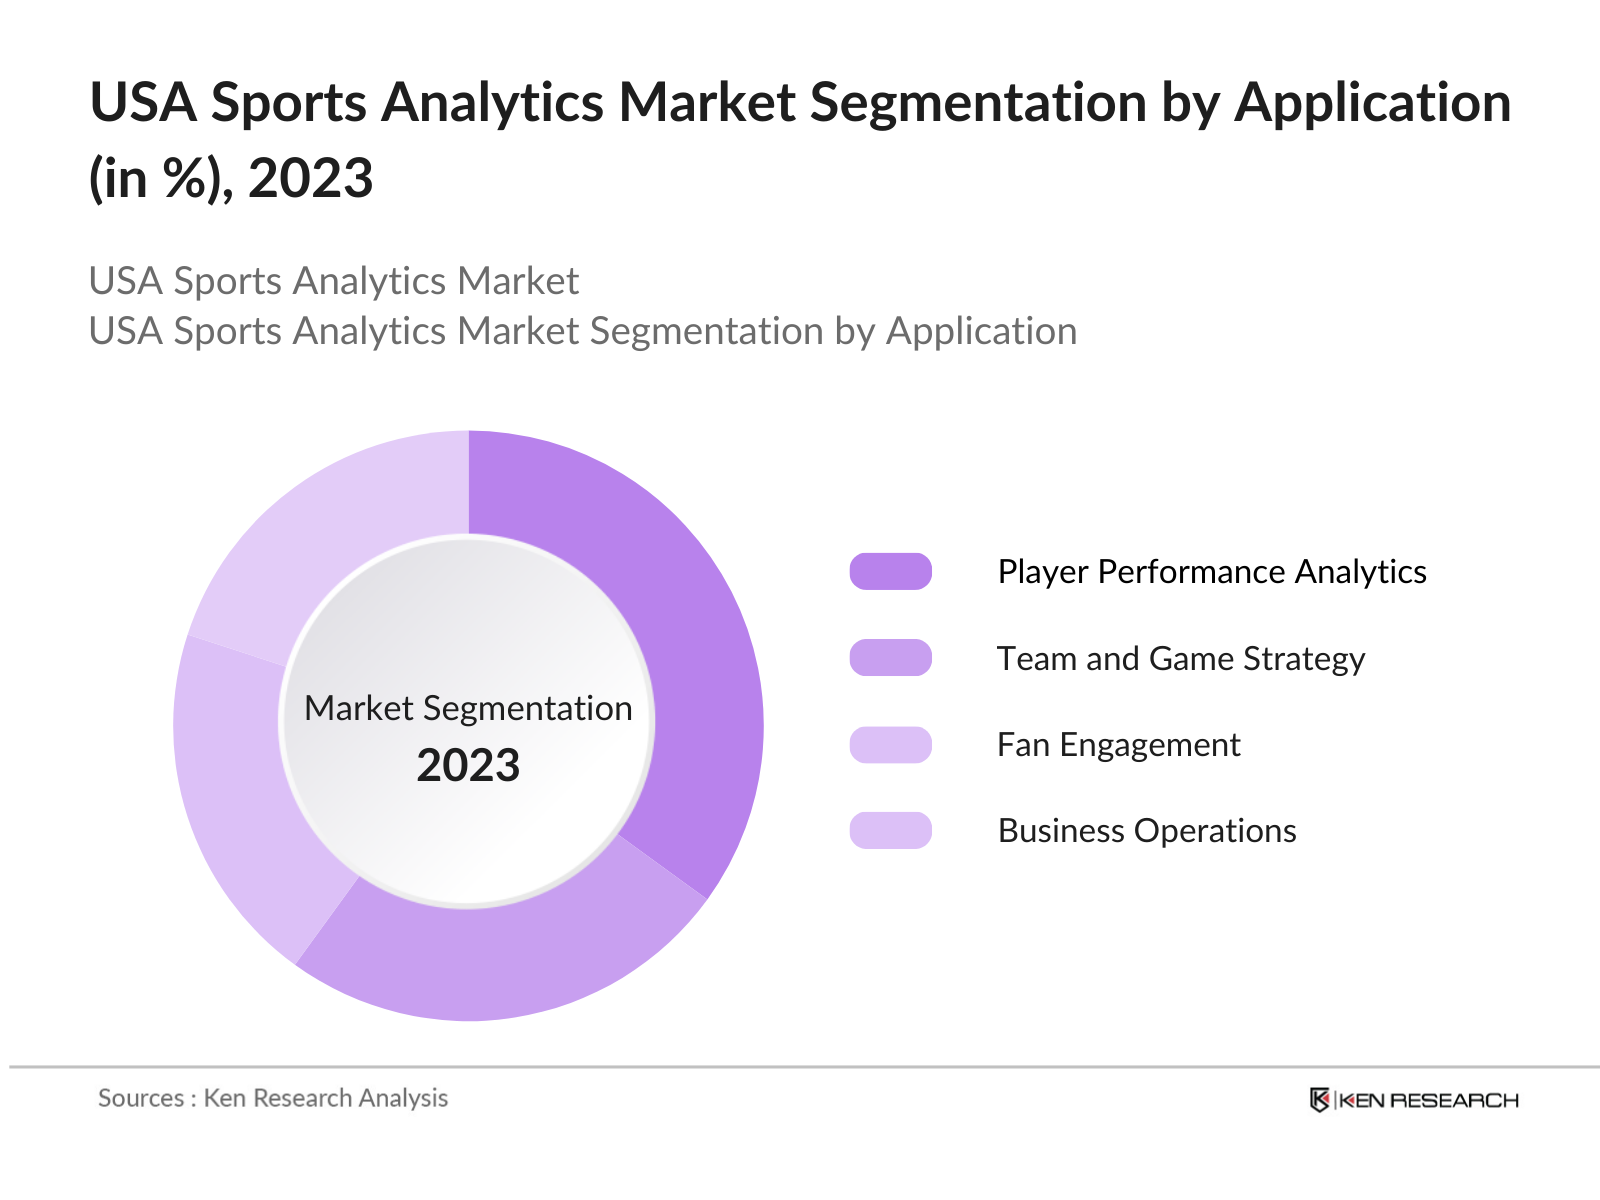
By Application: The USA Sports Analytics market is segmented by application into Player Performance Analytics, Team and Game Strategy, Fan Engagement, and Business Operations. Within this segment, Player Performance Analytics holds a dominant market share due to the increasing focus on real-time monitoring of player health, fitness, and performance. The use of wearable devices and advanced data analytics helps teams reduce the risk of injury, optimize training, and improve overall team performance. This sub-segment has grown rapidly due to the use of predictive analytics in enhancing player longevity and career management.
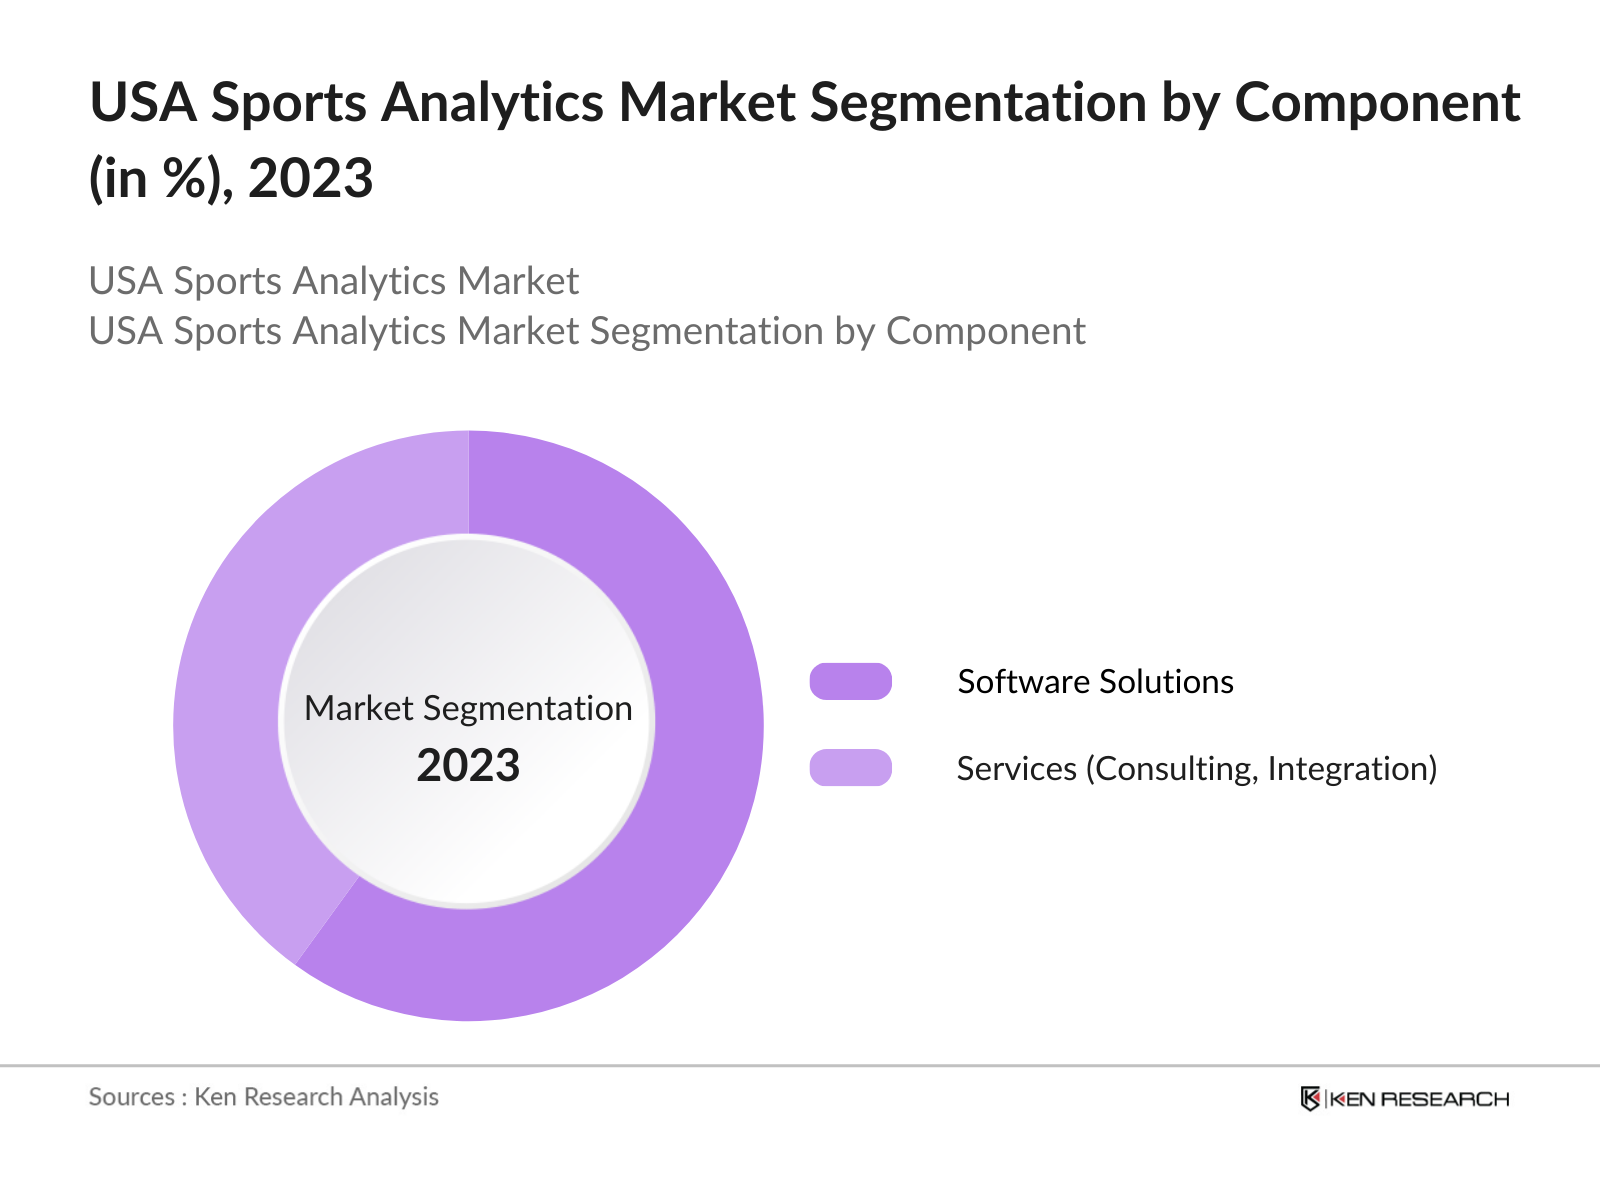
By Component
The market is also segmented by component into Software Solutions and Services. Software solutions dominate this segment, holding the majority share due to the increasing demand for customizable platforms that provide real-time data insights and predictive modeling. These platforms allow sports organizations to collect and process large amounts of data efficiently, enabling teams to analyze various performance metrics. Services such as consulting and integration, though essential, are secondary as teams prioritize investing in long-term, scalable software solutions.
The USA Sports Analytics market is highly competitive, with both global and local players contributing to the market's growth. Major companies in the market are leveraging partnerships with professional sports leagues, utilizing AI and machine learning to provide more advanced analytical insights. Established companies have a strong foothold due to their extensive portfolios and ability to provide end-to-end solutions, making it difficult for smaller companies to gain significant market share.
|
Company |
Establishment Year |
Headquarters |
Revenue (USD Bn) |
Employees |
Technology Platform |
Market Presence |
Innovation Capability |
Strategic Partnerships |
Customer Base |
|
IBM |
1911 |
Armonk, New York |
73.6 |
- |
- |
- |
- |
- |
- |
|
SAS |
1976 |
Cary, North Carolina |
3.2 |
- |
- |
- |
- |
- |
- |
|
Catapult Sports |
2006 |
Melbourne, Australia |
0.1 |
- |
- |
- |
- |
- |
- |
|
Hudl |
2006 |
Lincoln, Nebraska |
0.2 |
- |
- |
- |
- |
- |
- |
|
SAP |
1972 |
Walldorf, Germany |
32.7 |
- |
- |
- |
- |
- |
- |
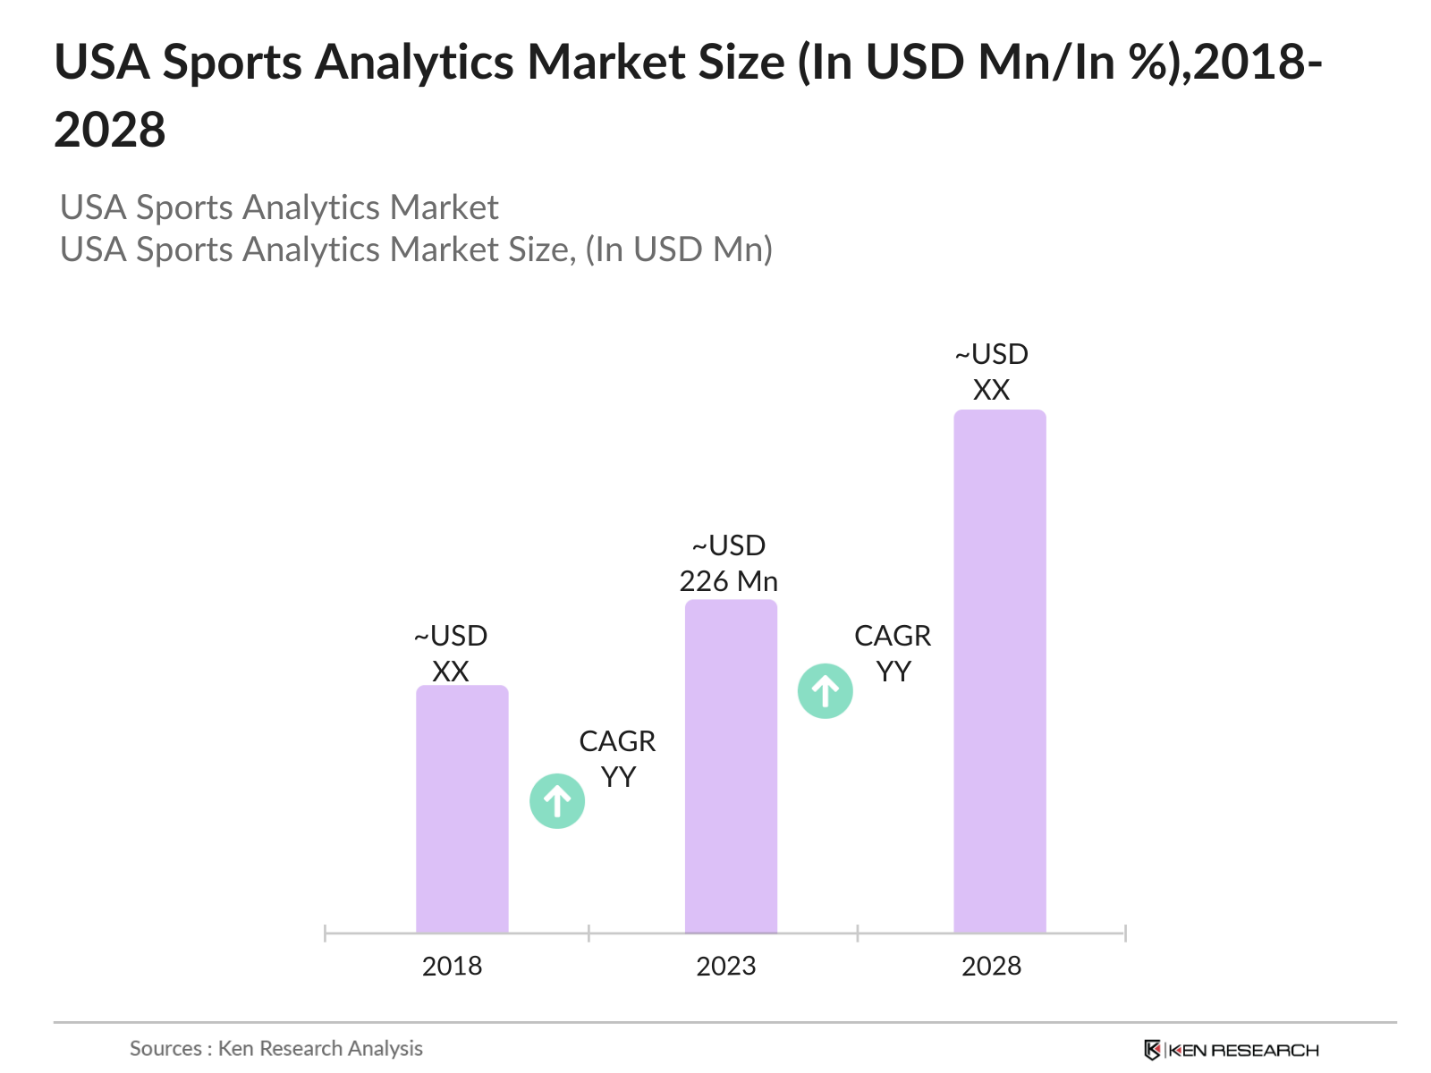
Over the next five years, the USA Sports Analytics market is expected to experience robust growth, driven by advancements in wearable technologies, increased use of artificial intelligence, and the growing importance of fan engagement solutions. The proliferation of cloud-based analytics platforms will provide teams and sports organizations with scalable solutions, helping to streamline operations and decision-making processes. As teams continue to adopt more data-driven strategies, the sports analytics landscape is likely to expand beyond major leagues to include amateur and collegiate sports.
|
By Application |
Player Performance Analytics Team Strategy Fan Engagement Business Operations |
|
By Component |
Software Solutions Services |
|
By Deployment Mode |
On-Premise Cloud-Based |
|
By End User |
Professional Teams Leagues, Media Individual Athletes |
|
By Region |
North-East West Mid-West South |
1.1. Definition and Scope
1.2. Market Taxonomy
1.3. Market Growth Rate
1.4. Market Segmentation Overview
2.1. Historical Market Size
2.2. Year-On-Year Growth Analysis
2.3. Key Market Developments and Milestones
3.1. Growth Drivers (Real-time Data Analytics, Wearable Technology Adoption, Fan Engagement Solutions, Performance Optimization Platforms)
3.1.1. Increasing Use of Wearable Devices
3.1.2. Rising Fan Engagement through Digital Platforms
3.1.3. Enhanced Player Performance Tracking and Injury Prevention
3.1.4. Strategic Decision-Making via Predictive Analytics
3.2.Market Challenges (Data Privacy Concerns, High Initial Costs, Integration with Legacy Systems, Limited Adoption in Amateur Sports)
3.2.1. Data Privacy and Security Issues
3.2.2. High Implementation Costs for Smaller Teams
3.2.3. Integration Challenges with Legacy Systems
3.2.4. Limited Use of Analytics in Non-Professional Sports
3.3.Opportunities (Cloud-based Analytics, AI-Driven Insights, Expansion into Amateur Sports, Partnerships with Media and Entertainment)
3.3.1. Growing Demand for AI-based Analytics Solutions
3.3.2. Increasing Use of Cloud-Based Platforms for Scalability
3.3.3. Expanding Adoption in College and Amateur Sports
3.3.4. Opportunities with Media Rights and Broadcast Analytics
3.4.Trends (AI and ML Integration, Gamification of Sports, Fan-Centric Analytics, Performance Data Monetization)
3.4.1. Integration of AI and Machine Learning in Sports Analytics
3.4.2. Gamification to Boost Audience Engagement
3.4.3. Use of Fan-Centric Data Analytics for Personalization
3.4.4. Monetization of Performance Data through Partnerships
3.5.Government Regulation (Data Protection Laws, Athlete Data Usage Regulations, Compliance Requirements for Technology Implementation)
3.5.1. Data Privacy and Security Regulations
3.5.2. Athlete Rights in Data Usage
3.5.3. Compliance with Sports Governing Bodies
3.5.4. Regulations on Wearable Technology in Sports
3.6. SWOT Analysis
3.7. Stake Ecosystem (Leagues, Teams, Technology Providers, Fans)
3.8. Porters Five Forces (Supplier Power, Buyer Power, Competitive Rivalry, Threat of Substitution, Threat of New Entrants)
3.9. Competition Ecosystem
4.1. By Application (In Value %) 4.1.1. Player Performance Analytics
4.1.2. Team and Game Strategy
4.1.3. Fan Engagement and Experience
4.1.4. Business Operations (Ticketing, Sponsorship, Marketing)
4.2. By Component (In Value %)
4.2.1. Software Solutions
4.2.2. Services (Consulting, Integration, Support)
4.3. By Deployment Mode (In Value %)
4.3.1. On-Premise
4.3.2. Cloud-Based
4.4. By End User (In Value %)
4.4.1. Professional Sports Teams
4.4.2. Leagues and Associations
4.4.3. Media and Broadcasting Companies
4.4.4. Individual Athletes
4.5. By Region (In Value %) 4.5.1. North-East
4.5.2. West
4.5.3. Mid-West
4.5.4. South
5.1. Detailed Profiles of Major Companies
5.1.1. IBM
5.1.2. SAS
5.1.3. Catapult Sports
5.1.4. Tableau
5.1.5. Hudl
5.1.6. SAP
5.1.7. Sportradar
5.1.8. STATSports
5.1.9. Krossover
5.1.10. Opta Sports
5.1.11. Zebra Technologies
5.1.12. HPE
5.1.13. Sportsradar
5.1.14. Microsoft
5.1.15. Oracle
5.2.Cross Comparison Parameters (Market Presence, Revenue, Service Offerings, Technology Platform, Innovation Capability, Strategic Partnerships, Market Penetration, Customer Base)
5.3. Market Share Analysis
5.4. Strategic Initiatives
5.5. Mergers and Acquisitions
5.6. Investment Analysis
5.7. Venture Capital Funding
5.8. Government Grants
5.9. Private Equity Investments
6.1. Data Privacy Regulations
6.2. Compliance with Sports League Regulations
6.3. Ethical Considerations in Data Usage
7.1. Future Market Size Projections
7.2. Key Factors Driving Future Market Growth
8.1. By Application
8.2. By Component
8.3. By Deployment Mode
8.4. By End User
8.5. By Region
9.1. TAM/SAM/SOM Analysis
9.2. Customer Cohort Analysis
9.3. Marketing Initiatives
9.4. White Space Opportunity Analysis
The initial step involves mapping the key stakeholders in the USA Sports Analytics Market, including sports organizations, software providers, and regulatory bodies. Secondary research sources such as government reports, proprietary databases, and industry publications are used to define the key variables that drive market growth.
This step involves gathering and analyzing historical data on market size, application of analytics, and technological adoption in the sports industry. The analysis will include revenue trends, adoption rates, and the impact of AI on predictive analytics.
Industry experts from major sports organizations and technology firms are consulted through CATI interviews to validate hypotheses. These discussions help refine market estimates and provide insights into future growth trends.
The final stage includes synthesizing the findings and verifying them through direct consultations with sports teams and software providers. This ensures a comprehensive and validated analysis of the market, enabling accurate projections and strategies.
The USA Sports Analytics market is valued at USD 226 million, driven by the adoption of data-driven strategies among professional sports teams and the increasing use of wearable technology.
The market faces challenges such as data privacy concerns, high implementation costs for smaller teams, and the integration of advanced analytics platforms with existing legacy systems.
Key players in the market include IBM, SAS, Catapult Sports, Hudl, and SAP. These companies dominate due to their comprehensive platforms, strategic partnerships, and innovative capabilities.
The market is propelled by the rising use of real-time data analytics, wearable technologies, and AI-driven platforms that enable teams to optimize player performance and game strategy.
The market is expected to grow significantly, fueled by technological advancements and increasing investments in cloud-based analytics solutions, expanding beyond professional teams to include amateur and collegiate sports.
 Framework")
What makes us stand out is that our consultants follows Robust, Refine and Result (RRR) methodology. i.e. Robust for clear definitions, approaches and sanity checking, Refine for differentiating respondents facts and opinions and Result for presenting data with story

We have set a benchmark in the industry by offering our clients with syndicated and customized market research reports featuring coverage of entire market as well as meticulous research and analyst insights.

While we don't replace traditional research, we flip the method upside down. Our dual approach of Top Bottom & Bottom Top ensures quality deliverable by not just verifying company fundamentals but also looking at the sector and macroeconomic factors.

With one step in the future, our research team constantly tries to show you the bigger picture. We help with some of the tough questions you may encounter along the way: How is the industry positioned? Best marketing channel? KPI's of competitors? By aligning every element, we help maximize success.

Our report gives you instant access to the answers and sources that other companies might choose to hide. We elaborate each steps of research methodology we have used and showcase you the sample size to earn your trust.

If you need any support, we are here! We pride ourselves on universe strength, data quality, and quick, friendly, and professional service.