


USA Sports Drinks Market Outlook to 2030
Region:North America
Author(s):Vijay Kumar
Product Code:KROD10390
November 2024
81
About the Report
USA Sports Drinks Market Overview
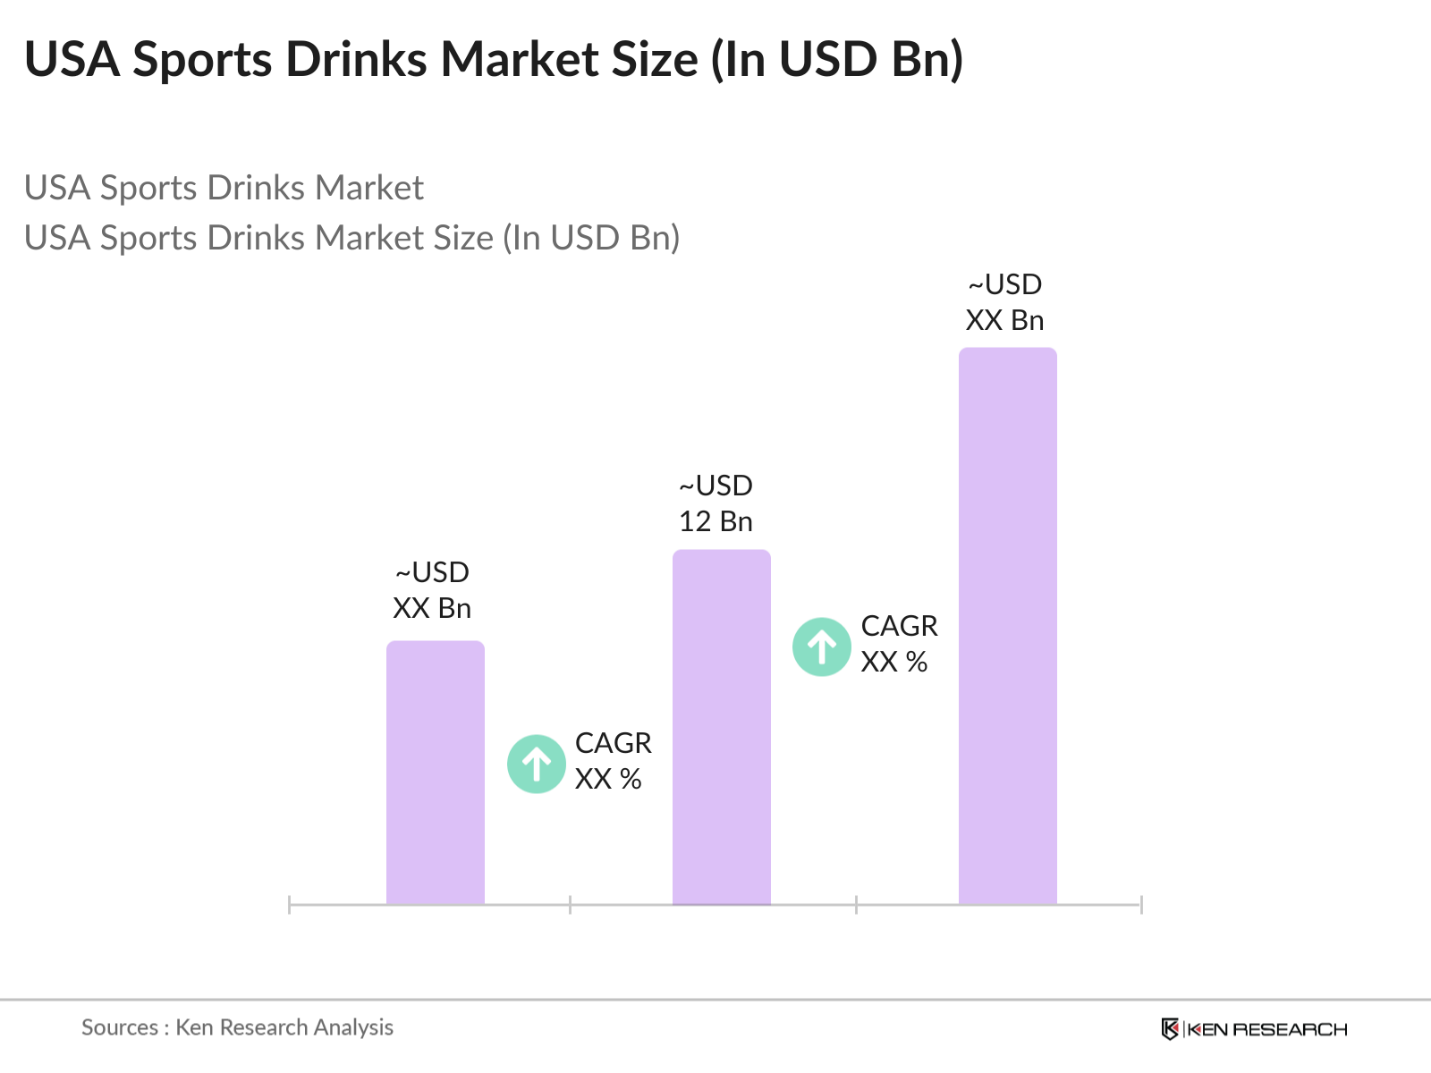
- The USA Sports Drinks market is valued at USD 12 billion, based on a five-year historical analysis. This market is primarily driven by increasing health consciousness among consumers, coupled with rising participation in sports and fitness activities. Product innovation, especially the shift toward natural and low-calorie ingredients, is also accelerating demand, as more consumers seek functional beverages for hydration and recovery. The popularity of sports drinks among athletes and fitness enthusiasts underscores their role as a preferred hydration choice, with added benefits in electrolyte replenishment.
- Major metropolitan areas such as New York, Los Angeles, and Chicago dominate the market due to their large, active populations and higher disposable incomes. These cities have a robust presence of fitness centers and sports events, contributing to the heightened demand for sports beverages.
- The USA Food and Drug Administration (FDA) regulates the safety and labeling of beverage ingredients. In 2022, the FDA updated its guidelines on the use of certain additives and issued new regulations on labeling requirements for added sugars and caffeine content. Compliance with these guidelines is mandatory for products sold in the USA market, ensuring consumer safety and informed choices.
USA Sports Drinks Market Segmentation
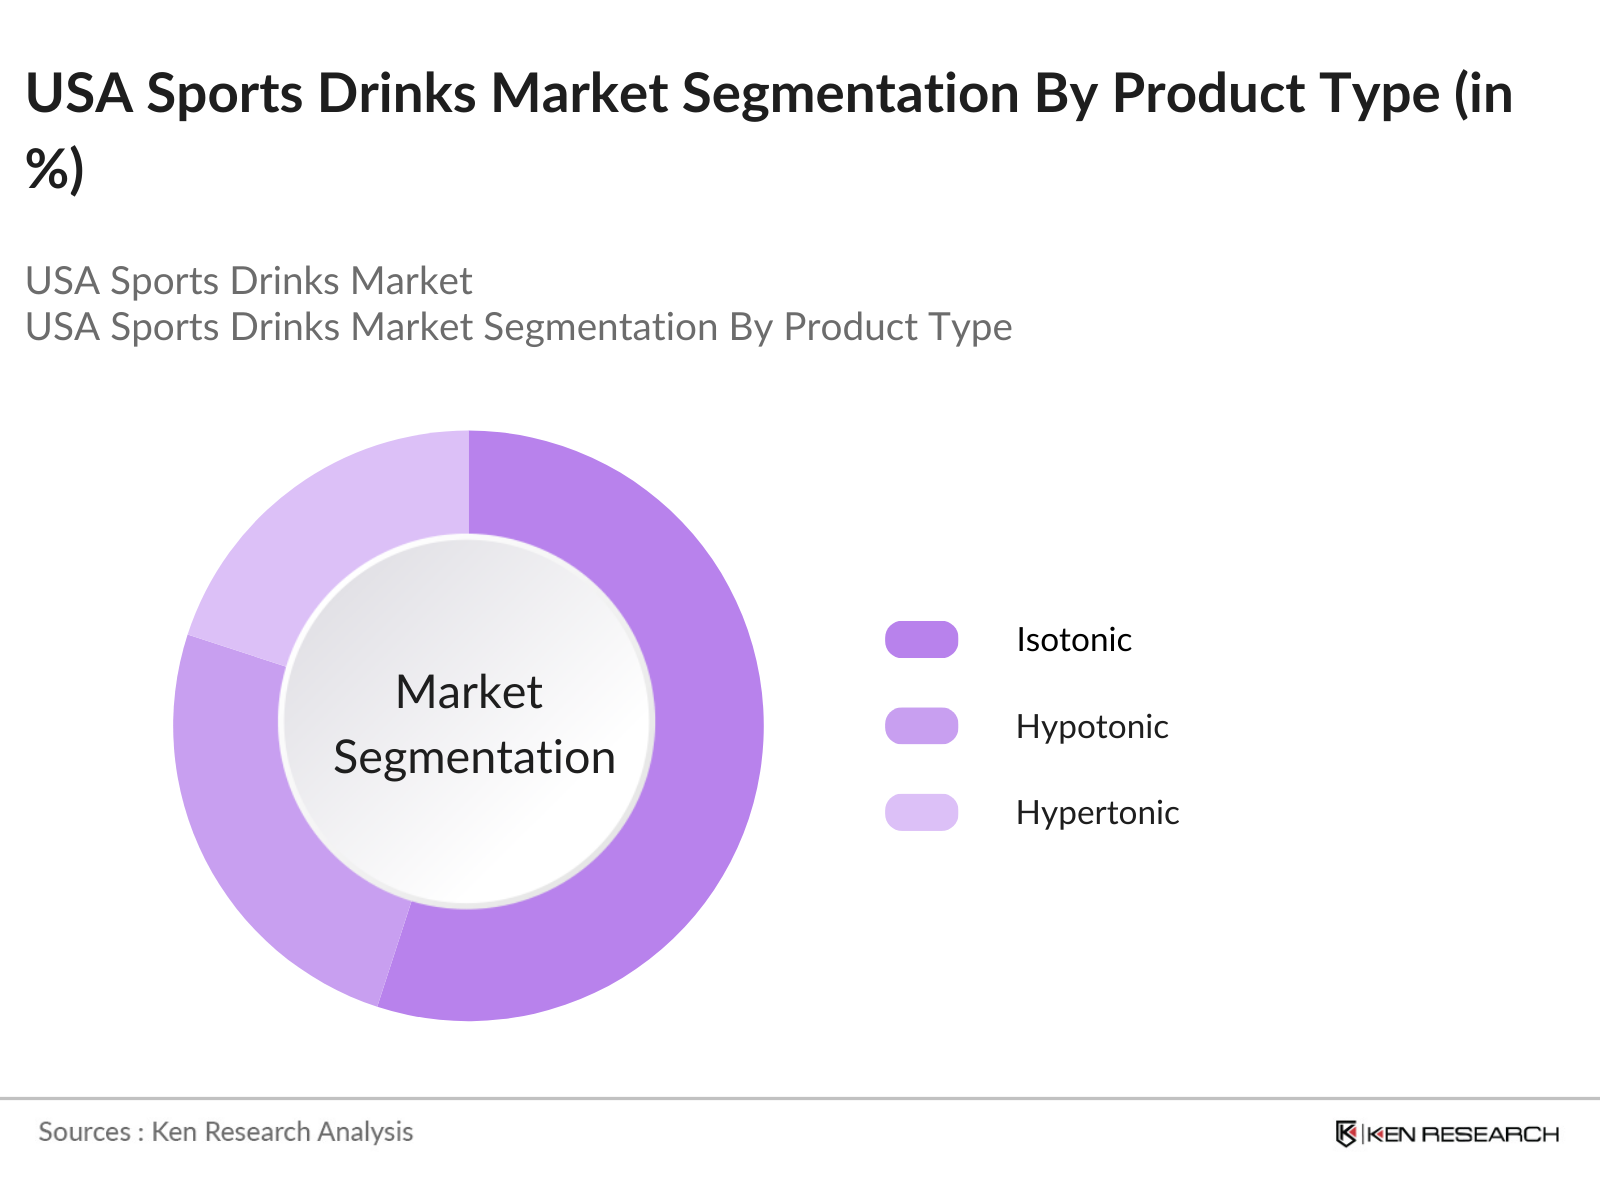
By Product Type: The USA sports drinks market is segmented by product type into isotonic, hypotonic, and hypertonic beverages. Isotonic drinks hold a dominant market share, attributed to their balanced electrolyte content that effectively replenishes fluids lost during exercise. This balance makes them particularly popular among athletes and fitness enthusiasts seeking optimal hydration.
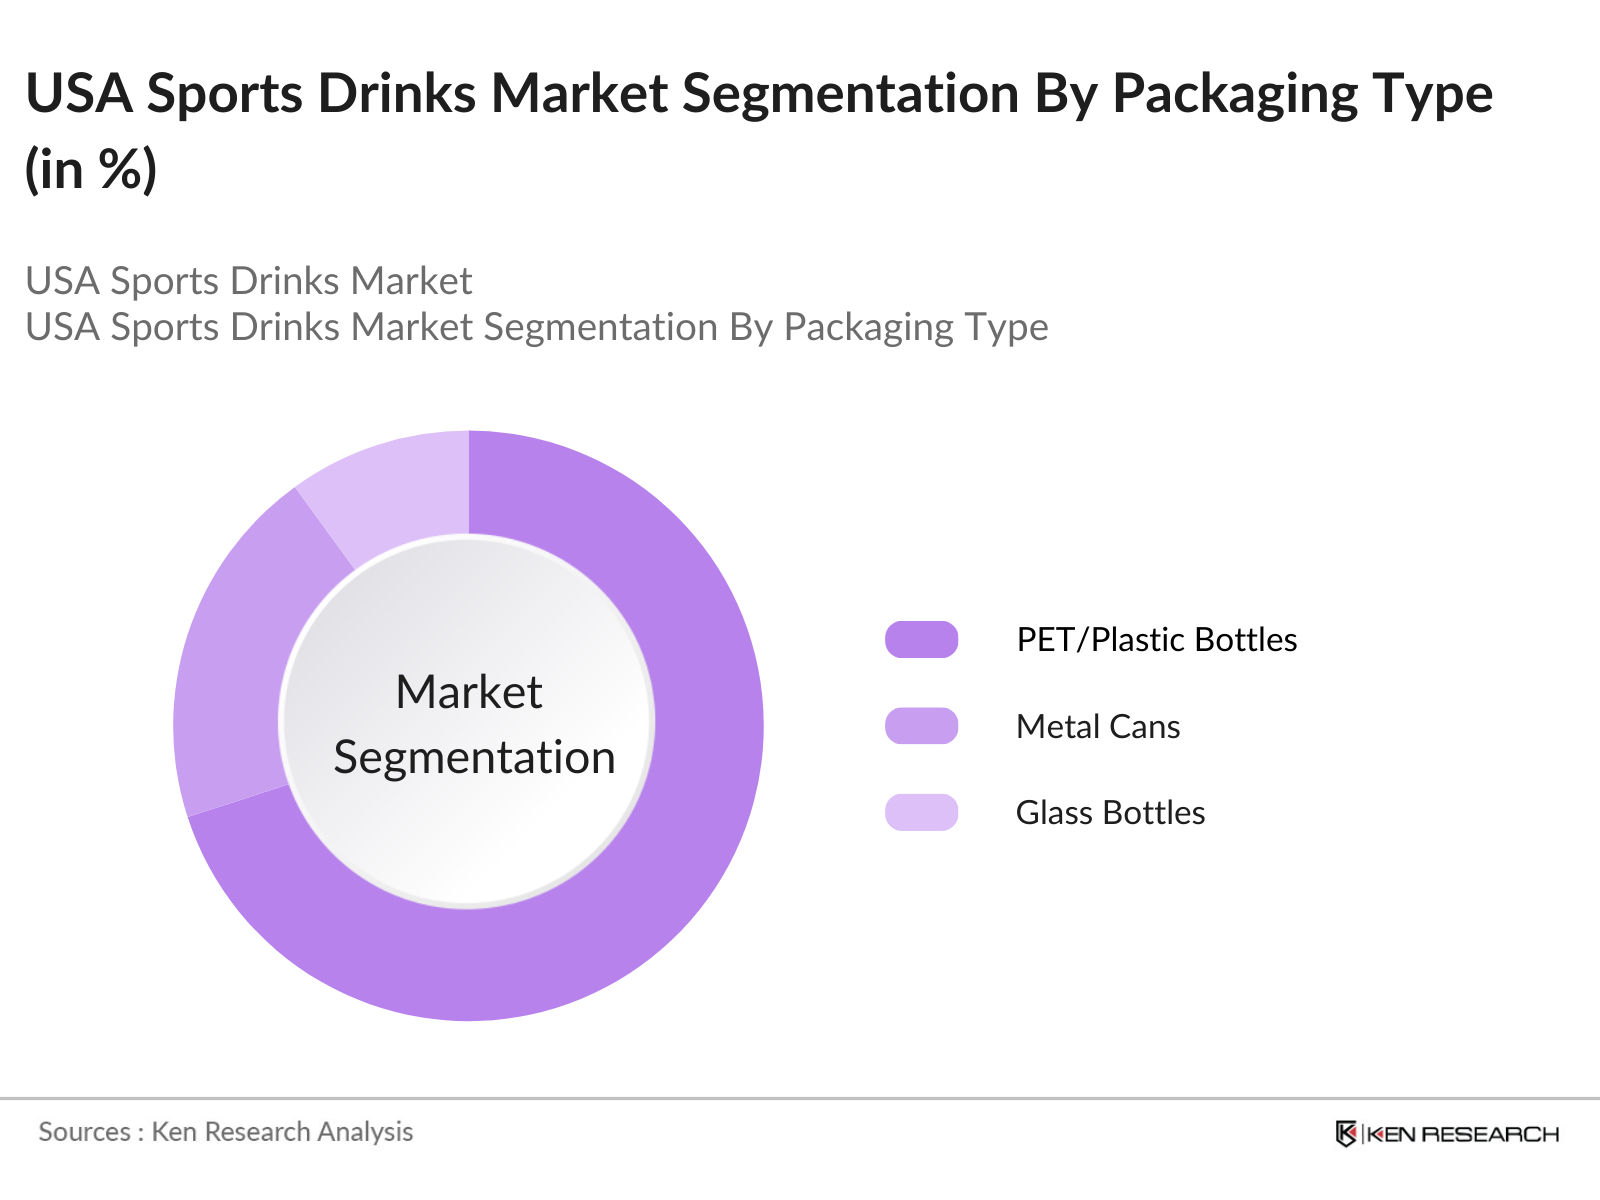
By Packaging Type: The market is also segmented by packaging type into PET/plastic bottles, metal cans, and glass bottles. PET/plastic bottles lead the market share due to their lightweight nature, durability, and convenience for on-the-go consumption. Their widespread availability and cost-effectiveness further enhance their dominance in the market.
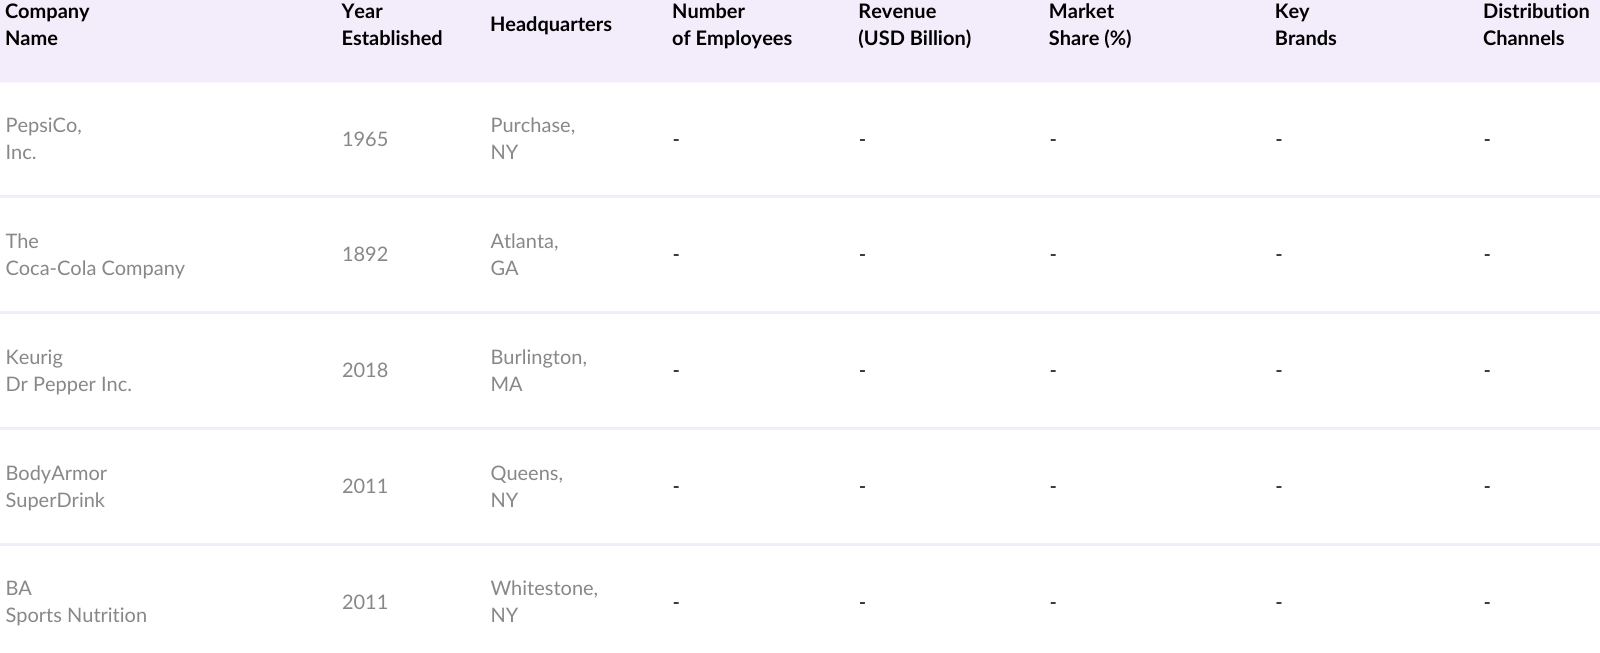
USA Sports Drinks Market Competitive Landscape
The USA sports drinks market is characterized by the presence of several key players who have established strong brand recognition and extensive distribution networks. This competitive environment underscores the significant influence of these companies in shaping market dynamics.
USA Sports Drinks Industry Analysis
Growth Drivers
- Increasing Health Consciousness: The global beverage industry is experiencing a significant shift as consumers become more health-conscious. This change is evident in the rising demand for beverages with reduced sugar content and added health benefits. For instance, the global market for functional beverages, which include drinks fortified with vitamins, minerals, and other beneficial ingredients, has seen substantial growth. This trend is supported by data from the World Health Organization, which reports that noncommunicable diseases (NCDs) account for 71% of all deaths globally, prompting consumers to seek healthier lifestyle choices, including their beverage consumption.
- Rising Participation in Sports and Fitness Activities: There has been a notable increase in global participation in sports and fitness activities, leading to higher consumption of sports and energy drinks. According to the International Health, Racquet & Sports club Association (IHRSA), the global health club industry served over 183 million members in 2022, reflecting a growing emphasis on physical fitness. This surge in active lifestyles has directly influenced the beverage market, with consumers seeking products that support hydration and energy replenishment during and after workouts.
- Product Innovations and Diversification: Beverage companies are continually innovating to meet changing consumer preferences. This includes the introduction of plant-based beverages, functional drinks with added health benefits, and low or no-alcohol options. For example, the global market for plant-based beverages has expanded significantly, with products like almond milk, soy milk, and oat milk becoming mainstream. This diversification caters to consumers seeking alternatives due to lactose intolerance, vegan lifestyles, or health considerations.
Market Challenges
- Health Concerns Over Sugar Content: There is growing concern over the high sugar content in many beverages, leading to increased scrutiny from health organizations and consumers. The World Health Organization recommends that adults and children reduce their daily intake of free sugars to less than 10% of their total energy intake, highlighting the need for beverage companies to reformulate products. This has resulted in regulatory measures, such as sugar taxes, being implemented in various countries to curb consumption of sugary drinks.
- Intense Market Competition: The beverage industry is highly competitive, with numerous players vying for market share. This competition is intensified by the entry of new brands and the expansion of existing ones into new segments. For example, the global non-alcoholic beverage market is fragmented, with the top five companies holding less than 50% of the market share, indicating a highly competitive environment. This fragmentation challenges companies to differentiate their products and maintain customer loyalty.
USA Sports Drinks Market Future Outlook
Over the next five years, the USA sports drinks market is expected to experience significant growth, driven by continuous product innovation, increasing consumer focus on health and wellness, and expanding distribution channels. The rising trend of functional beverages and the incorporation of natural ingredients are anticipated to further propel market expansion.
Market Opportunities
- Demand for Low-Calorie and Natural Ingredients: Consumers are increasingly seeking beverages made with natural ingredients and low-calorie content. This trend is driven by health concerns and a desire for transparency in food and beverage products. The global market for natural sweeteners, such as stevia and monk fruit, has expanded as companies reformulate products to meet this demand. According to the International Food Information Council (IFIC), 74% of consumers are trying to limit or avoid sugars in their diets, creating opportunities for beverages that cater to this preference.
- Expansion into Emerging Markets: Emerging markets present significant growth opportunities for the beverage industry. Countries in Asia, Africa, and Latin America have seen rising disposable incomes and urbanization, leading to increased consumption of both alcoholic and non-alcoholic beverages. For example, India's beverage market has been expanding, with the country's middle class projected to reach 583 million people by 2025, according to the World Economic Forum. This demographic shift offers a substantial consumer base for beverage companies to tap into.
Scope of the Report
|
Product Type |
Isotonic |
|
Packaging Type |
PET/Plastic Bottles |
|
Distribution Channel |
Supermarkets/Hypermarkets |
|
Consumer Demographics |
Age Group |
|
Region |
Northeast Midwest South West |
Products
Key Target Audience
Beverage Manufacturers
Sports Nutrition Companies
Fitness Centers and Gyms
Retailers and Distributors
Ingredient Suppliers
Packaging Companies
Investment and Venture Capital Firms
Government and Regulatory Bodies (e.g., FDA)
Companies
Players Mentioned in the Report
PepsiCo, Inc.
The Coca-Cola Company
Keurig Dr Pepper Inc.
BodyArmor SuperDrink
BA Sports Nutrition
Abbott Nutrition
GlaxoSmithKline plc
Monster Beverage Corporation
Rockstar, Inc.
Arizona Beverage Company
Table of Contents
1. Market Overview
1.1. Definition and Scope
1.2. Market Taxonomy
1.3. Market Growth Rate
1.4. Market Segmentation Overview
2. Market Size (USD Billion)
2.1. Historical Market Size
2.2. Year-On-Year Growth Analysis
2.3. Key Market Developments and Milestones
3. Market Analysis
3.1. Growth Drivers
3.1.1. Increasing Health Consciousness
3.1.2. Rising Participation in Sports and Fitness Activities
3.1.3. Product Innovations and Diversification
3.1.4. Strategic Marketing and Endorsements
3.2. Market Challenges
3.2.1. Health Concerns Over Sugar Content
3.2.2. Intense Market Competition
3.2.3. Regulatory Compliance and Labeling Standards
3.3. Opportunities
3.3.1. Demand for Low-Calorie and Natural Ingredients
3.3.2. Expansion into Emerging Markets
3.3.3. Technological Advancements in Product Formulation
3.4. Trends
3.4.1. Shift Towards Functional Beverages
3.4.2. Growth of E-commerce Distribution Channels
3.4.3. Adoption of Sustainable Packaging Solutions
3.5. Regulatory Landscape
3.5.1. FDA Guidelines on Beverage Ingredients
3.5.2. Labeling Requirements and Health Claims
3.5.3. State-Level Sugar Tax Implications
3.6. SWOT Analysis
3.7. Stakeholder Ecosystem
3.8. Porter's Five Forces Analysis
3.9. Competitive Landscape
4. Market Segmentation
4.1. By Product Type (Value %)
4.1.1. Isotonic
4.1.2. Hypotonic
4.1.3. Hypertonic
4.2. By Packaging Type (Value %)
4.2.1. PET/Plastic Bottles
4.2.2. Metal Cans
4.2.3. Glass Bottles
4.3. By Distribution Channel (Value %)
4.3.1. Supermarkets/Hypermarkets
4.3.2. Convenience Stores
4.3.3. Online Retailers
4.3.4. Specialty Stores
4.4. By Consumer Demographics (Value %)
4.4.1. Age Group
4.4.2. Gender
4.4.3. Income Level
4.5. By Region (Value %)
4.5.1. Northeast
4.5.2. Midwest
4.5.3. South
4.5.4. West
5. Competitive Analysis
5.1. Detailed Profiles of Major Companies
5.1.1. PepsiCo, Inc.
5.1.2. The Coca-Cola Company
5.1.3. Keurig Dr Pepper Inc.
5.1.4. BodyArmor SuperDrink
5.1.5. BA Sports Nutrition
5.1.6. Abbott Nutrition
5.1.7. GlaxoSmithKline plc
5.1.8. Monster Beverage Corporation
5.1.9. Rockstar, Inc.
5.1.10. Arizona Beverage Company
5.1.11. Living Essentials LLC
5.1.12. AJE Group
5.1.13. Extreme Drinks Co.
5.1.14. Cloud 9
5.1.15. Red Bull GmbH
5.2. Cross Comparison Parameters
5.2.1. Number of Employees
5.2.2. Headquarters Location
5.2.3. Year of Establishment
5.2.4. Revenue
5.2.5. Market Share
5.2.6. Product Portfolio
5.2.7. Distribution Network
5.2.8. Recent Developments
5.3. Market Share Analysis
5.4. Strategic Initiatives
5.5. Mergers and Acquisitions
5.6. Investment Analysis
5.6.1. Venture Capital Funding
5.6.2. Government Grants
5.6.3. Private Equity Investments
6. Regulatory Framework
6.1. FDA Regulations on Beverage Ingredients
6.2. Compliance Requirements
6.3. Certification Processes
7. Future Market Size (USD Billion)
7.1. Future Market Size Projections
7.2. Key Factors Driving Future Market Growth
8. Future Market Segmentation
8.1. By Product Type (Value %)
8.2. By Packaging Type (Value %)
8.3. By Distribution Channel (Value %)
8.4. By Consumer Demographics (Value %)
8.5. By Region (Value %)
9. Market Analysts Recommendations
9.1. Total Addressable Market (TAM), Serviceable Available Market (SAM), and Serviceable Obtainable Market (SOM) Analysis
9.2. Customer Cohort Analysis
9.3. Marketing Initiatives
9.4. White Space Opportunity Analysis
Disclaimer Contact UsResearch Methodology
Step 1: Identification of Key Variables
The initial phase involves constructing an ecosystem map encompassing all major stakeholders within the USA sports drinks market. This step is underpinned by extensive desk research, utilizing a combination of secondary and proprietary databases to gather comprehensive industry-level information. The primary objective is to identify and define the critical variables that influence market dynamics.
Step 2: Market Analysis and Construction
In this phase, we compile and analyze historical data pertaining to the USA sports drinks market. This includes assessing market penetration, the ratio of marketplaces to service providers, and the resultant revenue generation. Furthermore, an evaluation of service quality statistics is conducted to ensure the reliability and accuracy of the revenue estimates.
Step 3: Hypothesis Validation and Expert Consultation
Market hypotheses are developed and subsequently validated through computer-assisted telephone interviews (CATIs) with industry experts representing a diverse array of companies. These consultations provide valuable operational and financial insights directly from industry practitioners, which are instrumental in refining and corroborating the market data.
Step 4: Research Synthesis and Final Output
The final phase involves direct engagement with multiple beverage manufacturers to acquire detailed insights into product segments, sales performance, consumer preferences, and other pertinent factors. This interaction serves to verify and complement the statistics derived from the bottom-up approach, thereby ensuring a comprehensive, accurate, and validated analysis of the USA sports drinks market.
Frequently Asked Questions
01. How big is the USA sports drinks market?
The USA Sports Drinks market is valued at USD 12 billion, based on a five-year historical analysis. This market is primarily driven by increasing health consciousness among consumers, coupled with rising participation in sports and fitness activities.
02. What are the challenges in the USA sports drinks market?
Challenges include health concerns over sugar content, intense market competition, and regulatory compliance with labeling standards. These factors necessitate continuous innovation and adherence to health guidelines by manufacturers.
03. Who are the major players in the USA sports drinks market?
Key players in the market include PepsiCo, Inc., The Coca-Cola Company, Keurig Dr Pepper Inc., BodyArmor SuperDrink, and BA Sports Nutrition. These companies dominate due to their extensive distribution networks, strong brand presence, and diverse product portfolios.
04. What are the growth drivers of the USA sports drinks market?
The market is propelled by factors such as increasing health consciousness, rising participation in sports and fitness activities, product innovations, and strategic marketing efforts by key industry players.
Why Buy From Us?
 Framework")
What makes us stand out is that our consultants follows Robust, Refine and Result (RRR) methodology. i.e. Robust for clear definitions, approaches and sanity checking, Refine for differentiating respondents facts and opinions and Result for presenting data with story

We have set a benchmark in the industry by offering our clients with syndicated and customized market research reports featuring coverage of entire market as well as meticulous research and analyst insights.

While we don't replace traditional research, we flip the method upside down. Our dual approach of Top Bottom & Bottom Top ensures quality deliverable by not just verifying company fundamentals but also looking at the sector and macroeconomic factors.

With one step in the future, our research team constantly tries to show you the bigger picture. We help with some of the tough questions you may encounter along the way: How is the industry positioned? Best marketing channel? KPI's of competitors? By aligning every element, we help maximize success.

Our report gives you instant access to the answers and sources that other companies might choose to hide. We elaborate each steps of research methodology we have used and showcase you the sample size to earn your trust.

If you need any support, we are here! We pride ourselves on universe strength, data quality, and quick, friendly, and professional service.